

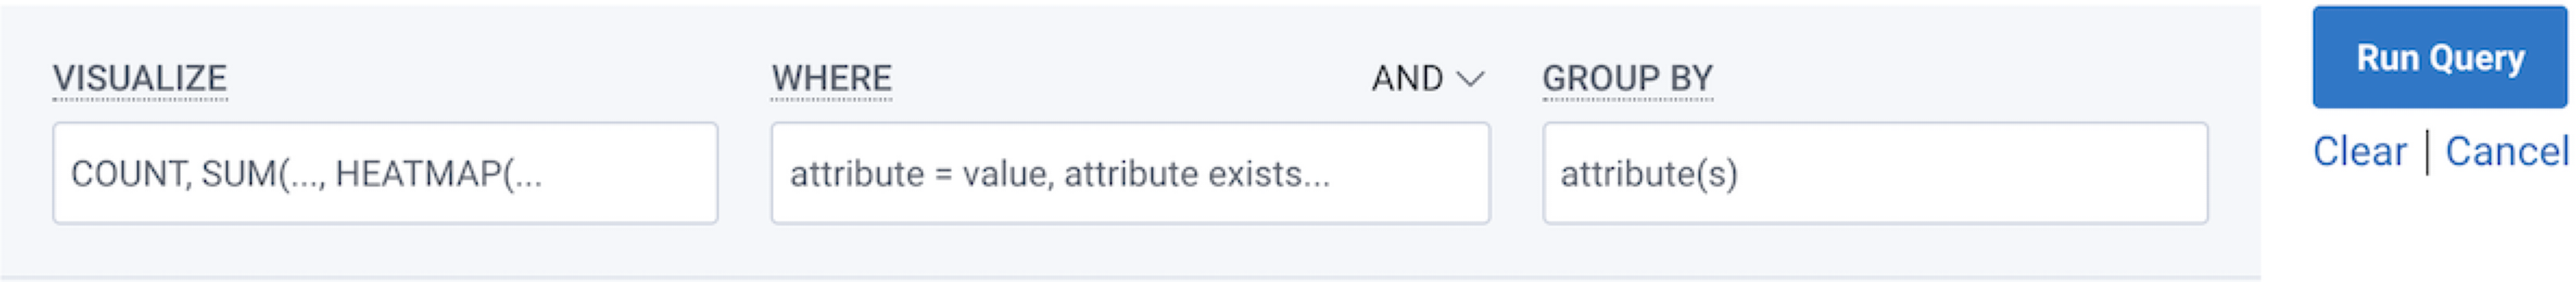
SELECT, WHERE, and GROUP BY clauses, located at the top of the Query Builder.
SELECT- Performs a calculation and displays a corresponding graph over time. MostSELECTqueries return a line graph while theHEATMAPvisualization shows the distribution of data over timeWHERE- Filters based on attribute parameter(s)GROUP BY- Groups fields by attribute parameter(s)
Number of Total Root Spans
This query calculates the total number of root spans received by your application by looking for all spans without a parent span ID.is_root is an alias for trace.parent_id does not exist, and when used with a WHERE clause, both filter to show only root spans.
If trace.parent_id does not exist is used, Honeycomb automatically updates it to is_root in Query Builder.
Performance Metrics
What are the Slowest Traces in the Application
This query identifies the slowest trace in your application, in terms of duration (duration_ms), and provides information about the specific events and spans that make up that trace.
Use to:
- to find potential performance issues
- understand the root cause of slow response times
What is the P90 Duration of Database Calls
This query calculates theP90 duration of your database calls, which is the duration at which 90% of your database calls complete.
Use to:
- understand the performance of your database
- identify potential issues or bottlenecks
What are the Total Bytes Sent on Requests
This query calculates the total bytes sent on requests, which is the total amount of data that is transmitted by your service in response to requests.HEATMAP creates a histogram data visualization.
Use BubbleUp to further investigate and compare values.
Use to:
- understand the performance and efficiency of your service
- analyze your data further with BubbleUp
How Much Time Database Calls Take in a Trace
This query provides insight into the performance of your application. If a significant amount of time is spent on database calls, opportunity to improve speed and performance in the way that your application interacts with the database.What is the Rate at Which the Average Duration for the Service Increases or Decreases
This query calculates the rate of change in the average amount of time that it takes for your service to complete a request.
Use to:
- understand the performance of your service
- identify potential trends or patterns in the duration of your service’s requests
Identify Errors Based on API Entry Point
This query uses relational fields to identify errors in the system filtered by top-level API entry point.Find Properties in a Child Span and Group By the Root Span
This query uses relational fields to identify the P95 of database SELECT * statements and find the http.route from which they are being called.Identify Slow Database Calls for a Service
This query uses relational fields to identify slow database calls for a service.Error Analysis
Which Exception Happens the Most in the Service
This query provides insight into potential problems in your system. For example, when running a web service that processes online transactions and the most frequent exception being thrown is “TimeoutException”, then your service may have issues connecting to the database to retrieve information about the transactions.Which Spans Contain Which Exceptions
Some OpenTelemetry instrumentation or SDKs will record exception messages on Span Events rather than on the Span itself. This query identifies which Span Events events contain exceptions, and then groups by the name of the Span that corresponds to that Span Event, the name of the service, and then the name of the exception.Show Only Errored Traces and Their Latency
This query helps to investigate the reasons for errors and latencies. For example, if you know that a errored trace called “XYZ” experiences high latencies, you can take further steps like debugging the code for that trace, adding more resources to handle the workload, or implementing error handling and retry mechanisms.Which Tenants Experience Errors on Certain Endpoints
This query identifies which tenants, or specific groups of users or data within a software system, experience endpoint errors. With this knowledge, you can provide specialized support and troubleshooting to help resolve the issue. For example, when running a storage service with multiple tenants, you notice that a particular tenant experiences a high number of errors when accessing their data on your endpoint. This may indicate that a problem exists with their configuration or usage of your service.Identify Errors Based on API Entry Point
This query uses relational fields to identify errors in the system filtered by top-level API entry point.Identify User Log in Error
This query uses relational fields to identify a user who reported that they cannot log in. Theuser_id is only on the root span, but the error in the auth service exists on a child span within the trace.
Get a Count of Root Spans with a Child Span that Contains an Error
This query uses relational fields to identify root spans that have a child span that has an error.Show How Requests to a Service Behave When Another Service in the Trace Experiences a Specific Error
This query uses relational fields to show how requests to a service behave when another service in the trace experiences a specific error.Identify Errors from Database Spans for Traces that Reach a Certain Duration
This query uses relational fields to return the error from database spans for traces longer than a specified duration.Find Spans that Contain Timeout Errors Where Immediate Parent Span Initiated a Database Call
This query uses relational fields to identify spans that contain a timeout error and their immediate parent span initiated a database call.Instrumentation Gap Detection
To detect where an instrumentation gap exists.Identify Missing Field That Should Exist
This query uses relational fields to identify a field that should exist, but currently does not or has no value.
Use to:
- figure out why a specific field (or set of fields) is missing on several spans.
User Behavior
What is the Number of Requests per Time Period
This query calculates the total number of requests received by your application, and provides a breakdown of those requests by different dimensions, such as the type of request, the endpoint, or the tenant.
Use to:
- monitor the overall traffic and usage of your application
What is the Number of Concurrent Calls for a Specific Span
This query calculates the number of concurrent calls for the individual, specific span namedmy-span, which is the number of calls to that span that are executing simultaneously.
Use to:
- understand the workload and performance of your span
- identify potential issues or bottlenecks that may be affecting the concurrency of your calls
What is the Number of Distinct Users in the Application
This query displays the level of demand on your system and the resources it uses. If the number of distinct users increases over time, it may indicate that your system is approaching its capacity and that action may be needed to improve its performance.Endpoint Usage
What is the Load Across Each Server
This query calculates the number of executed, independent traces on each server.
Use to:
- understand the workload and performance of your servers
- identify potential issues or bottlenecks
Which Tenant hits Each Endpoint the Most and Their Highest Experienced Latency
The query identifies tenants, or specific groups of users or data within a software system, the endpoints they use, and their maximum experienced latency. For example, if you know that a certain tenant hits endpoint/api/users the most and experiences high latencies on that endpoint, you can investigate the reasons for those latencies and take steps to improve the performance of that endpoint for that tenant.
High CPU Usage with User Login Request
This query uses relational fields to identify spans with high CPU usage where the root span has an operation of “UserLoginRequest”.Advanced Visualization
Distribution Density of Status Codes Over Time
This query presents the frequency and density of different status codes that are returned by your application during a specified time period.HEATMAP creates a histogram data visualization.
Use BubbleUp to further investigate and compare values.
Use to:
- understand the performance and behavior of your application
- analyze your data further with BubbleUp
Relational Fields
These queries use relational fields for advanced filtering. To learn about more best practices, visit Best Practices for Querying using Relational Fields.root prefix
Identify Errors Based on API Entry Point
This query uses relational fields to identify errors in the system filtered by top-level API entry point.Identify Errors from Database Spans for Traces that Reach a Certain Duration
This query uses relational fields to return the error from database spans for traces longer than a specified duration.Find Properties in a Child Span and Group By the Root Span
This query uses relational fields to identify the P95 of database SELECT * statements and find the http.route from which they are being called.Identify Slow Database Calls for a Service
This query uses relational fields to identify slow database calls for a service.Identify Errors Based on API Entry Point
This query uses relational fields to identify errors in the system filtered by top-level API entry point.Identify User Log in Error
This query uses relational fields to identify a user who reported that they cannot log in. Theuser_id is only on the root span, but the error in the auth service exists on a child span within the trace.
Identify Errors from Database Spans for Traces that Reach a Certain Duration
This query uses relational fields to return the error from database spans for traces longer than a specified duration.High CPU Usage with User Login Request
This query uses relational fields to identify spans with high CPU usage where the root span has an operation of “UserLoginRequest”.parent prefix
Identify Missing Field That Should Exist
This query uses relational fields to identify a field that should exist, but currently does not or has no value.
Use to:
- figure out why a specific field (or set of fields) is missing on several spans.
Find Spans that Contain Timeout Errors Where Immediate Parent Span Initiated a Database Call
This query uses relational fields to identify spans that contain a timeout error and their immediate parent span initiated a database call.child prefix
Select P99 Duration for a Span Only When it has Called into Another Specific Span
You have a span namedspanA that sometimes has a child named spanB.
You want to select the P99 of spanA when it has called into spanB.
Select Sampling of Children for a Given Span
You have a span namedspanA that may call a number of different operations.
You want to see a list/sampling of the functions into which it calls directly.
none prefix
Find All Traces with a Missing Root Span
You want to find all traces that are missing a root span. This can help you identify where your instrumentation may need some troubleshooting.Find Instances of a Process Where No Retry Succeeded
You have a process namedProcessA that may retry multiple times if it fails, before giving up (and for example, executing a rollback).
This means that you might have a few instances of the same pattern repeat in your trace.
If the process succeeds, one of them will also contain a success span named Commit.
You want to find instances where none of the retries succeeded, and examine the root spans that kicked off those instances to explore patterns that might emerge.
anyX prefix
Show How Requests to a Service Behave When Another Service in the Trace Experiences a Specific Error
This query uses relational fields to show how requests to a service behave when another service in the trace experiences a specific error.Get a Count of Root Spans with a Child Span that Contains an Error
This query uses relational fields to identify root spans that have a child span that has an error.Find Traces that Contain a Specific 3-way Combination
You do not know your exact trace structure, but you have a hypothesis that a certain function call (functionA) and a certain database transaction (db.rollback) might both be related to some 500 errors that you are seeing.
You want to find traces where:
status_codeis returned as500functionAis called at some point in the tracedb.rollbackis called at some point in the trace
Identify the location of a data/field within a trace
You do not know your exact trace structure, but you want to see customer team names and their device platform alongside some data you are looking at from a service namedServiceA.
Team name and device platform are not available on the spans you are currently targeting, but they may be available on other spans (team.name is available on one specific span, platform is available on another specific span).