Investigate Log Data in Honeycomb

Once your log data is in Honeycomb, you can use it to analyze and explore your systems in novel ways.

Before You Begin 

Before beginning this guide, you should have:

Explore Your Data 

In Honeycomb, you can slice and dice your data from your Home view, or create Boards to save relevant queries and visualizations. Either way, you will want to leverage Honeycomb’s features to create Triggers and explore anomalies using BubbleUp and Correlations.

Slice and Dice Your Data 

Once you have log data in Honeycomb, navigate to the Home view and select your log dataset to begin exploring your data.

The Logs view contains visualizations specially designed for exploring log data.
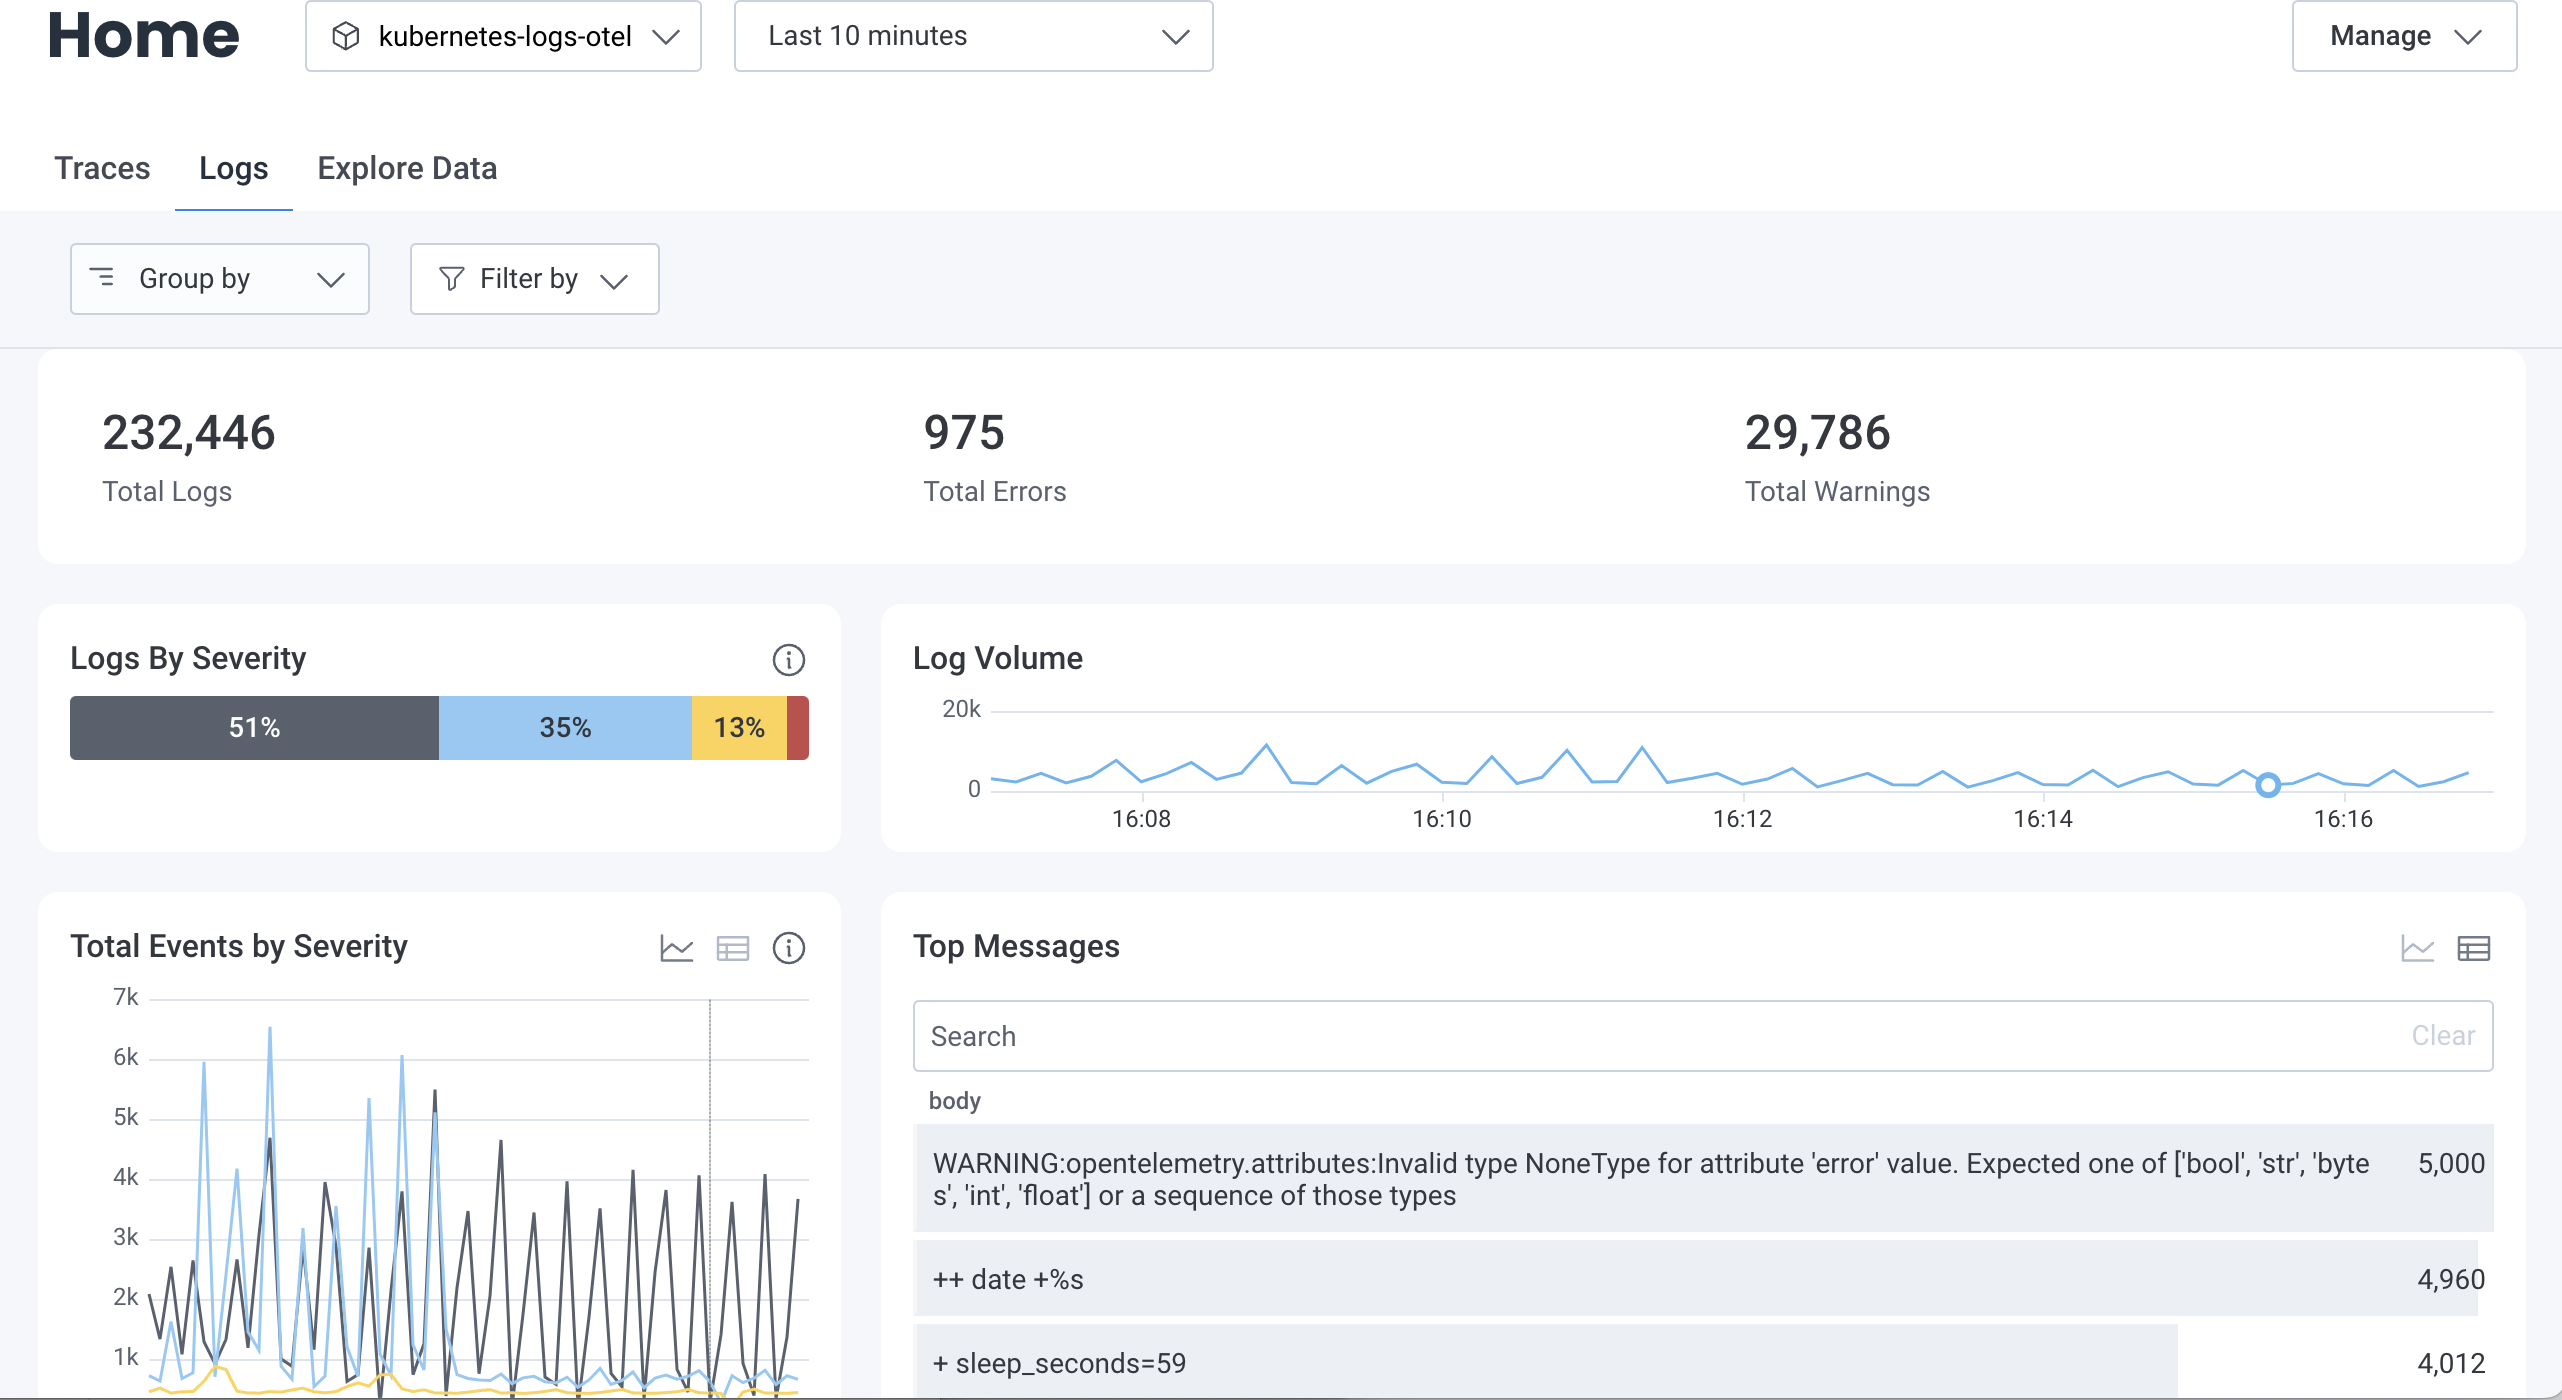
The visualizations displayed in Honeycomb's Home area on the Logs view. They include total logs, total errors, total warnings, logs by severity, log volume, total events by severity, top messages, total errors by severity, and top errors. Chart and table visualizations have accompanying icons that let you toggle between chart and table view. The top messages table has an accompanying search bar that lets you filter by words in the message. Above all of the visualizations, there are two dropdowns that allow you to group or filter by fields. At the very top of the page, there are two dropdowns that allow you to select the dataset and the time range.

In addition, when you view events in the Explore Data view, you can change your data display to present data as log lines.

Query Builder with Explore Data tab selected and log lines display

To learn more about the log lines display, visit Explore Events: Events View.

Create a Board 

For quick reference over time, you should create a Board that you can customize to show log-specific items of interest.

Create Triggers 

Once you have created a Board, you will likely want to configure some Triggers, so you can receive notifications when your data in Honeycomb crosses defined thresholds.

To create a Trigger:

  1. On your Board, locate a Query from which you want to create a Trigger.
  2. Select the query to open it in the Query Builder display.
  3. Select the three-dot overflow menu, located to the left of Run Query, and select Make Trigger.
  4. Configure the trigger by defining trigger details, an alert threshold, and your notification preferences.

Investigate Anomalies 

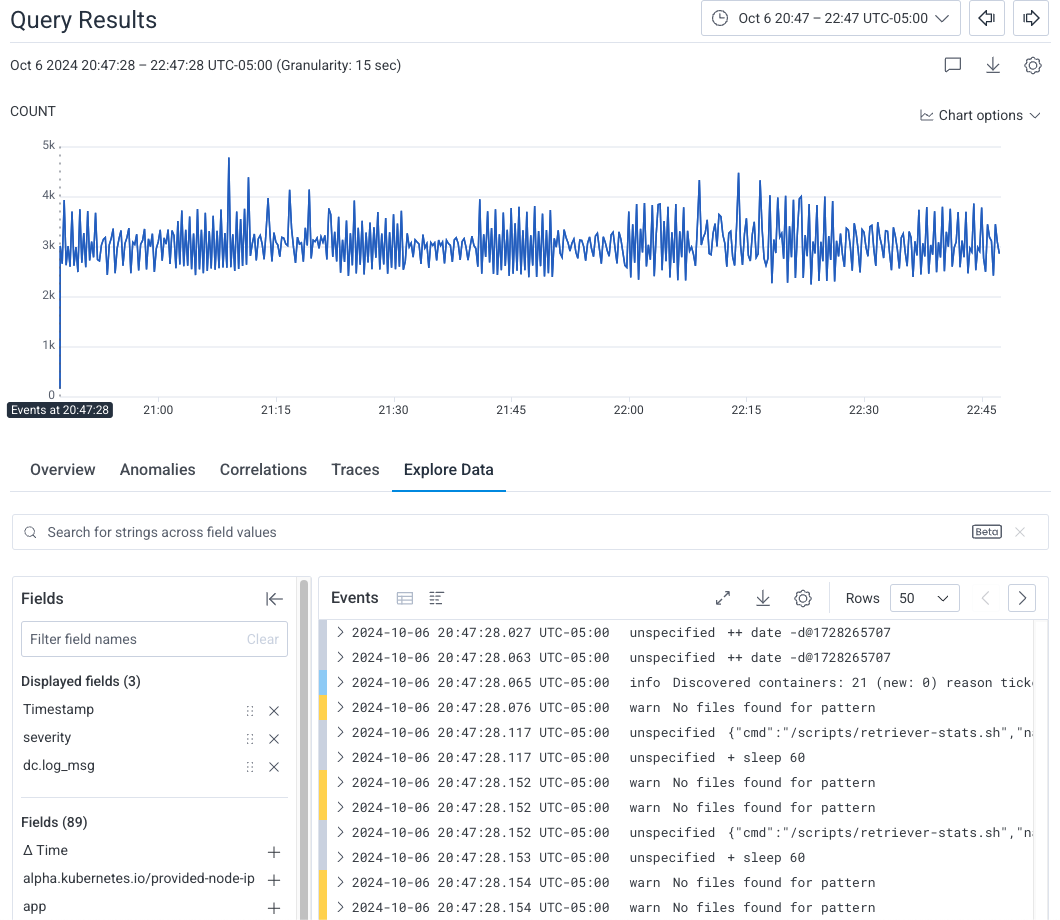
Simplify debugging by using the core analysis loop–Honeycomb BubbleUp, Correlations, and rich queryable data–to dig in to application behavior.

Identify Commonalities in Structured Logs 

Examine what a subset of logs might have in common using BubbleUp.

Example

Scenario: You have structured MySQL slow query logs and want to discover specific queries that are running slower than expected.

Solution: Run a query that visualizes a heatmap on query_time, then use BubbleUp to identify similarities between the slow queries.

  1. Navigate to the Query Builder.

  2. Build the following query:

    VISUALIZE
    HEATMAP(query_time)
  3. Select Run Query.

  4. In the Query Results section, locate the heatmap, and draw a box around logs that have a longer duration than you prefer.

  5. From the context menu, select Investigate with BubbleUp. A screenshot depicting a heatmap on the query_time field with a BubbleUp box drawn around logs with a long duration.

  6. Locate the BubbleUp view, and use the charts to examine the attributes that that logs inside your selection have in common. A screenshot depicting the dimensions BubbleUp highlights on the selection.

Notice the statement chart–each of the problematic logs contains the same DELETE statement. You can now use the normalized_query chart to see the exact shape of the query that you need to optimize.

Parse Unstructured Logs 

Because of the shape of unstructured log data in Honeycomb, unstructured logs can be hard to query. To improve the experience and make unstructured logs more useful, use custom fields to parse meaningful information out of the message attribute.

  1. Create a custom field.

  2. Leverage the REG_VALUE operation to parse log data using regular expressions.