Use the query examples below to explore the performance and behavior of your application. The specific attributes below may or may not exist in your data and environment.
Enter each example query using the Query Builder.
These example queries use two to three of the VISUALIZE, WHERE, and GROUP BY clauses, located at the top of the Query Builder.
VISUALIZE - Performs a calculation and displays a corresponding graph over time. Most VISUALIZE queries return a line graph while the HEATMAP visualization shows the distribution of data over timeWHERE - Filters based on attribute parameter(s)GROUP BY - Groups fields by attribute parameter(s)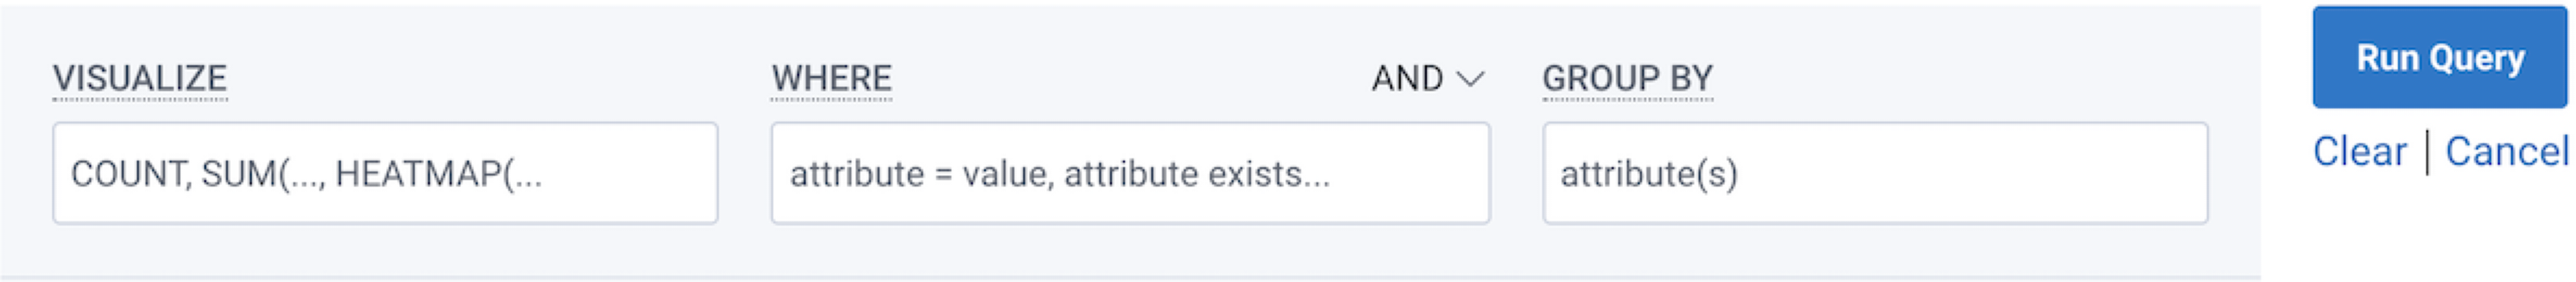
This query calculates the total number of root spans received by your application by looking for all spans without a parent span ID.
| VISUALIZE | WHERE |
|---|---|
| COUNT | is_root |
is_root is an alias for trace.parent_id does not exist, and when used with a WHERE clause, both filter to show only root spans.
If trace.parent_id does not exist is used, Honeycomb automatically updates it to is_root in Query Builder.
This query identifies the slowest trace in your application, in terms of duration (duration_ms), and provides information about the specific events and spans that make up that trace.
| VISUALIZE | WHERE | GROUP BY |
|---|---|---|
| MAX(duration_ms) | is_root | name |
Use to:
This query calculates the P90 duration of your database calls, which is the duration at which 90% of your database calls complete.
| VISUALIZE | WHERE | GROUP BY |
|---|---|---|
| P90(duration_ms) | db.statement exists | db.statement |
Use to:
This query calculates the total bytes sent on requests, which is the total amount of data that is transmitted by your service in response to requests.
HEATMAP creates a histogram data visualization.
Use BubbleUp further investigate and compare values.
| VISUALIZE | WHERE | GROUP BY |
|---|---|---|
| SUM(http.request_content_length) HEATMAP(http.request_content_length) |
http.request_content_length exists | name |
Use to:
This query provides insight into the performance of your application. If a significant amount of time is spent on database calls, opportunity to improve speed and performance in the way that your application interacts with the database.
| VISUALIZE | WHERE | GROUP BY |
|---|---|---|
| SUM(duration_ms) | db.statement exists trace.trace_id = abc123 |
db.statement |
This query calculates the rate of change in the average amount of time that it takes for your service to complete a request.
| VISUALIZE | WHERE | GROUP BY |
|---|---|---|
| RATE_AVG(duration_ms) | is_root | name |
Use to:
This query uses relational fields to identify errors in the system filtered by top-level API entry point.
| VISUALIZE | WHERE | GROUP BY |
|---|---|---|
| COUNT | error exists AND meta.annotation_type = span_event AND root.api_entry_point = <api-entry-point> |
name |
This query uses relational fields to identify the P95 of database SELECT * statements and find the http.route from which they are being called.
| VISUALIZE | WHERE | GROUP BY |
|---|---|---|
| P95(duration_ms) | db.statement starts with select * | root.http.route |
This query uses relational fields to identify slow database calls for a service.
| VISUALIZE | WHERE |
|---|---|
| AVG(duration_ms) | duration_ms > 10000 AND root.service = /cart/checkout |
This query provides insight into potential problems in your system. For example, when running a web service that processes online transactions and the most frequent exception being thrown is “TimeoutException”, then your service may have issues connecting to the database to retrieve information about the transactions.
| VISUALIZE | WHERE | GROUP BY |
|---|---|---|
| COUNT | exception.message exists | exception.message |
Some OpenTelemetry instrumentation or SDKs will record exception messages on Span Events rather than on the Span itself. This query identifies which Span Events events contain exceptions, and then groups by the name of the Span that corresponds to that Span Event, the name of the service, and then the name of the exception.
| VISUALIZE | WHERE | GROUP BY |
|---|---|---|
| COUNT | parent_name exists exception.message exists |
parent_name service.name exception.message |
This query helps to investigate the reasons for errors and latencies. For example, if you know that a errored trace called “XYZ” experiences high latencies, you can take further steps like debugging the code for that trace, adding more resources to handle the workload, or implementing error handling and retry mechanisms.
| VISUALIZE | WHERE | GROUP BY |
|---|---|---|
| COUNT HEATMAP(duration_ms) |
error = true is_root |
name |
This query identifies which tenants, or specific groups of users or data within a software system, experience endpoint errors. With this knowledge, you can provide specialized support and troubleshooting to help resolve the issue.
For example, when running a storage service with multiple tenants, you notice that a particular tenant experiences a high number of errors when accessing their data on your endpoint. This may indicate that a problem exists with their configuration or usage of your service.
| VISUALIZE | WHERE | GROUP BY |
|---|---|---|
| COUNT | error = true is_root app.tenant exists |
app.tenant name |
This query uses relational fields to identify errors in the system filtered by top-level API entry point.
| VISUALIZE | WHERE |
|---|---|
| COUNT | error exists AND root.api_entry_point = api-entry-point |
This query uses relational fields to identify a user who reported that they cannot log in.
The user_id is only on the root span, but the error in the auth service exists on a child span within the trace.
| VISUALIZE | WHERE |
|---|---|
| COUNT | root.user_id = <user-id> AND error exists AND service.name = LoginService |
This query uses relational fields to identify root spans that have a child span that has an error.
| VISUALIZE | WHERE | GROUP BY |
|---|---|---|
| COUNT | is_root AND any.error exists |
name |
This query uses relational fields to show how requests to a service behave when another service in the trace experiences a specific error.
| VISUALIZE | WHERE |
|---|---|
| COUNT | service.name = <service> AND any.service.name = <another-service> AND any.error = <error-name> |
This query uses relational fields to return the error from database spans for traces longer than a specified duration.
| VISUALIZE | WHERE |
|---|---|
| COUNT | root.duration_ms > <duration> AND name = db.statement AND error exists |
This query uses relational fields to identify spans that contain a timeout error and their immediate parent span initiated a database call.
| VISUALIZE | WHERE |
|---|---|
| COUNT | error_code = TimeoutError AND parent.operation = DatabaseCall |
To detect where an instrumentation gap exists.
This query uses relational fields to identify a field that should exist, but currently does not or has no value.
| VISUALIZE | WHERE |
|---|---|
| COUNT | <field> does-not-exist AND parent.<field> does-not-exist |
Use to:
This query calculates the total number of requests received by your application, and provides a breakdown of those requests by different dimensions, such as the type of request, the endpoint, or the tenant.
| VISUALIZE | WHERE | GROUP BY |
|---|---|---|
| COUNT | is_root | name |
Use to:
This query calculates the number of concurrent calls for the individual, specific span named my-span, which is the number of calls to that span that are executing simultaneously.
| VISUALIZE | WHERE |
|---|---|
| CONCURRENCY | name = my-span |
Use to:
This query displays the level of demand on your system and the resources it uses. If the number of distinct users increases over time, it may indicate that your system is approaching its capacity and that action may be needed to improve its performance.
| VISUALIZE | WHERE |
|---|---|
| COUNT_DISTINCT(app.user_id) | app.user_id exists |
This query calculates the number of executed, independent traces on each server.
| VISUALIZE | WHERE | GROUP BY |
|---|---|---|
| COUNT | is_root | host.name |
Use to:
The query identifies tenants, or specific groups of users or data within a software system, the endpoints they use, and their maximum experienced latency.
For example, if you know that a certain tenant hits endpoint /api/users the most and experiences high latencies on that endpoint, you can investigate the reasons for those latencies and take steps to improve the performance of that endpoint for that tenant.
| VISUALIZE | WHERE | GROUP BY |
|---|---|---|
| COUNT MAX(duration_ms) |
is_root app.tenant exists |
app.tenant name |
This query uses relational fields to identify spans with high CPU usage where the root span has an operation of “UserLoginRequest".
| VISUALIZE | WHERE |
|---|---|
| AVG(cpu_usage) | root.operation = UserLoginRequest AND cpu_usage > 0.8 |
This query presents the frequency and density of different status codes that are returned by your application during a specified time period.
HEATMAP creates a histogram data visualization.
Use BubbleUp further investigate and compare values.
| VISUALIZE | WHERE | GROUP BY |
|---|---|---|
| HEATMAP(http.status_code) | http.status_code exists | name |
Use to: