With Correlations, compare your query results and data from a Board in the same view.
It may be useful to view infrastructure metrics for your systems alongside query results from non-metrics datasets. For instance, a system running out of memory, CPU, or network resources might be the reason for an out-of-compliance SLO or an alerting trigger. Seeing the graph of the problem alongside graphs of relevant system resources could confirm or deny this kind of hypothesis.
For example, when investigating a problem with your backend services, you may want to see system memory, CPU, and disk utilization in conjunction with the backend services tracing data. Use or create a Board with system memory, CPU, and disk utilization queries. Then, query your backend services tracing data, and compare it to your aforementioned Board using the Correlations tab in Query Builder.
Select the Correlations tab when using Query Builder. The Correlations tab content appears below the Query Builder results.
The Correlations tab consists of a dropdown window that displays the selected data source, a Filter search box, and up to the first six saved queries from the selected data source.
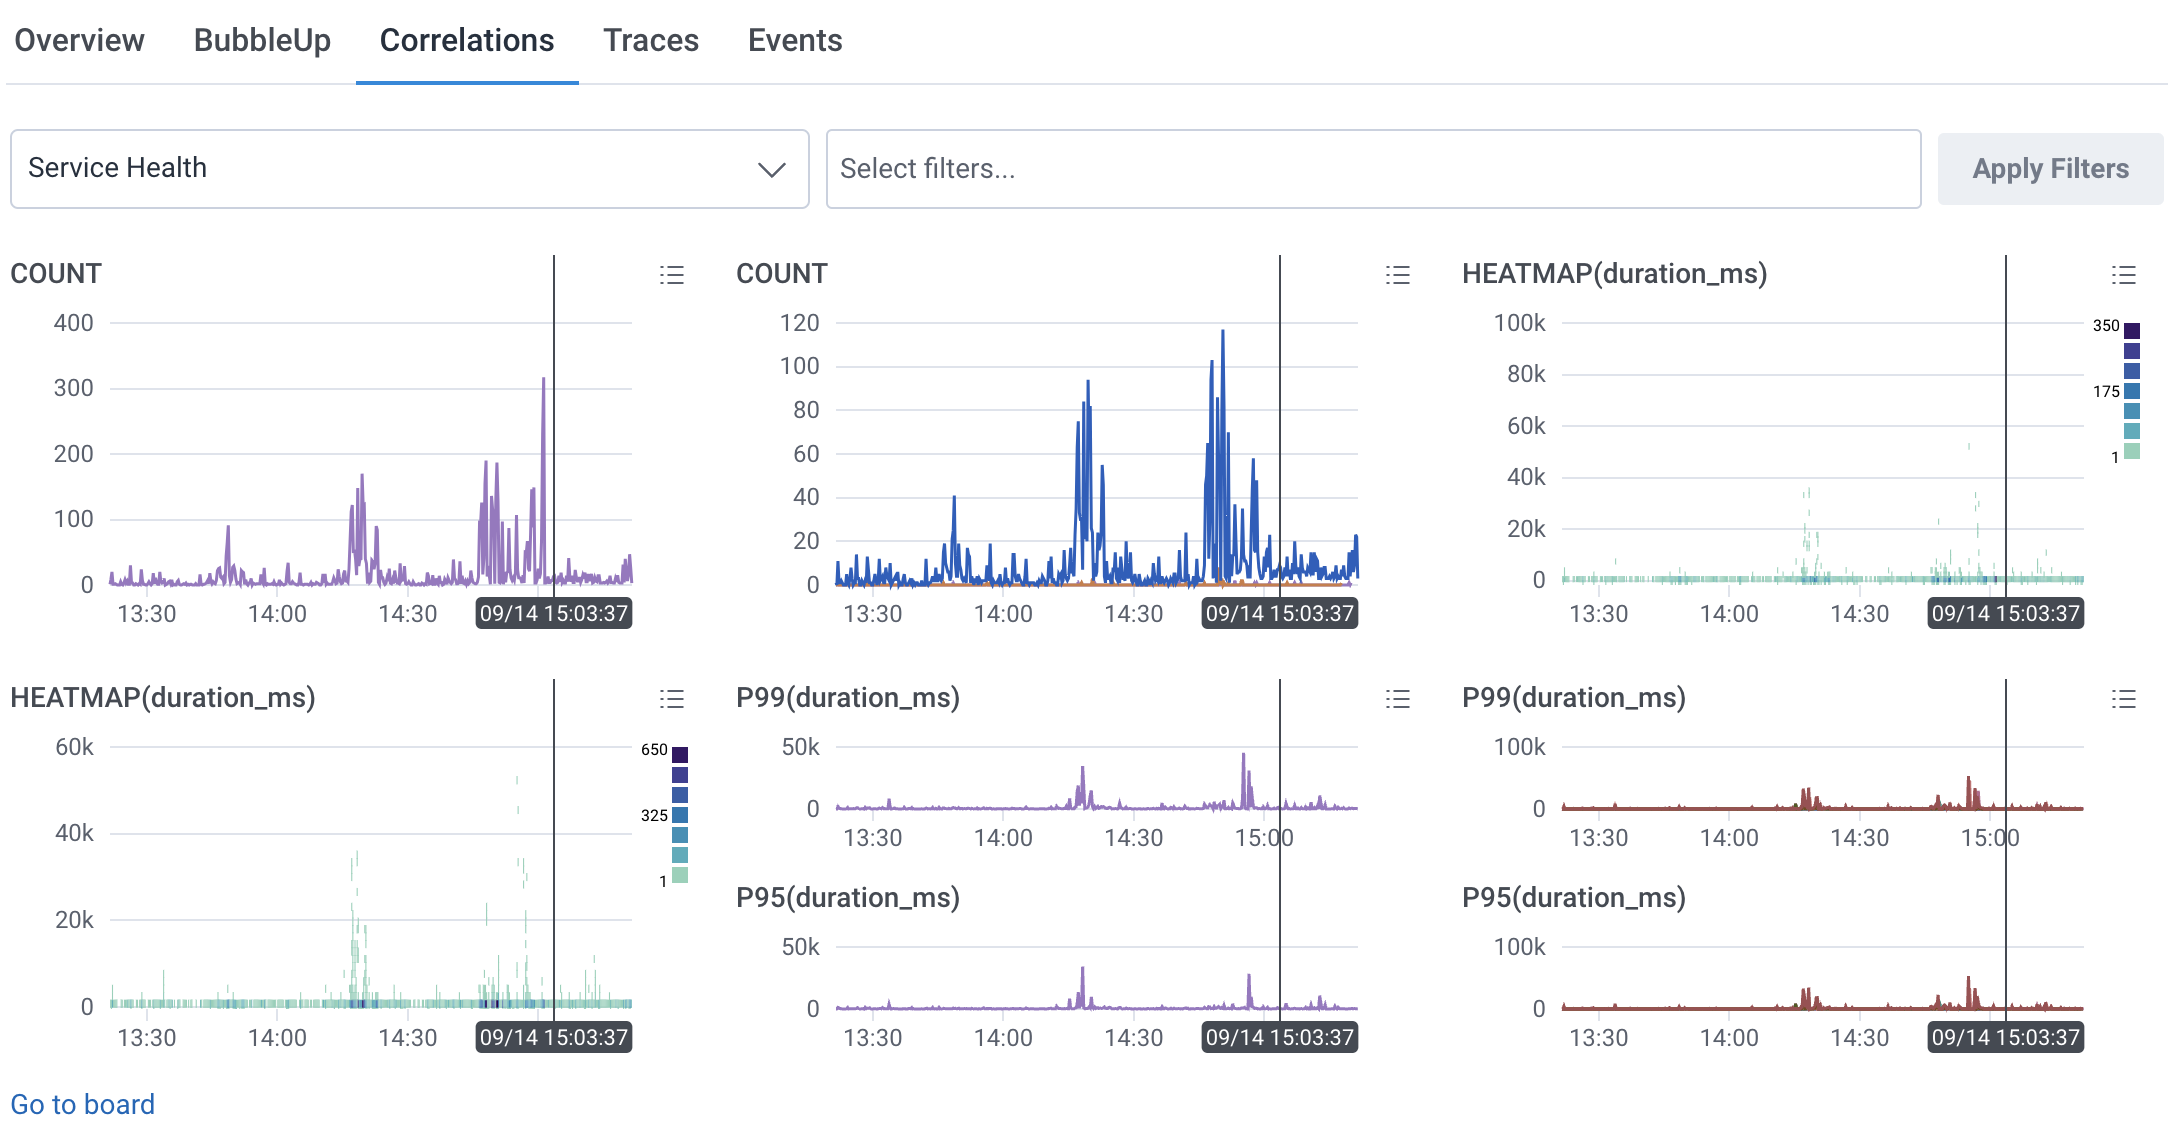
Each query contains one or more chart visualization(s) and a bulleted list icon (![]() ).
Hover over the bulleted list icon (
).
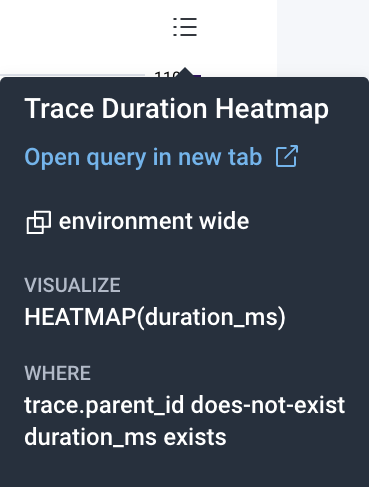
Hover over the bulleted list icon (![]() ) to reveal the query’s name and composition, and an option to open the query in a new tab. Selecting anywhere in the expanded query details opens the query in a new tab.
) to reveal the query’s name and composition, and an option to open the query in a new tab. Selecting anywhere in the expanded query details opens the query in a new tab.
To change the view based on a different board, select the dropdown window and choose from a Board or a Suggested Metrics view. (Suggested Metrics views only populate if the fields in your dataset match a predetermined list.) You must create the Board beforehand in order to use it in this interface.
To set a default Board view in Correlations, navigate to the Default Correlations Board setting in Dataset Settings.
Use a filter when searching for specific results. To filter, use the Select Filters… search box to enter one or more filter parameters. Suggested parameter fields appear, based on your data. Select Apply Filters to apply the parameter(s) to all the displayed queries on your board.
When you apply filters, the displayed queries also update to include a WHERE clause with the filter parameter(s).
For example, if you have a board called “Errors Overview”, which looks at all the errors occurring in your system, you can apply a filter to look at errors occurring in the frontend service that you own.
In this case, a filter of service.name=frontend applies that parameter on top of every existing query on the board to output service-specific results.
If a filter parameter does not exist as a field within a chart, then the chart displays a “No results in this time range” message.
To remove a filter, use the icon (![]() ) next to each filter.
) next to each filter.