Use Honeycomb to learn and explore your AWS data.
Use the Explore Data tab to orient on fields within your logs and metrics data. Explore your data further with Query Builder. For AWS logs and metrics, try some techniques listed below and explore associated resources.
BubbleUp allows you to examine what a subset of logs might have in common.
Using structured MySQL slow query logs as an example, BubbleUp can help to discover specific queries that are running slower than expected.
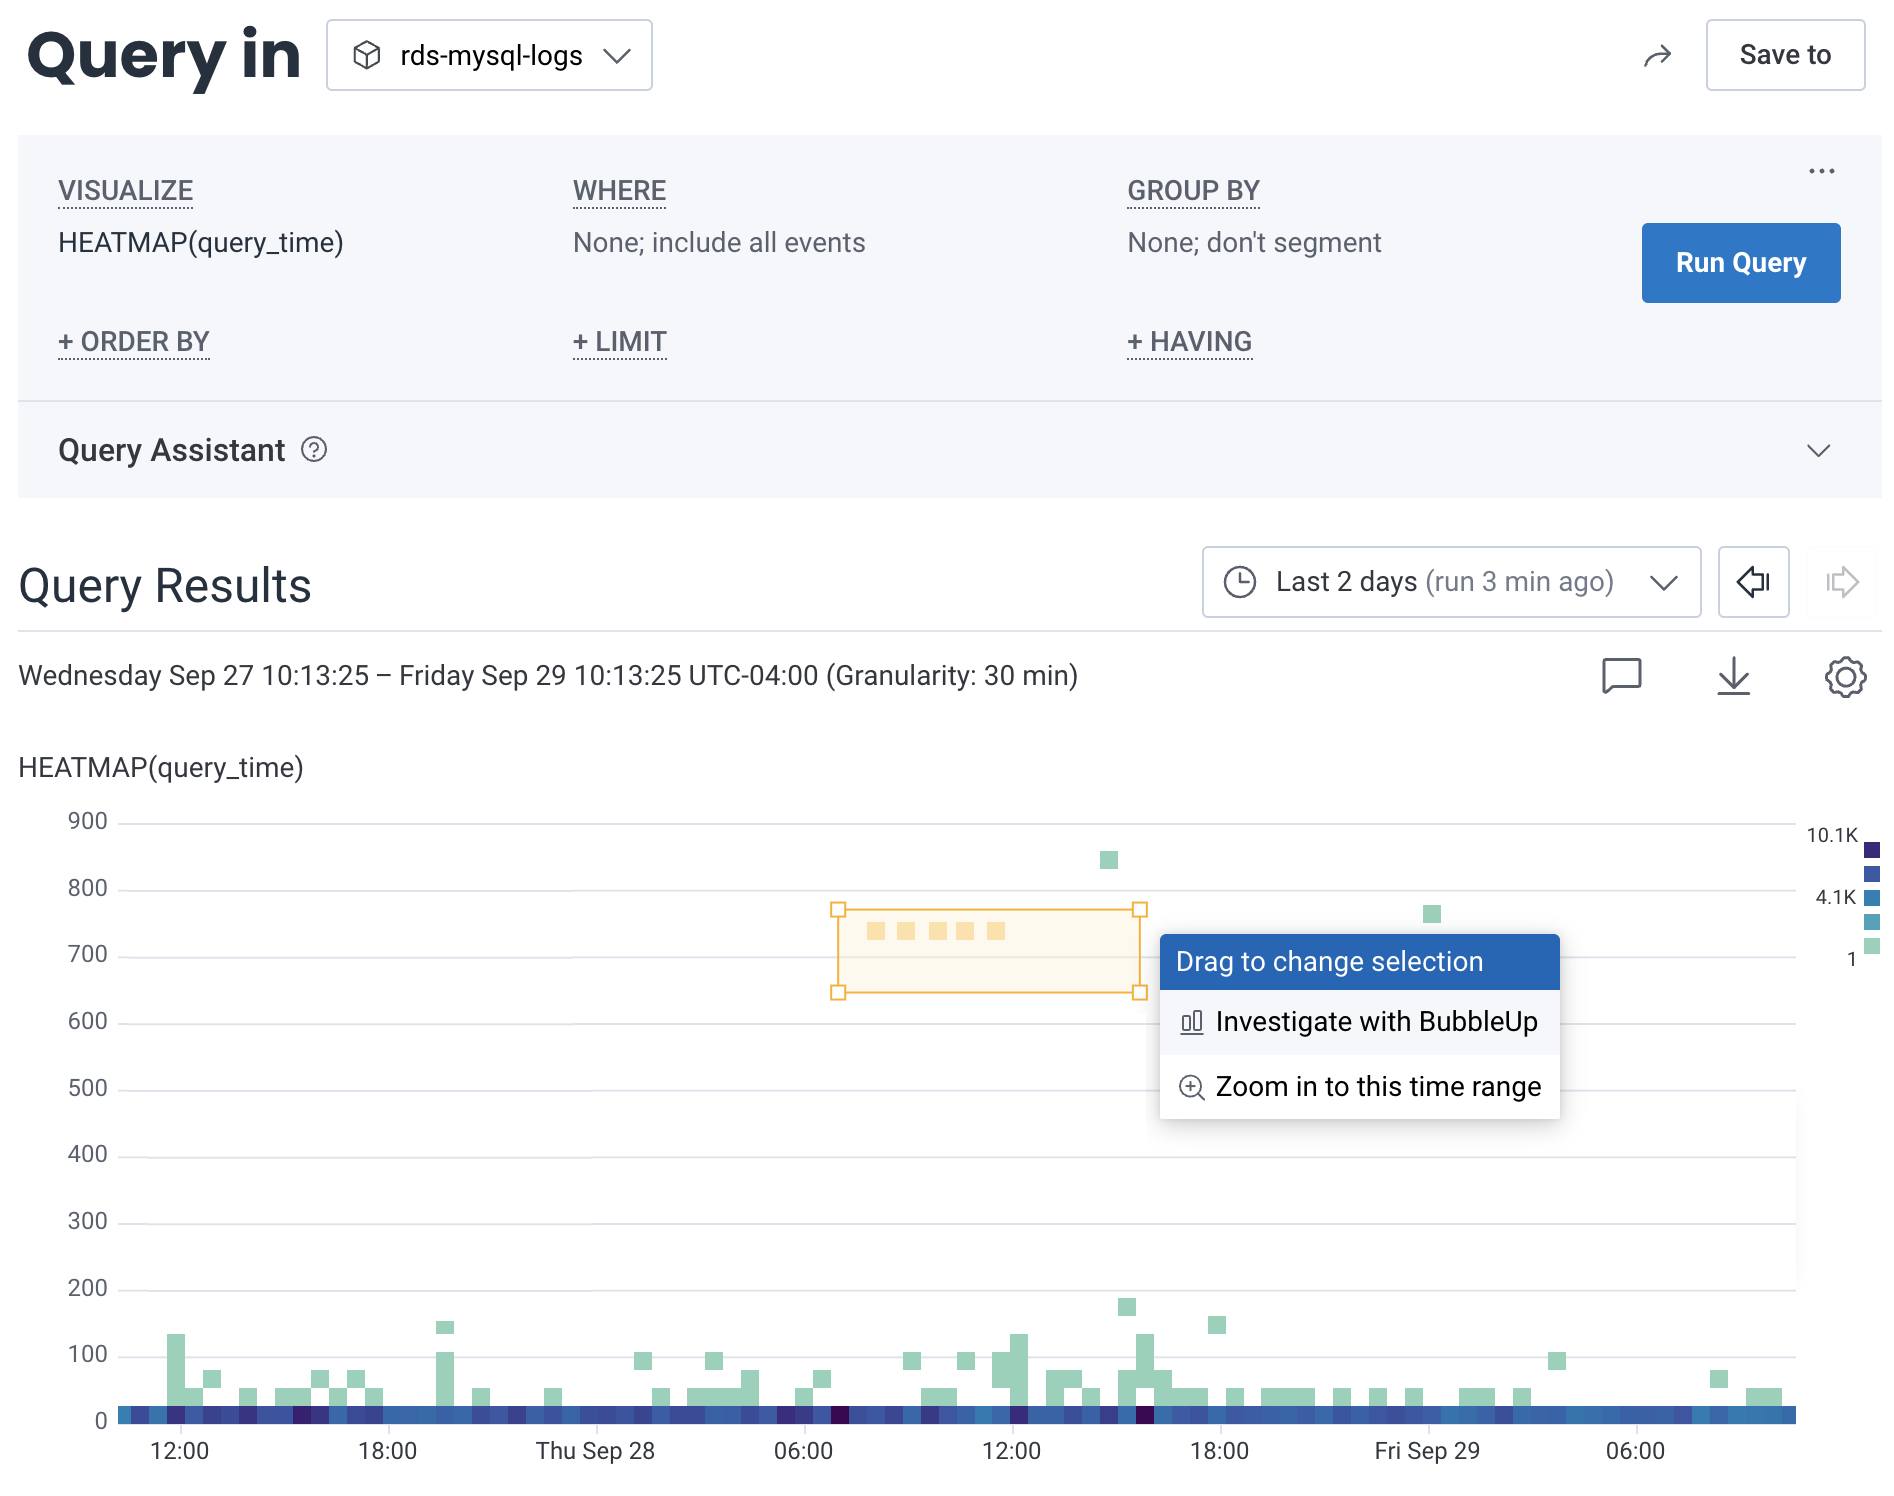
In this example, we created a query that visualizes a heatmap on query_time, or VISUALIZE HEATMAP(query_time).
BubbleUp allows us to draw a box around logs that have a longer duration than preferred.
In the menu that appears, select BubbleUp Outliers.

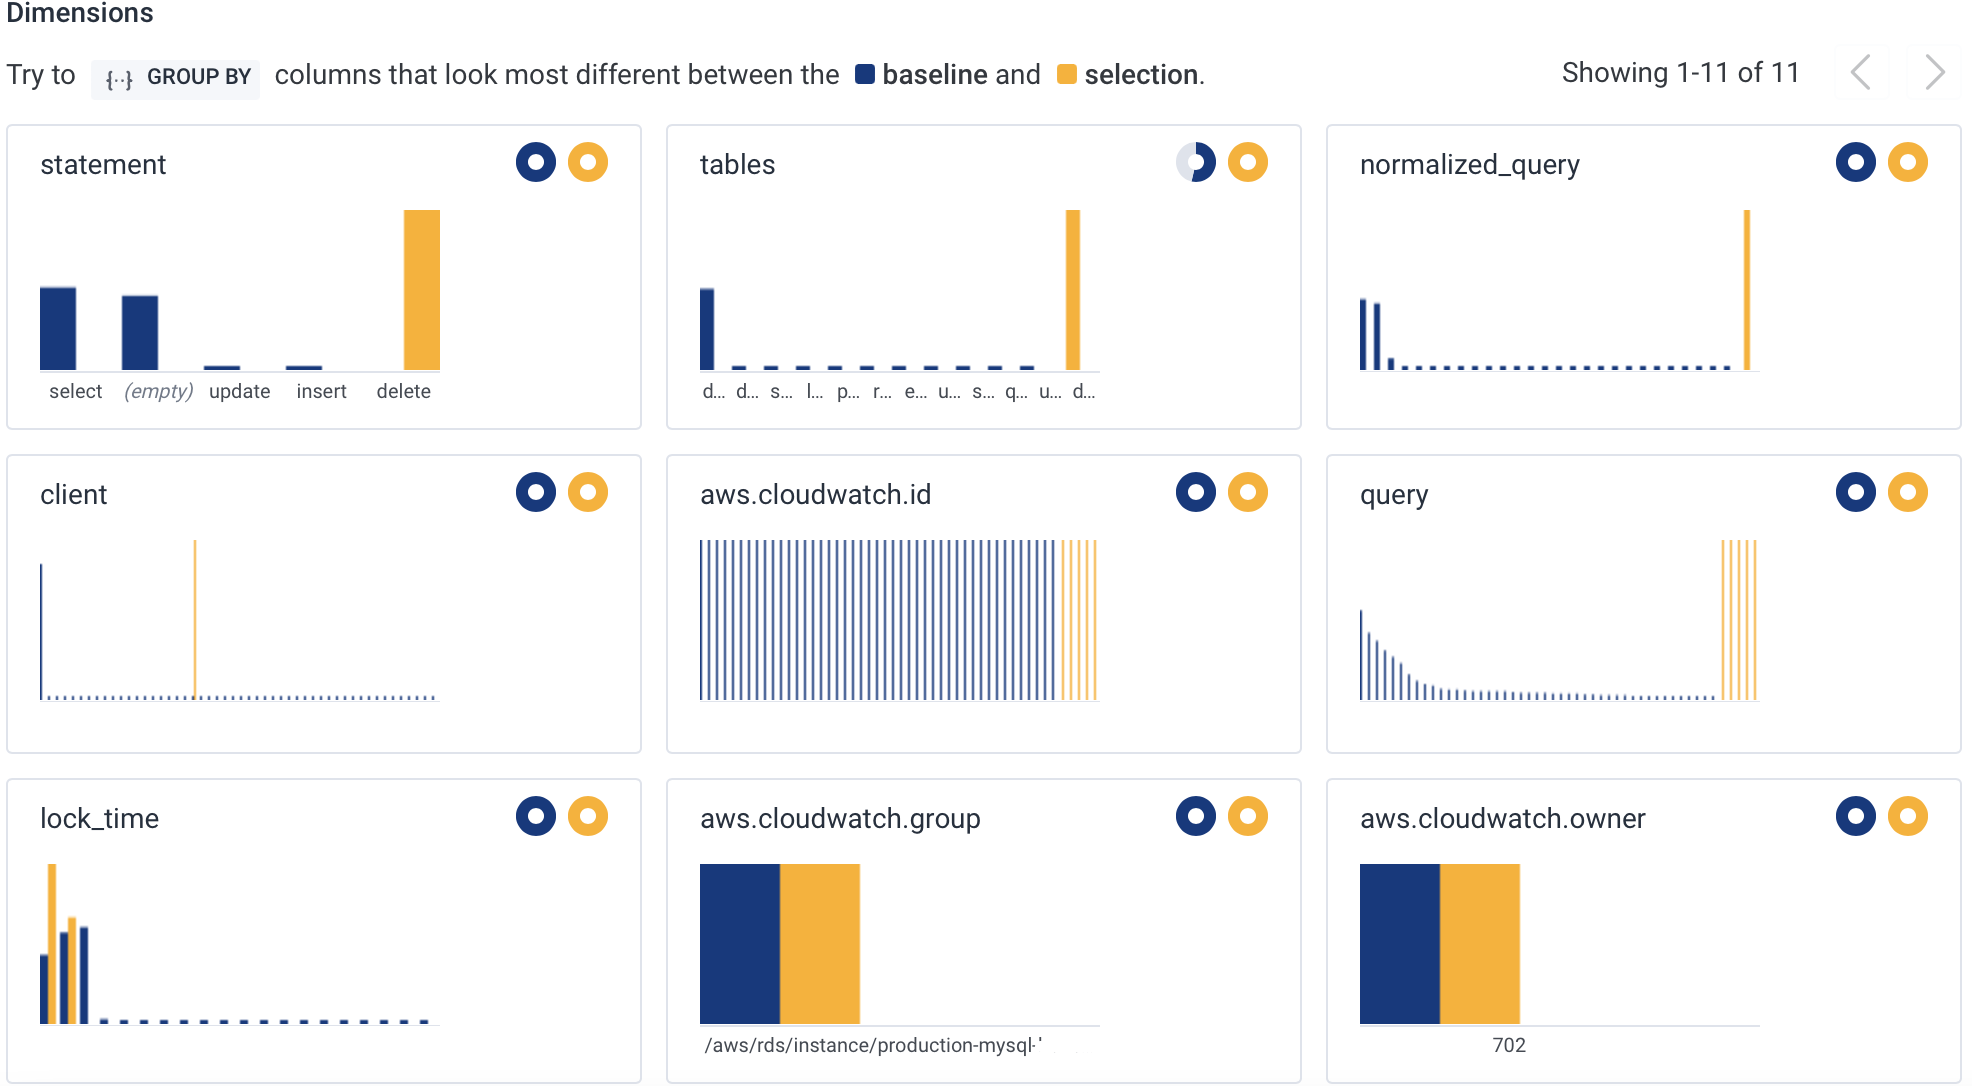
Then, view the BubbleUp charts below the heatmap. Look at which attributes that the logs inside our selected box (in yellow) have in common.

Now we see that each of those logs was the same DELETE query in the statement field.
Using the normalized_query field, we can see the exact shape of the query we need to go optimize.
Unstructured logs are received by Honeycomb as events with a verbose message attribute.
All unstructured log data is contained within this single attribute, which can make it hard to query.
Using Calculated Fields on this attribute can improve the experience and make the logs more useful.
Use calculated fields to parse meaningful information out of the unstructured message attribute.
When creating a calculated field, leverage the REG_VALUE operation when parsing.
While this experience is better with structured logs, we recommend this as a workaround for unstructured logs.
To learn more about querying metrics and correlating metrics with other datasets, refer to our Metrics Overview.