This feature is available as an add-on for the Honeycomb Enterprise plan.
Please contact your Honeycomb account team for details.

Errors over time
The first section of the Errors view displays an overview of errors over the given time range. Next to the chart is a list of errors messages, sorted by the total number of times the error occurred over the time period. Clicking on an an error message in the list filters the chart on the left, showing only errors with that message. Each bar on the chart represents the number of errors on each day during the given time period. The y-axis represents the number of errors. The x-axis represents points in time during the selected time range. You can select an error on the chart and choose View Error Details.Errors table
The next section is a table of all the errors for the given time range, sorted by error count. Each entry includes the following data:- Type: The type of error or exception. For example:
NSExceptionorTypeError. - Message: The error message.
- Users Impacted: How many users were affected by this error. Only available on web datasets.
- Devices Impacted: How many devices were affected by this error. Only available on mobile datasets.
- Error Count: How many times the error occurred over the time period.
- Last Seen: When the error last occurred in the selected time range.
Filtering
Use filters to isolate errors across specific OS versions, devices, network speeds, and more. You can filter the Errors view with predefined or custom attributes using the Filter By menu at the top. Select Customize Filters at the bottom of the Filter By menu to create your own filters based on fields in your dataset.Error details
In the Error Details view you can examine a specific error and jump to related errors with all the relevant data in one place.- First and last time the error was seen.
- How many users and sessions experienced the error.
- Full stack trace of the error and the error message.
- Span attributes.
- Other sessions with the same error message.

Summary
The Error Details view starts with a summary of the error. Here you can see a chart of the error message over time, with the y-axis representing the number of times this error occurred, and the x-axis representing points in time during the selected time range. Next to the chart, you can find the first and last times the error was seen relative to the selected time range. Beneath these are counts of how many users and/or sessions experienced the error during selected time period.Paginate from last seen to first seen
Use the controls below the error summary to cycle between the latest and oldest occurrence of the error. You can search for attributes and your search will persist, so you can quickly check a specific attribute over the range errors.
Message and stack trace
The error message and the error stack trace are below the error summary. If the stack trace has minified or obfuscated names and addresses, you can set up the symbolicator processor in your OpenTelemetry Collector pipeline. This processor replaces obfuscated symbols in your stack traces using debug information you provide.Other sessions with same error message
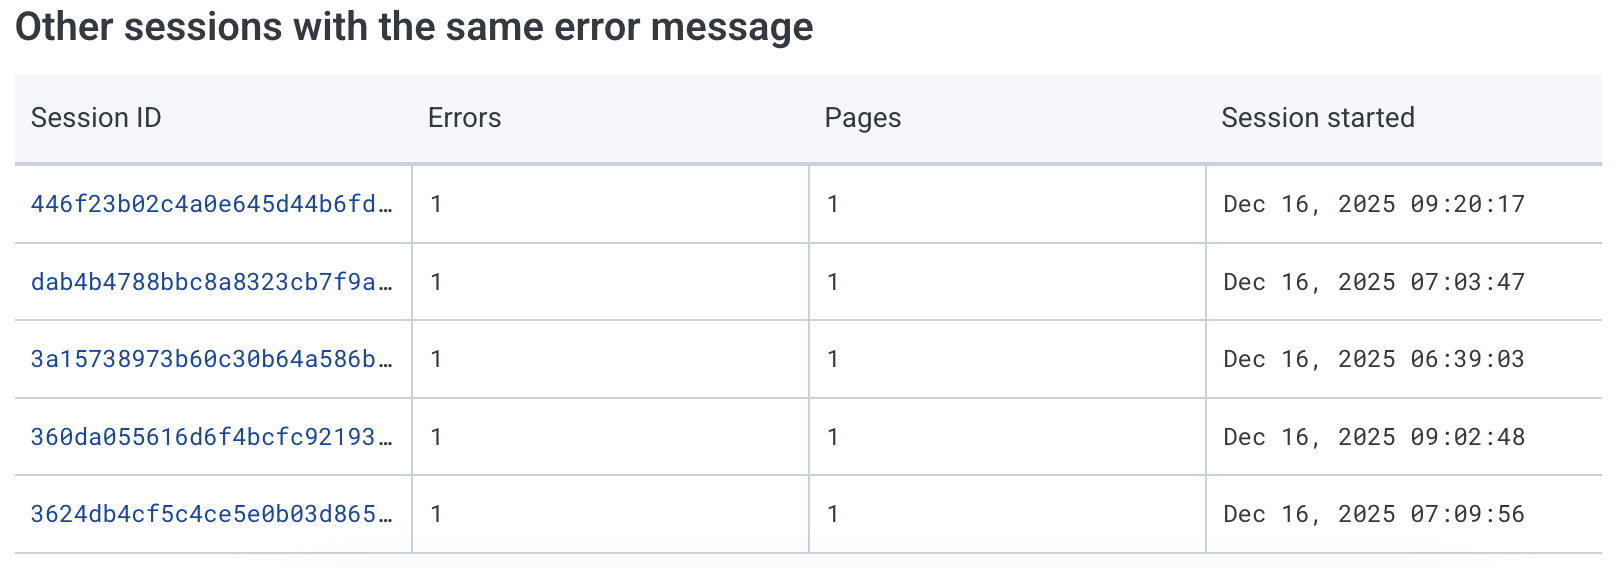
A table of sessions with the same error message is at the bottom of the error details view. You can see how many errors occurred in the session and how many pages were affected. Selecting a Session ID will open a Timeline Analysis of that session.