If you need to troubleshoot data ingest issues in Honeycomb, explore these solutions to common issues.
Troubleshoot data ingest issues related to the trace waterfall display.
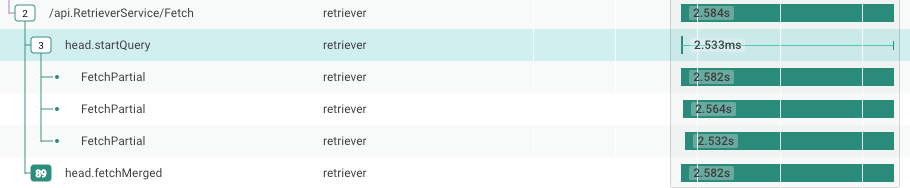
When collapsing the trace waterfall tree, it can be difficult to see the extent of the child spans of a parent.
For example, an async process might have a parent that returns in a few milliseconds – but it starts a database query that runs for several minutes.
Honeycomb draws a thin line to the right of the parent span to show the duration of the child process.
For example, in this figure, the span with name head.startQuery runs 2.533 ms – but it has children that run much longer.
(The three subprocesses called FetchPartial all run over 2.5 seconds).
Clock skew, temporal anomalies, or time travel can cause a child to start before the parent span. Honeycomb renders these with similar lines to the left of the main body. To learn more about how to resolve this issue, visit our Troubleshooting Traces documentation.
Honeycomb displays traces with a maximum of 32,000 spans. If you load a trace larger than 32,000 spans into the trace viewer, Honeycomb will display the 32,000 spans closest to the root, using a breadth-first search, and will display a warning message. Honeycomb will omit the remainder of the spans. In addition, Honeycomb will display placeholder spans showing where the omitted spans would go.
To work with very large traces, use the CONCURRENCY aggregate to visualize the structure of the trace, as seen in the Trace Summary example.
Sometimes, a trace has some spans that claim to have a trace.parent_id – but no span claims to have that trace.span_id.
Honeycomb also expects one span to have no parent; that is the root span.
If there is no root span, then this is understood as a missing root; in that case, the root span is drawn as missing.
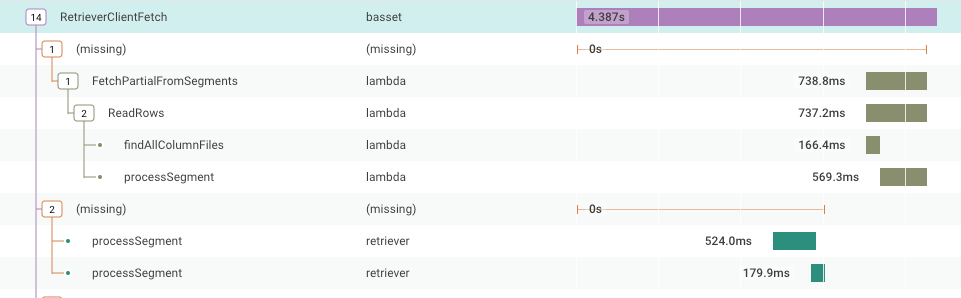
In the trace view, a message about missing spans or a missing root span may appear. Alternatively, Honeycomb renders a missing span in that slot: a placeholder that shows the span with all the children that point to that parent. Instead of a span, “(missing)” may appear in a display.
This section explains the concepts of missing root spans and missing spans, and how to troubleshoot these issues.
A trace is made of many spans, all with the same Trace ID. They connect to each other with their Span ID and Parent Span ID fields.
Every trace has one span that represents the trace as a whole, or a root span. This root span has no Parent Span, or Parent Span ID, because it is the root of the whole trace.
When Honeycomb finds a span without a trace ID and a parent span ID, then the root span is missing.
This is disruptive because it is common to query for overall response times, error rates, and other properties of the customer experience by looking only at root spans.
When the root span is missing, queries that include the filter is_root does not count the associated trace at all.
For this reason, “missing root span” is the most troubling case of missing spans.
In the trace view, Honeycomb can sometimes detect that not all of the spans describing a trace appear in the query results. Here is how Honeycomb can tell this:
A trace is made of many spans, all with the same Trace ID. They connect to each other with their Span ID and Parent Span ID fields.
For example, examine these three spans:
| Trace ID | Span ID | Parent Span ID | Name |
|---|---|---|---|
| 0123456789abcdef0123456789abcdef | aaaaaaaaaaaaaaaa | root span | |
| 0123456789abcdef0123456789abcdef | bbbbbbbbbbbbbbbb | aaaaaaaaaaaaaaaa | second span |
| 0123456789abcdef0123456789abcdef | cccccccccccccccc | bbbbbbbbbbbbbbbb | third span |
When Honeycomb assembles the trace, it connects each span under its parent span, using the values in Span ID and Parent Span ID.
Sometimes, the Parent Span does not exist. In this situation, the data Honeycomb retrieves may look similar to this example, which duplicates the earlier example without the named second span:
| Trace ID | Span ID | Parent Span ID | Name |
|---|---|---|---|
| 0123456789abcdef0123456789abcdef | aaaaaaaaaaaaaaaa | root span | |
| 0123456789abcdef0123456789abcdef | cccccccccccccccc | bbbbbbbbbbbbbbbb | third span |
In this case, Honeycomb finds the third span’s parent span ID of bbbbbbbbbbbbbbbb, but no span with span ID bbbbbbbbbbbbbbbb.
This is a missing span situation.
Therefore, Honeycomb makes a guess, and in the trace view, places two rows underneath the trace’s root span: a row labeled “(missing)” and then a row for the named third span.
To view a trace in table form similar to above, within your Query Results, either:
Spans have a long journey from your application to your screen, and they can go missing at any stage. This section starts with an overview, and then goes through several possibilities, starting with the easiest to fix.
Spans may be lost at any step, as labeled in the diagram below:
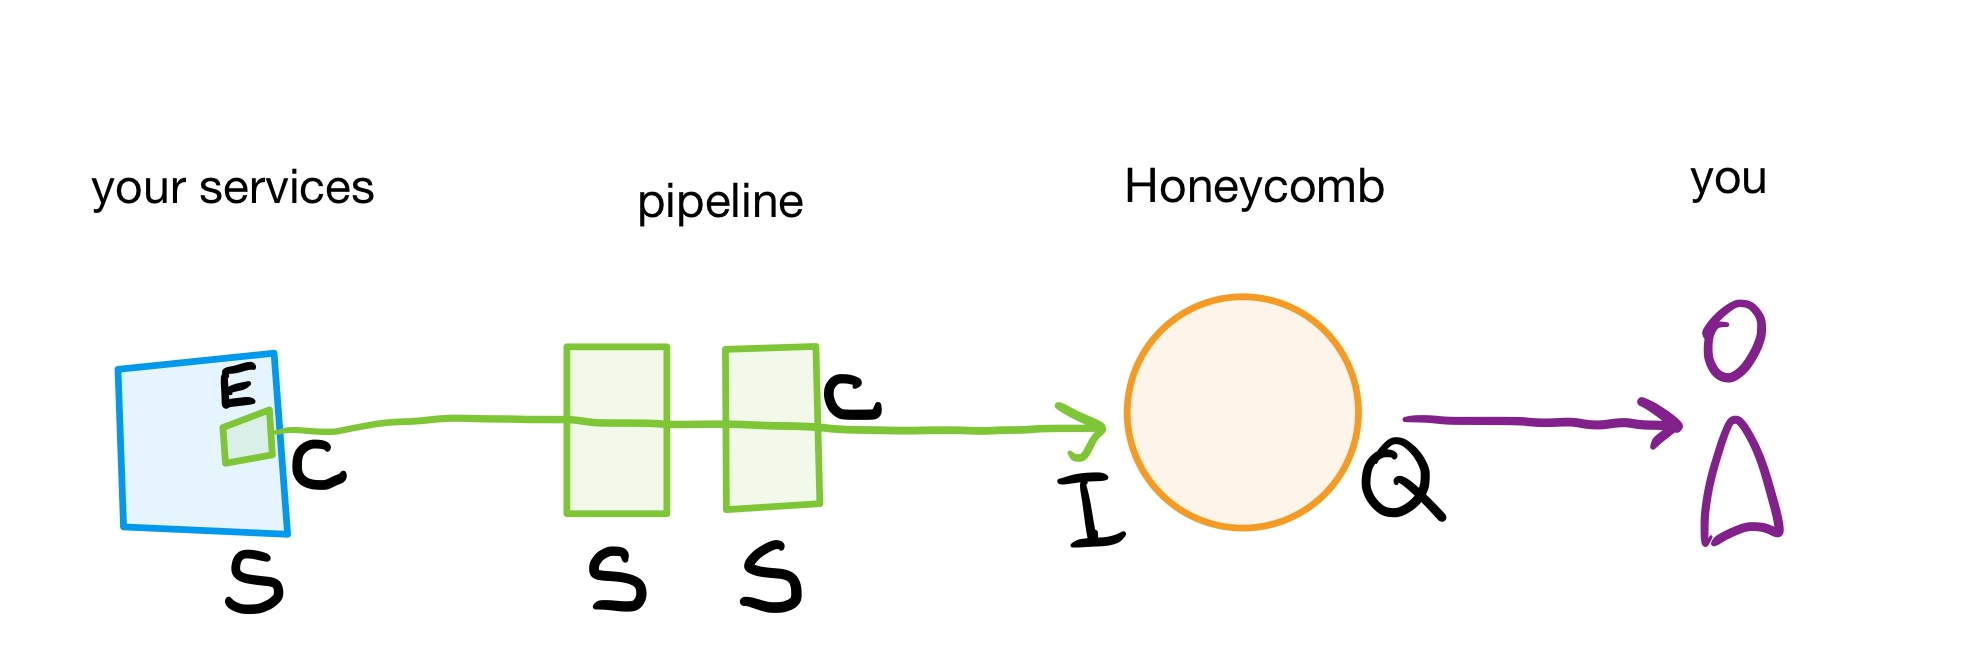
where each letter represents a step’s potential component:
Spans are emitted by every application that handles a request. Typically, spans go through a pipeline inside your network, which may include an OpenTelemetry Collector. From there, the spans cross the internet to Honeycomb’s ingestion endpoint. Once accepted, they are stored in Honeycomb’s database. Then, the Honeycomb UI retrieves the spans with a query to that database.
At every step in this process, at least one way exists for spans to be lost.
Let’s begin at the last point in the process, because it is the easiest to fix.
The trace view is backed by a query for all spans with a particular trace ID within a time range. Every Honeycomb query includes a time range, including the trace view. If any spans have a starting timestamp outside that time range, then the database would not return them, and these spans will be missing in the Honeycomb UI.
First, if a restrictive time range is the cause, determine the timespan that the query uses. How you reached the trace view determines the underlying time range for the trace view.
It is possible that the missing spans started before this determined time span begins.
Then, try constructing a direct trace link with a larger range of specified start and end times.
Alternatively, test for “spans are in Honeycomb, but not in this time range.” Sometimes a clock’s time is incorrect or timestamps are in a misunderstood format, and spans arrive with a timestamp in the distant past. In Query Builder:
trace.trace_id = your_trace_id_hereHoneycomb’s ingestion endpoint will rate limit, or reject too many events in a second, and it will throttle, or discard 9 out of 10 spans after receiving too many spans for several days.
If your account is throttled, all traces will have missing spans.
To troubleshoot, refer to the Usage Center to find out whether these conditions apply to your situation. Resolve the rate limit or throttle conditions to solve for missing spans.
Sampling reduces your total volume of data while ensuring a statistically representative set of data exists to analyze. We recommend sampling as the main method to control the amount of data sent to Honeycomb. Sampling should always be done per trace, so that Honeycomb receives either all of the spans in a trace, or none of them.
Consider the possibility of spans being dropped when sampling if sampling your trace data.
It is possible that a misconfiguration can lead to child spans in a trace getting sampled, but the root span dropped. This results in Honeycomb interpreting that the root span is missing.
It is also possible that a root span and most of its children are sampled, but spans within that trace are dropped. This kind of misconfiguration leads Honeycomb into thinking there are missing spans.
Sampling can happen anywhere in the pipeline or in the application sending spans. Troubleshooting is specific to each tool and language.
Libraries for telemetry, including OpenTelemetry instrumentation, are designed to drop data before they interfere with your application’s function. There is a limit to how many spans they will hold in memory, how frequently they will transmit batches of spans, and how large a batch of spans they will send.
If too many spans are created, some spans will be dropped. Some of these drops cause “(missing span)” gaps in traces. In this situation, their appearance will be common when the application is very busy, and rare when application traffic is slow.
Some OpenTelemetry SDKs let you configure the batch size, batch frequency, and memory limits. Also consider removing some instrumentation.
If your traces are consistently missing root spans or other spans at a consistent place in each trace, then it is likely that those spans are not reaching Honeycomb. This may be because of configuration issues.
To troubleshoot:
service.name, or filter for a specific service name with the WHERE operator.service.name is a common standard format, refer to the set field for “Service name” in Dataset Settings for the correct query format.If no events arrive with the expected service name, then check:
Missing root spans can happen when the trace began outside of your system. It is possible that external requests arrive with a trace context header, and your service picks that up and continues the trace.
In this case, no data is missing. Instead, what should be your root span is referencing a span that you never should receive. Whenever your system receives a request from outside, it should start a new trace.
Resolve this issue by configuring your gateway or ingest layer to strip trace context headers when a request arrives from a system you do not own.
If you are using AWS Lambda with API Gateway (or another service that governs traffic), missing root spans for your traces in Honeycomb are likely. This is because API Gateway often generates the initial request but may not propagate tracing headers correctly to your Lambda function.
Check out our dedicated troubleshooting section for the AWS-managed OpenTelemetry Lambda layer to find solutions for:
Depending on your configuration, field names may be slightly different. In addition, you can manually select columns as tracing fields, as explained in changing the trace schema.
| Standard Tracing Fields | Legacy Zipkin Fields |
|---|---|
| trace.span_id | id |
| trace.trace_id | traceId |
| trace.parent_id | parentId |
| duration_ms | durationMs |
| service.name | serviceName |
| name | name |
When Honeycomb is not recognizing your traces, it is typically caused by a few common pitfalls.
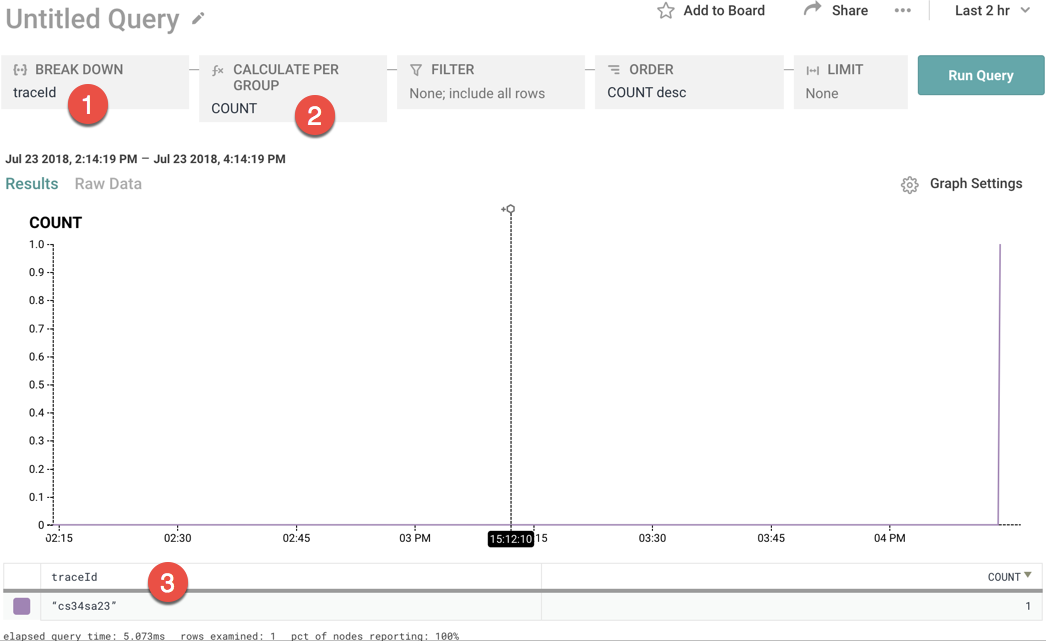
First, to verify that Honeycomb is correctly detecting your trace, check that the trace.trace_id field is hyperlinked.
To do this, select trace.trace_id in the GROUP BY window and COUNT in the VISUALIZE window.
If the traceID field looks like it does below - as a quoted string - Honeycomb is not properly recognizing your traces.
trace.parent_id Honeycomb recognizes a dataset as a tracing dataset by the existence of the column trace.parent_id.
You must send at least one event that has the column trace.parent_id in it or Honeycomb will not recognize the dataset as a tracing dataset and will not show traces.
But, remember that root spans should not have the column trace.parent_id in order to be recognized as root spans.
This likely raises a question for you: what if I am sending a traces that only have a single span?
As root spans, they are not allowed to have a trace.parent_id column if they are to be detected properly, so how will my dataset get a trace.parent_id column?
If this is your situation (and it very well may be if you are experimenting with tracing), just send in any event with a column trace.parent_id.
All you need is one event to be sent into Honeycomb with trace.parent_id as a field and the column will be created.
Then, Honeycomb will properly recognize your dataset as a tracing dataset.
Alternately, by manually changing the trace schema, you can ensure that the trace schema is recognized.
Every trace event must have a defined trace identifier (trace.trace_id), a span identifier (trace.span_id), and a duration (duration_ms).
The trace.trace_id and trace.span_id must both be strings; the duration must be a number, measuring milliseconds.
If the tracing view appears to show out of order spans, then there are gaps in the layout of the spans or the root span is missing.
There are a number of reasons why spans in a trace may appear out of order or have strange time offsets:
Make sure you are providing the start time of the span
When sending trace events into Honeycomb, you must include a timestamp field in the event that represents the start time of the span.
When a timestamp field does not exist, Honeycomb sets the timestamp for the event to the date/time when the event was received by our collectors.
Verify that trace.parent_id, trace.trace_id, and trace.span_id are set properly
The root span for any given trace must have no field for trace.parent_id in its event.
If all of the spans in a trace have a trace.parent_id, Honeycomb will not show a root span for that trace.
Honeycomb identifies which span is the root span by its absence of the column trace.parent_id.
If all of your span events have a trace.parent_id column, then Honeycomb assumes the root span is missing.
Ensure that your root spans have no trace.parent_id field, and validate that your child spans have their trace.parent_id and id set properly.
Verify that duration is set properly
You must include the duration of the span, in milliseconds and in the field durationMs.
Verify that this duration is being set properly.
If you can not find your service in Honeycomb, check the following areas:
Verify that your API key has write permissions
To create Service Datasets, your API key must have sent events and create dataset permissions.
To learn more about API keys and their permissions, visit API Key permissions.
Verify that your Team has not hit the Service Dataset maximum
Every Environment has a Service Dataset limit. If you have reached this limit, check for any inaccurate Service Datasets, or join our Pollinators Community Slack to ask questions and learn more.
Verify that your Event has defined a service
Depending on your instrumentation approach, events with undefined services receive a default value.
In OpenTelemetry and Beelines, it may start with unknown_service.
You can query this dataset in Honeycomb to see if your missing events are in here.
Verify OTLP Protobuf definitions
Honeycomb supports receiving telemetry data via OpenTelemetry’s native protocol, OTLP, over gRPC, HTTP/protobuf, and HTTP/JSON. The minimum supported versions of OTLP protobuf definitions are 1.0 for traces, metrics, and logs.
If the protobuf version in use by the SDK does not match a supported version by Honeycomb, a different version of the SDK may need to be used. If the SDK’s protobuf version is older than the minimum supported version, and telemetry is not appearing as expected in Honeycomb, upgrade the SDK to a version with the supported protobuf definitions. If using an added dependency on a proto library, ensure the version of protobuf definitions matches the supported version of the SDK.
Verify Endpoint URLs for OTLP/HTTP
When using the OTEL_EXPORTER_OTLP_ENDPOINT environment variable with an SDK and an HTTP exporter, the final path of the endpoint is modified by the SDK to represent the specific signal being sent.
For example, when exporting trace data, the endpoint is updated to append v1/traces.
When exporting metrics data, the endpoint is updated to append v1/metrics.
So, if you were to set the OTEL_EXPORTER_OTLP_ENDPOINT to https://api.honeycomb.io, traces would be sent to https://api.honeycomb.io/v1/traces and metrics would be sent to https://api.honeycomb.io/v1/metrics.
The same modification is not necessary for gRPC.
export OTEL_EXPORTER_OTLP_ENDPOINT=https://api.honeycomb.io # US instance
#export OTEL_EXPORTER_OTLP_ENDPOINT=https://api.eu1.honeycomb.io # EU instance
If the desired outcome is to send data to a different endpoint depending on the signal, use OTEL_EXPORTER_OTLP_<SIGNAL>_ENDPOINT instead of the more generic OTEL_EXPORTER_OTLP_ENDPOINT.
When using a signal-specific environment variable, these paths must be appended manually.
Set OTEL_EXPORTER_OTLP_TRACES_ENDPOINT for traces, appending the endpoint with v1/traces, and OTEL_EXPORTER_OTLP_METRICS_ENDPOINT for metrics, appending the endpoint with v1/metrics.
Send both traces and metrics to Honeycomb using this method by setting the following variables:
export OTEL_EXPORTER_OTLP_TRACES_ENDPOINT=https://api.honeycomb.io/v1/traces # US instance
#export OTEL_EXPORTER_OTLP_TRACES_ENDPOINT=https://api.eu1.honeycomb.io/v1/traces # EU instance

export OTEL_EXPORTER_OTLP_METRICS_ENDPOINT=https://api.honeycomb.io/v1/metrics # US instance
#export OTEL_EXPORTER_OTLP_METRICS_ENDPOINT=https://api.eu1.honeycomb.io/v1/metrics # EU instance
More details about endpoints and signals can be found in the OpenTelemetry Specification.
Enable debug mode
Most SDKs include an option to enable a debugging mode.
For some SDKs, including the Honeycomb OpenTelemetry SDK Distributions, it may be enabled by setting the DEBUG environment variable to true:
export DEBUG=true
Refer to the Troubleshooting sections for each language to find the proper configuration as needed.
Export to console
Most SDKs include an option to export telemetry to the console to verify the data is instrumented as expected. For each signal supported by the SDK, a signal-specific exporter likely also exists:
ConsoleSpanExporter.ConsoleMetricExporter.ConsoleLogExporter.Refer to OpenTelemetry documentation or the Troubleshooting sections in Honeycomb documentation for each language to find the proper configuration as needed.
Choose between gRPC and HTTP
Most OpenTelemetry SDKs have an option to export telemetry as OTLP either over gRPC or HTTP/protobuf, with some also offering HTTP/JSON. If you are trying to choose between gRPC and HTTP, keep in mind:
gRPC default export uses port 4317, whereas HTTP default export uses port 4318.