The trace detail view displays information in four areas:
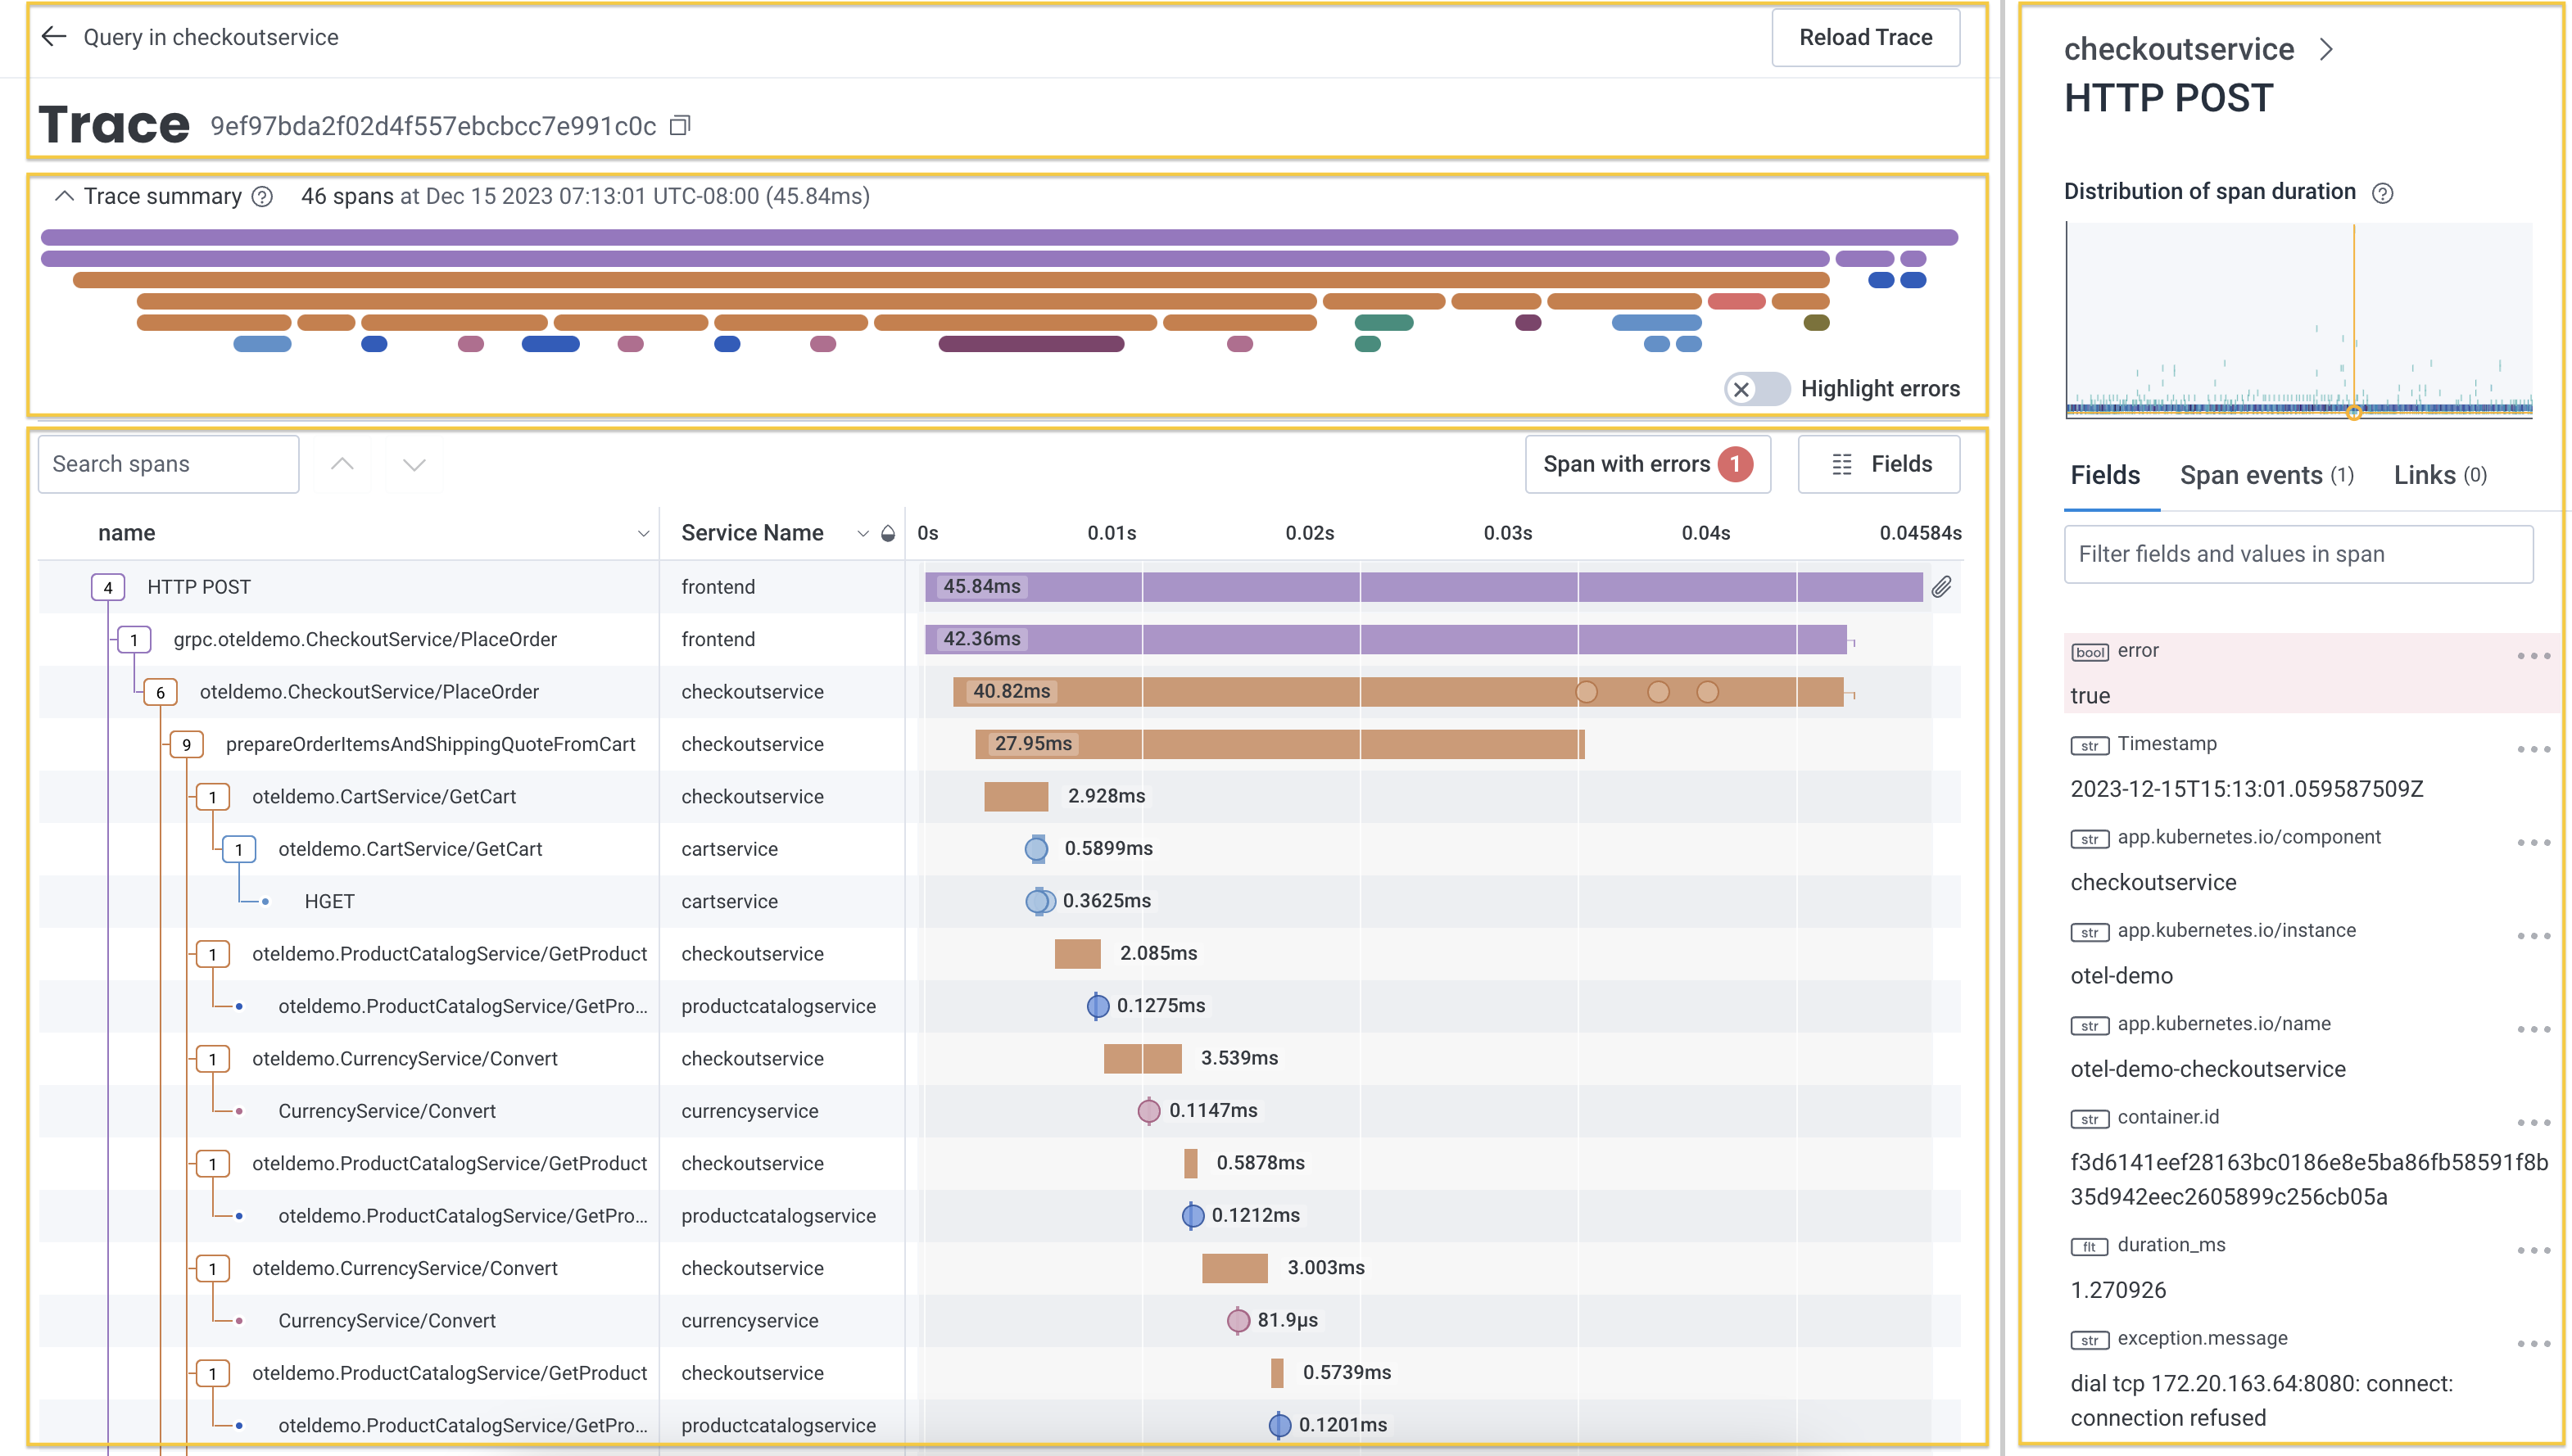
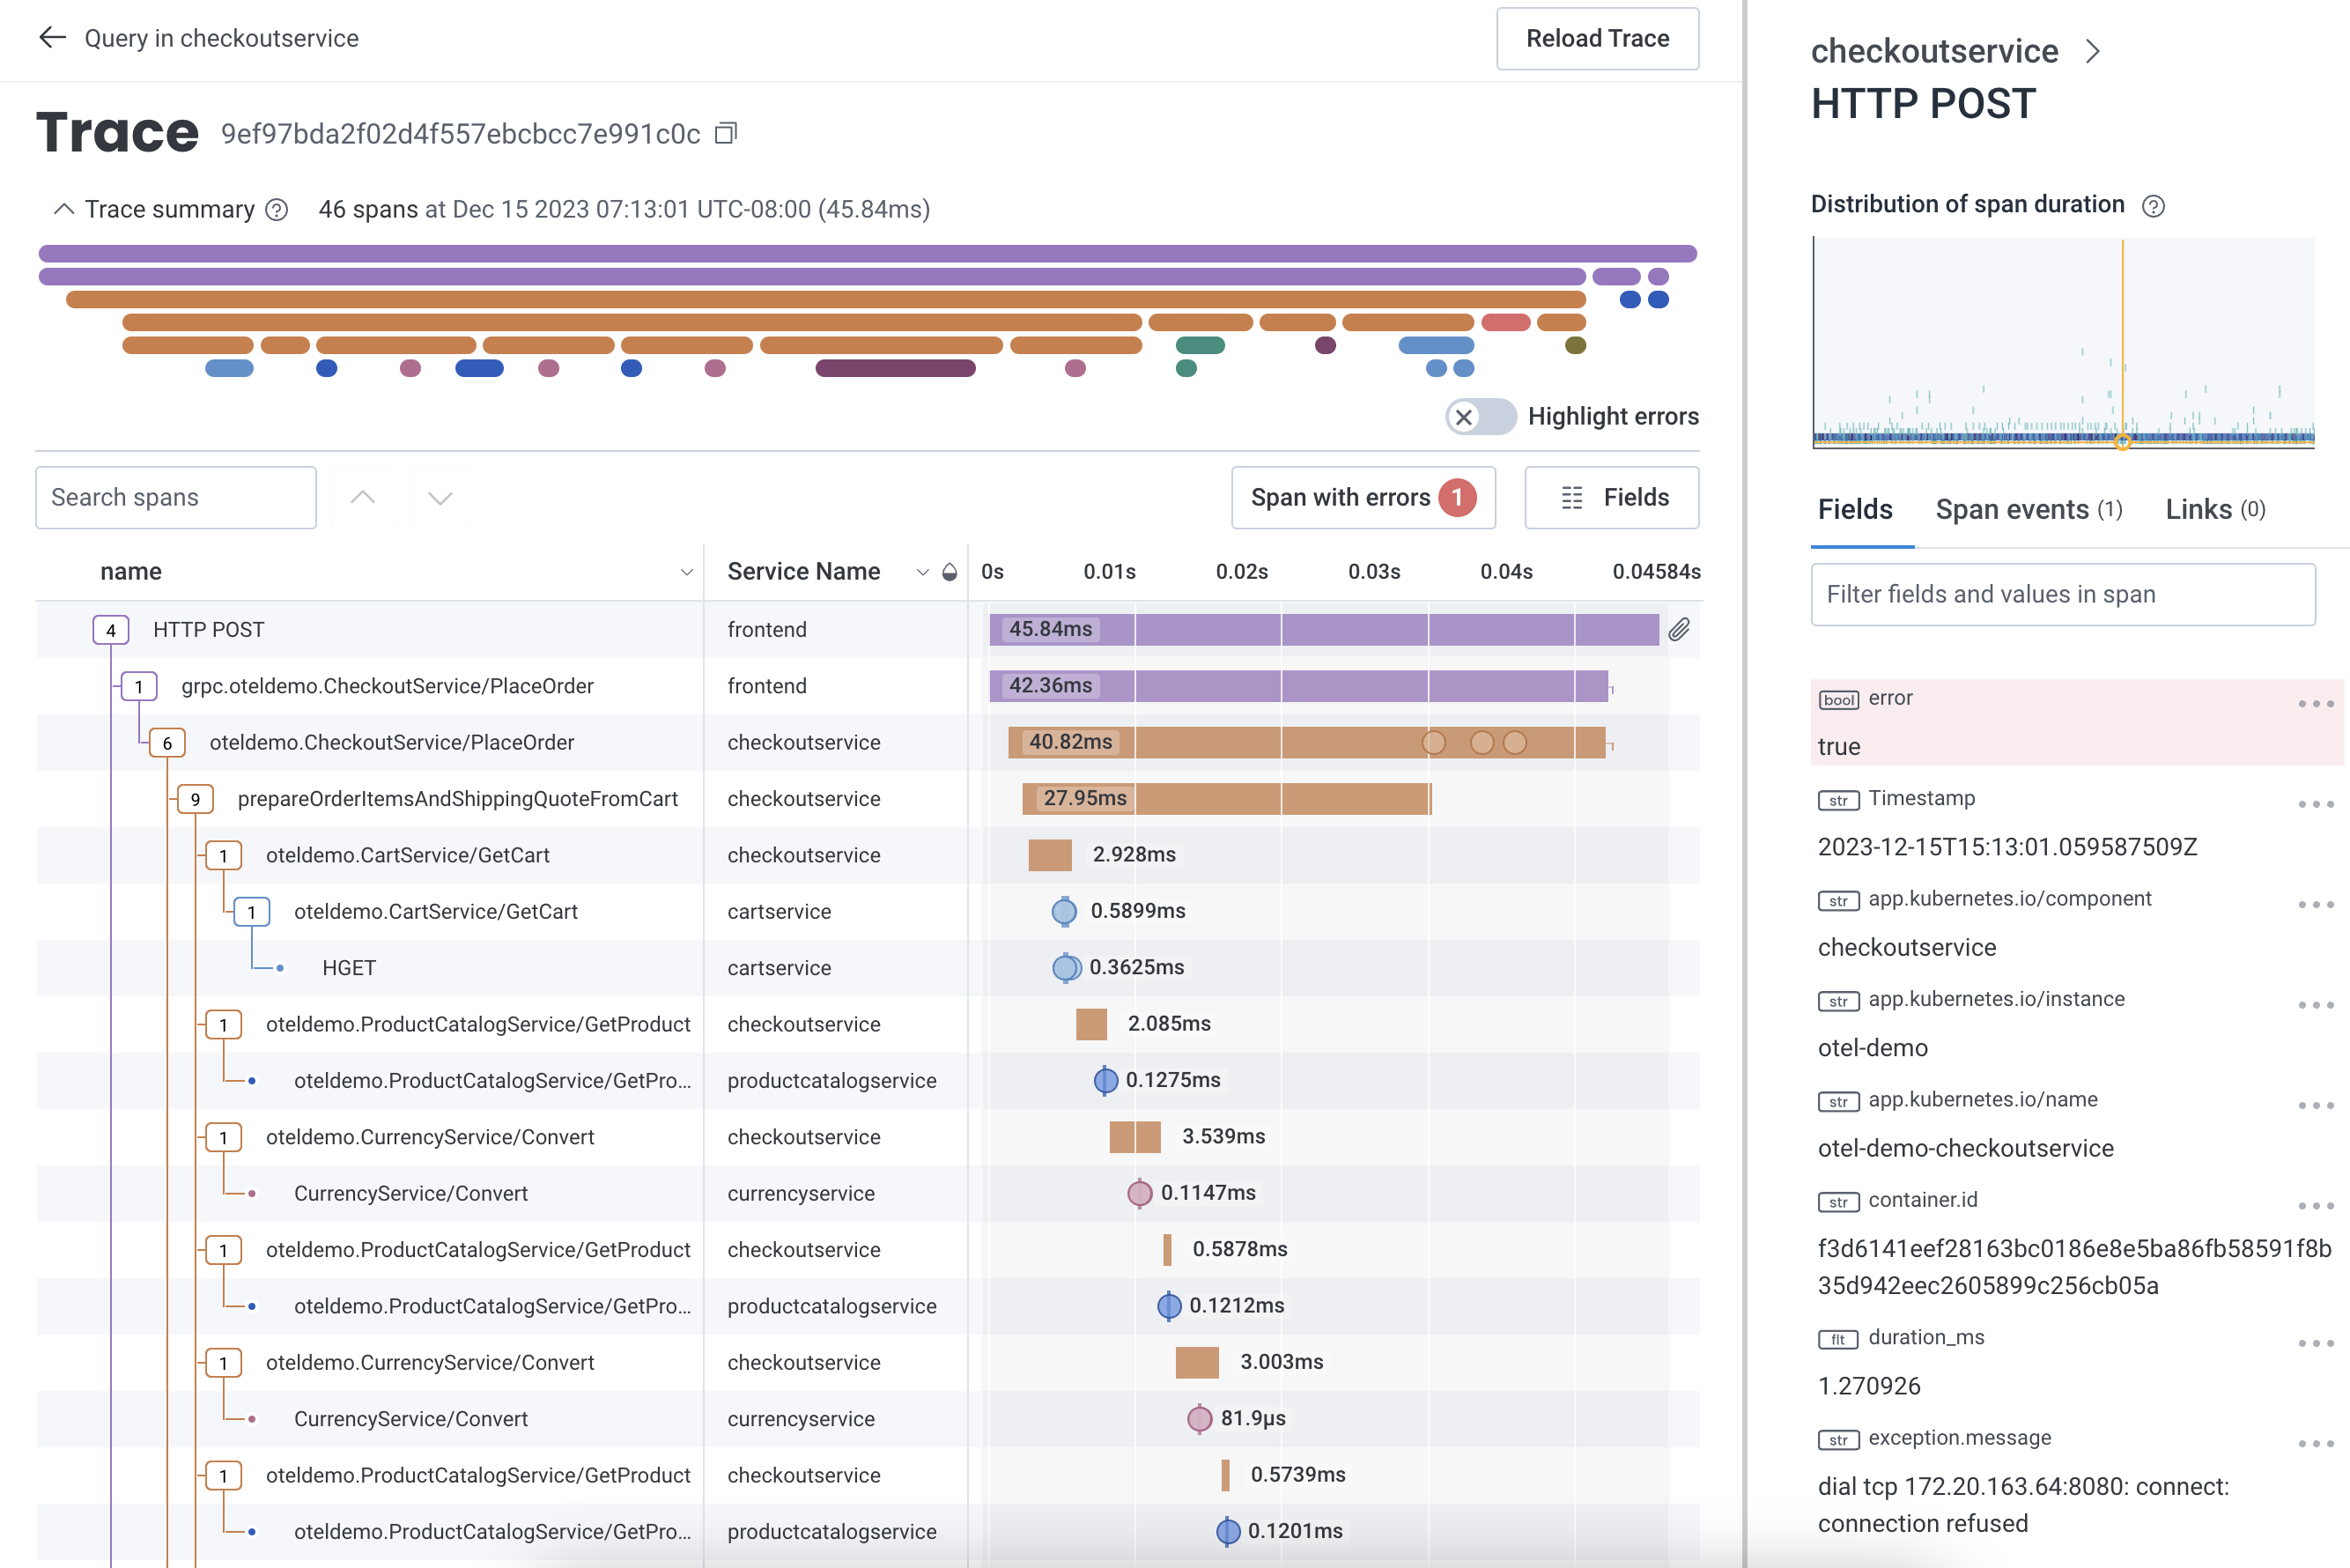
Each trace has a unique identifier presented at the top of page along side navigation elements.
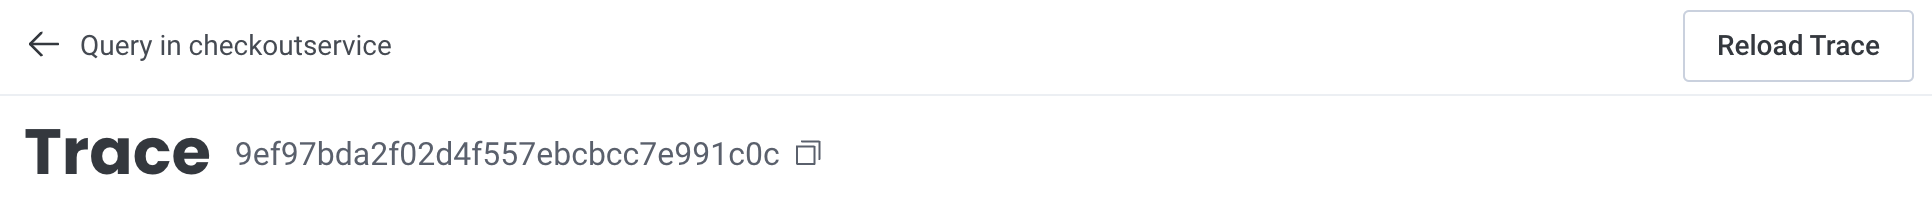
The left-arrow navigates away from the trace view back to the visualization or results table where the trace was selected.
Honeycomb presents a trace when it has received the root span. Each span has a unique identifier and datetime stamp of when it was created. The Reload Trace button reloads the trace to ensure the waterfall representation contains all spans in the trace.
Traces may display a warning that it is missing spans with a link to resources to assist with troubleshooting the missing spans.

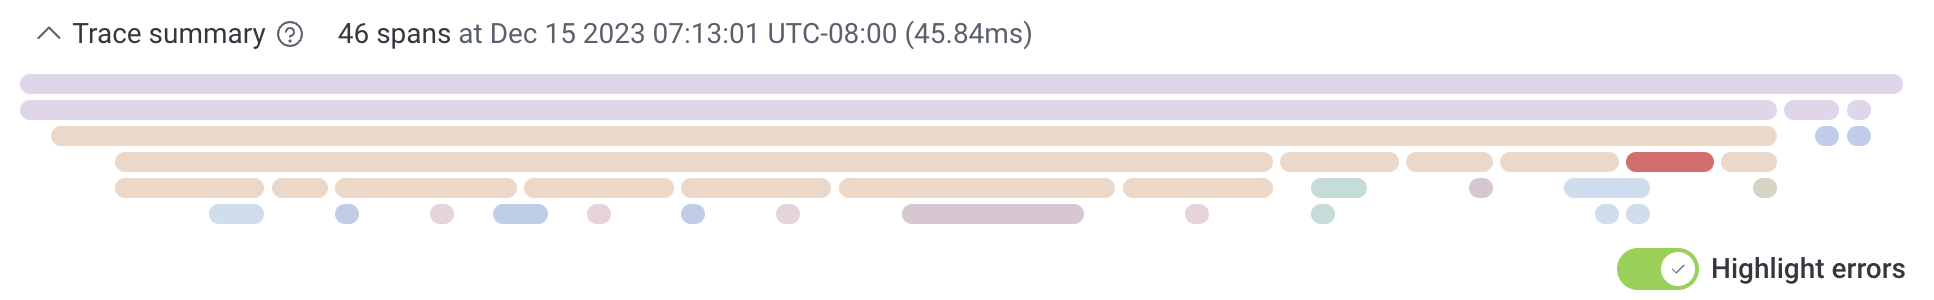
The trace summary displays important metadata and provides a condensed view of the trace waterfall diagram. Metadata about the trace includes its total number of spans, the timestamp of the root span, and the total trace duration. Use this view to find long-running spans and spans with errors within your trace without scrolling through the entire trace waterfall. Expand or collapse the summary view by selecting the directional caret.
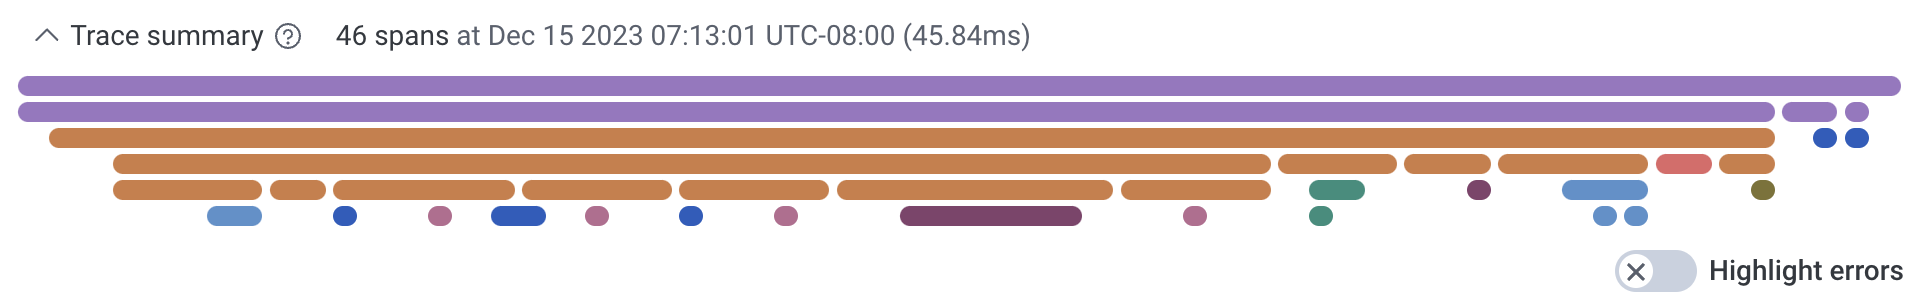
The trace summary displays up to 6 levels of span dependency. The first level in the topmost row starts with the root span. The second row shows the root span’s dependent spans, and each following row displays a dependent span level, if applicable. The width of the summary represents the whole duration of the trace.
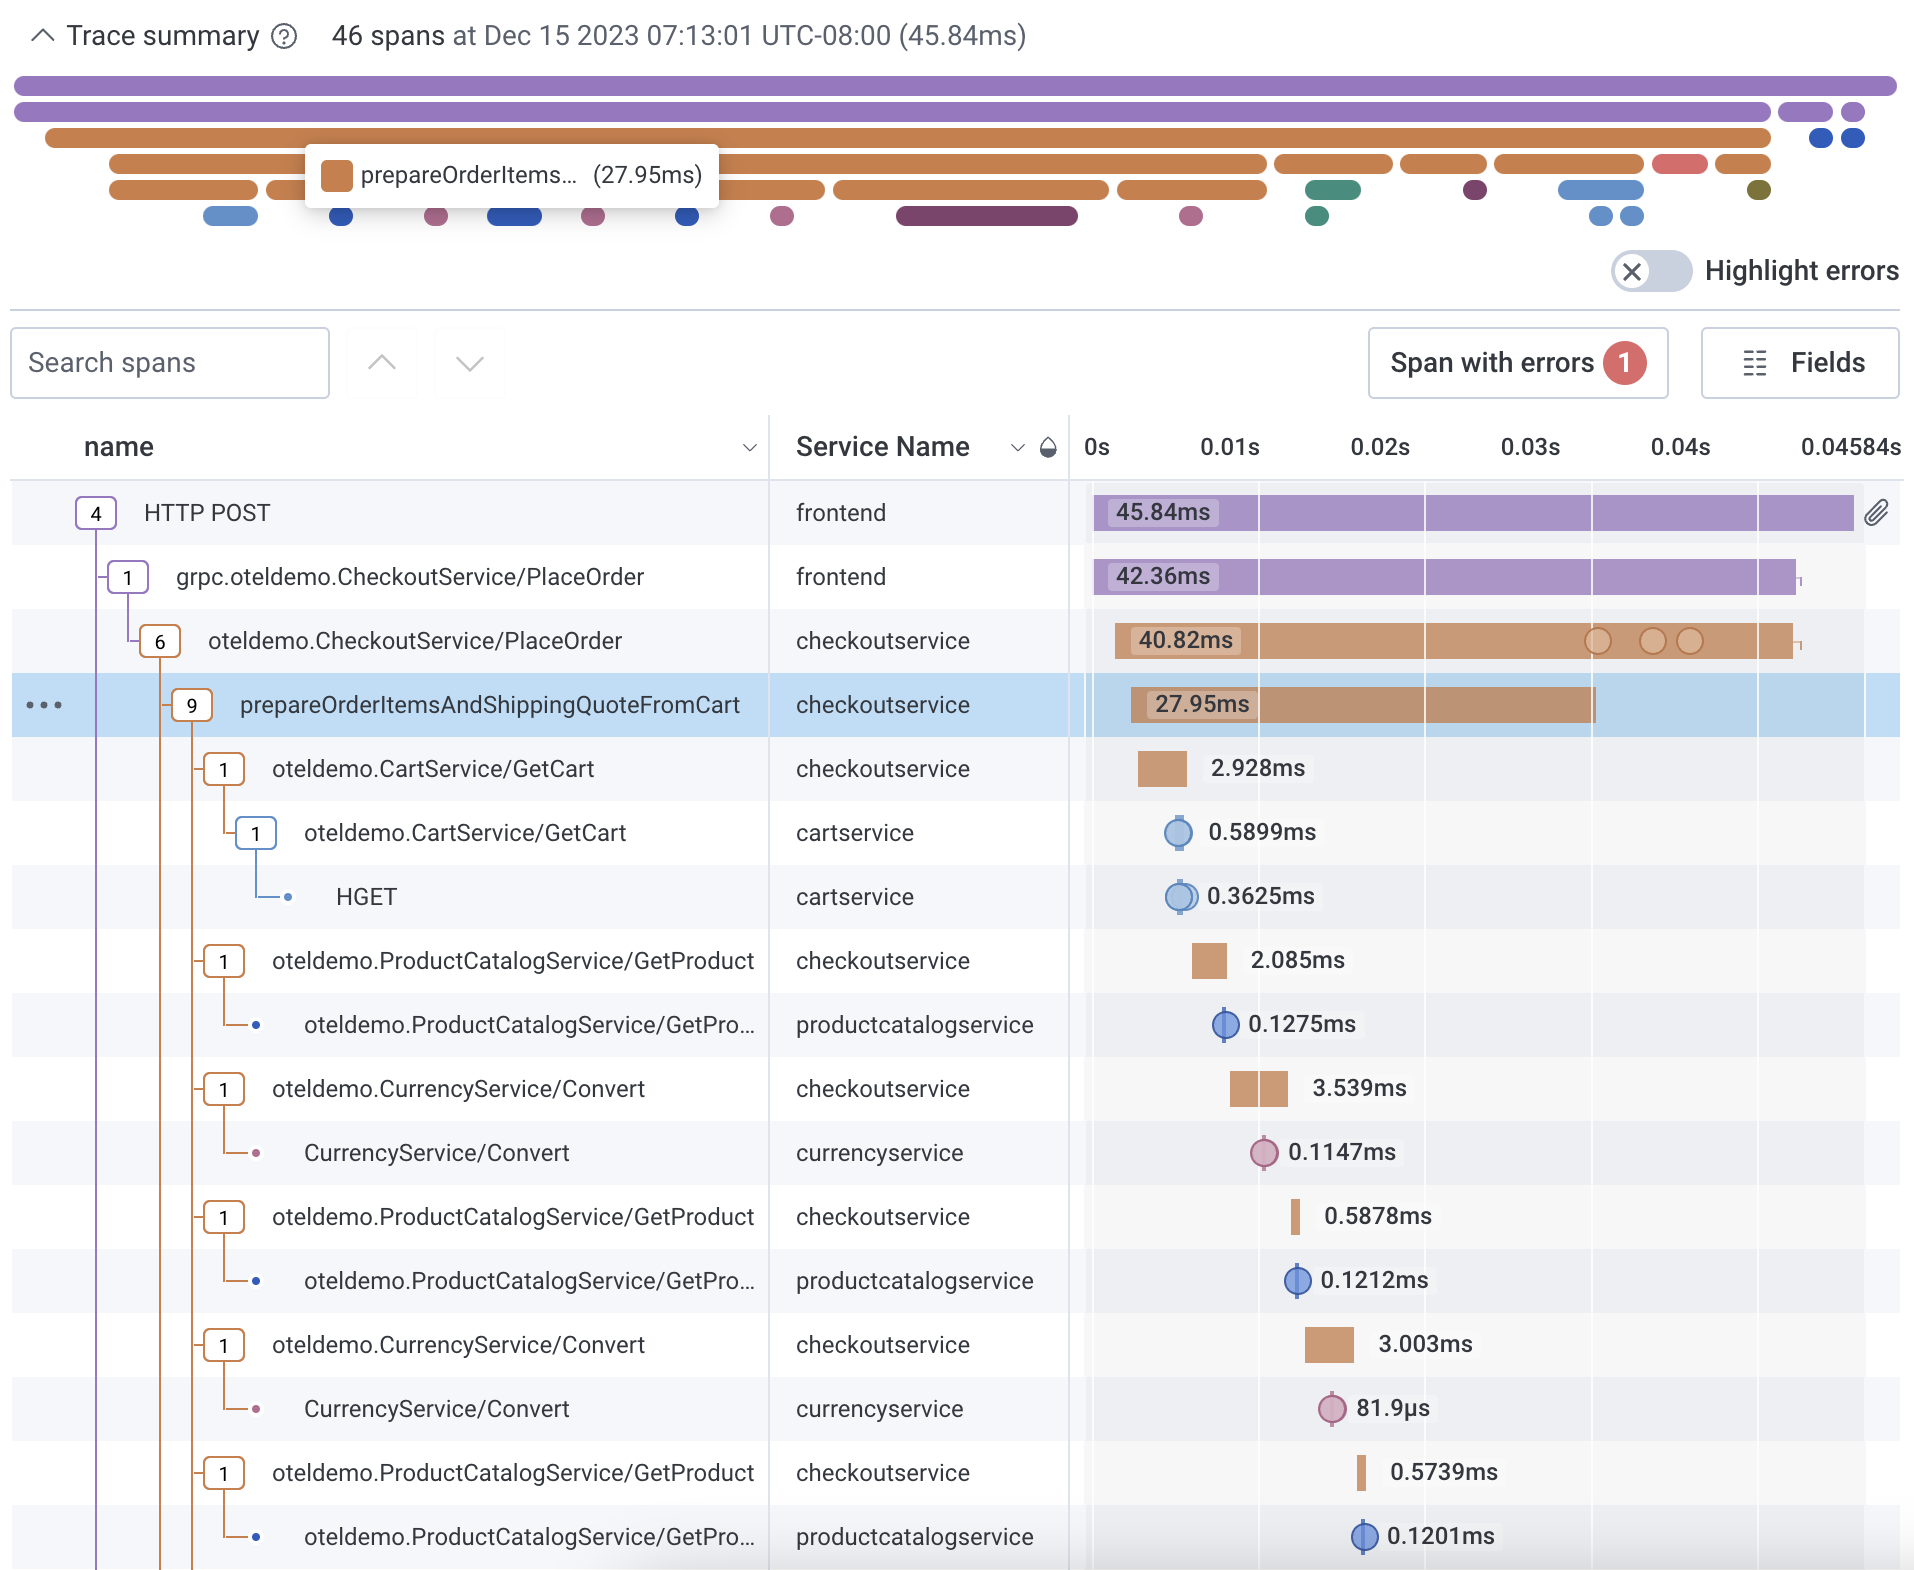
Hover over any span to see the name of the longest running span at that depth and point in time. Select the span to view its highlighted location in the waterfall representation below.
Use Highlight errors to toggle span error highlighting on and off. Spans with errors appear in red. Select a span with an error to view its location in the waterfall representation below and additional metadata in the trace sidebar.
Honeycomb uses the metadata from each span to reconstruct the relationships between them and generate a trace diagram. This is also called a waterfall diagram because it shows how the order of operations cascades across the total execution time.
Each span contains a collection of fields and values.
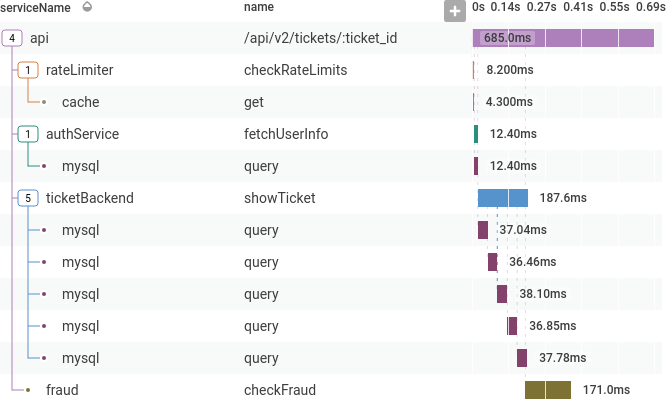
The diagram displays, at a minimum, the span’s relationship, its name, and a representation of its duration.
Next to each span’s name shows its relationship in the trace. A span with dependencies displays a box with the number of dependent spans. A span without a box represents a span with no dependencies.
The currently selected span’s row is highlighted in blue. Details about the selected span appear to the right in the trace sidebar.
When a span is selected, the trace sidebar updates with details about the span, including its fields, span events, and links.
The Span Events tab of the trace sidebar displays details about span events, if applicable. To access, navigate to the Span Events tab and select the Span Event name to show its details. Alternatively, in the waterfall diagram, select the circle that represents a span event to display the span event’s details in the trace sidebar’s Span Events tab.
The Links tab of the trace sidebar displays details about span links, if applicable. To access, navigate to the Links tab to view span link details. Alternatively, in the waterfall diagram, select the link icon that represents a span link to display details in the trace sidebar’s Links tab.
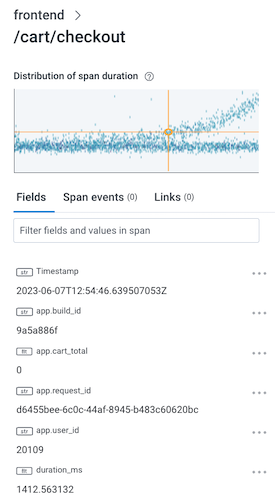
The minigraph, at the top of the trace sidebar, shows a heatmap view of the selected span relative to others with the same fields displayed in the waterfall. Selecting anywhere in the minigraph sends you to the Query Builder display with a query that corresponds to the minigraph.