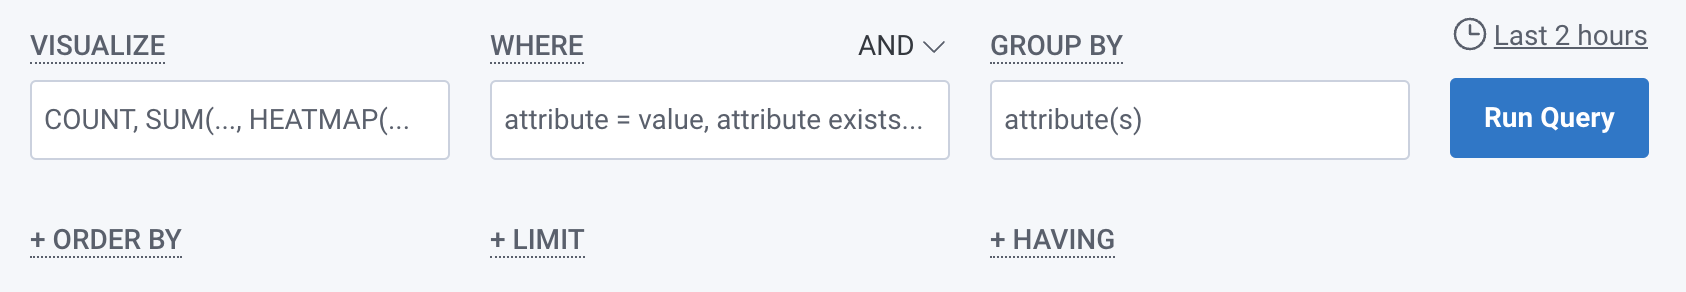
A query in Honeycomb consists of up to six clauses:
VISUALIZE - Performs a calculation and displays a corresponding graph over time. Most VISUALIZE queries return a line graph while the HEATMAP visualization shows the distribution of data over time
WHERE - Filters based on field or attribute parameter(s)
GROUP BY - Groups fields by field or attribute parameter(s)
ORDER BY - Sort the results
LIMIT - Specify a limit on how many results to return
HAVING - Filter results based on aggregate criteria
You can create a calculated field, or derived column, from the Query Builder!
Start by selecting the GROUP BY field, and then select Create calculated field from its menu.
If you need more help creating a calculated field, visit Manage Calculated Fields.
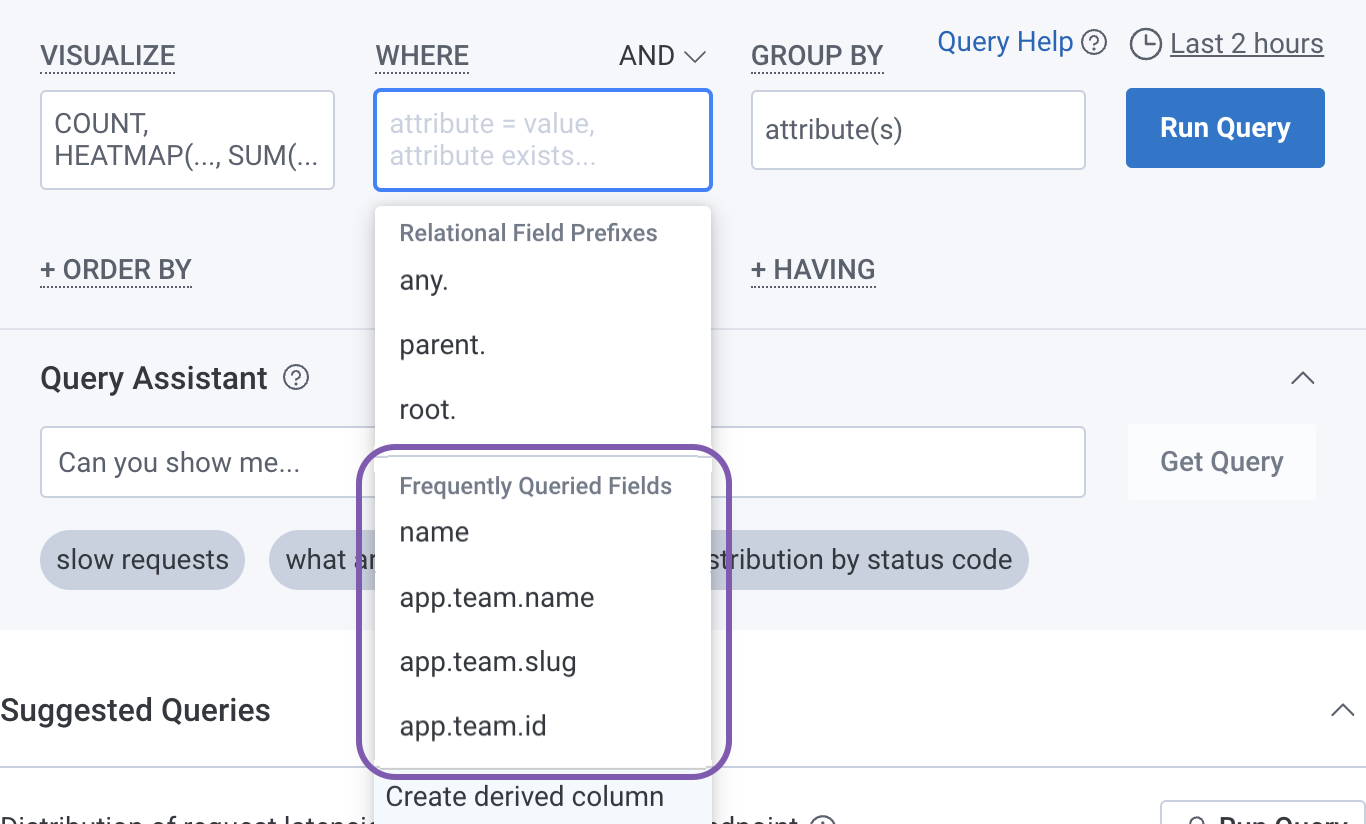
Frequently Queried Values
Dropdowns for the VISUALIZE, WHERE, and GROUP BY clauses contain a section that shows the top five values that your team queries most frequently, so your team members can more easily construct repeated queries.
Listed values include data that has been most frequently queried and:
used within the last three weeks
used in manual queries
specific to the currently selected dataset and environment
Query Assistant
Query Assistant consists of:
a search box
Get Query
suggested questions
Based on your entry or suggested question selection, Query Assistant creates and runs a query in the Query Builder.
Query results appear after the screen refreshes.
You can expand and collapse the Query Assistant display.
Any changes you make will persist.
You can also control your team’s ability to use Query Assistant in Team Settings.
To learn how to enable or disable Query Assistant, visit Teams: Manage Behavior.