

Access Events
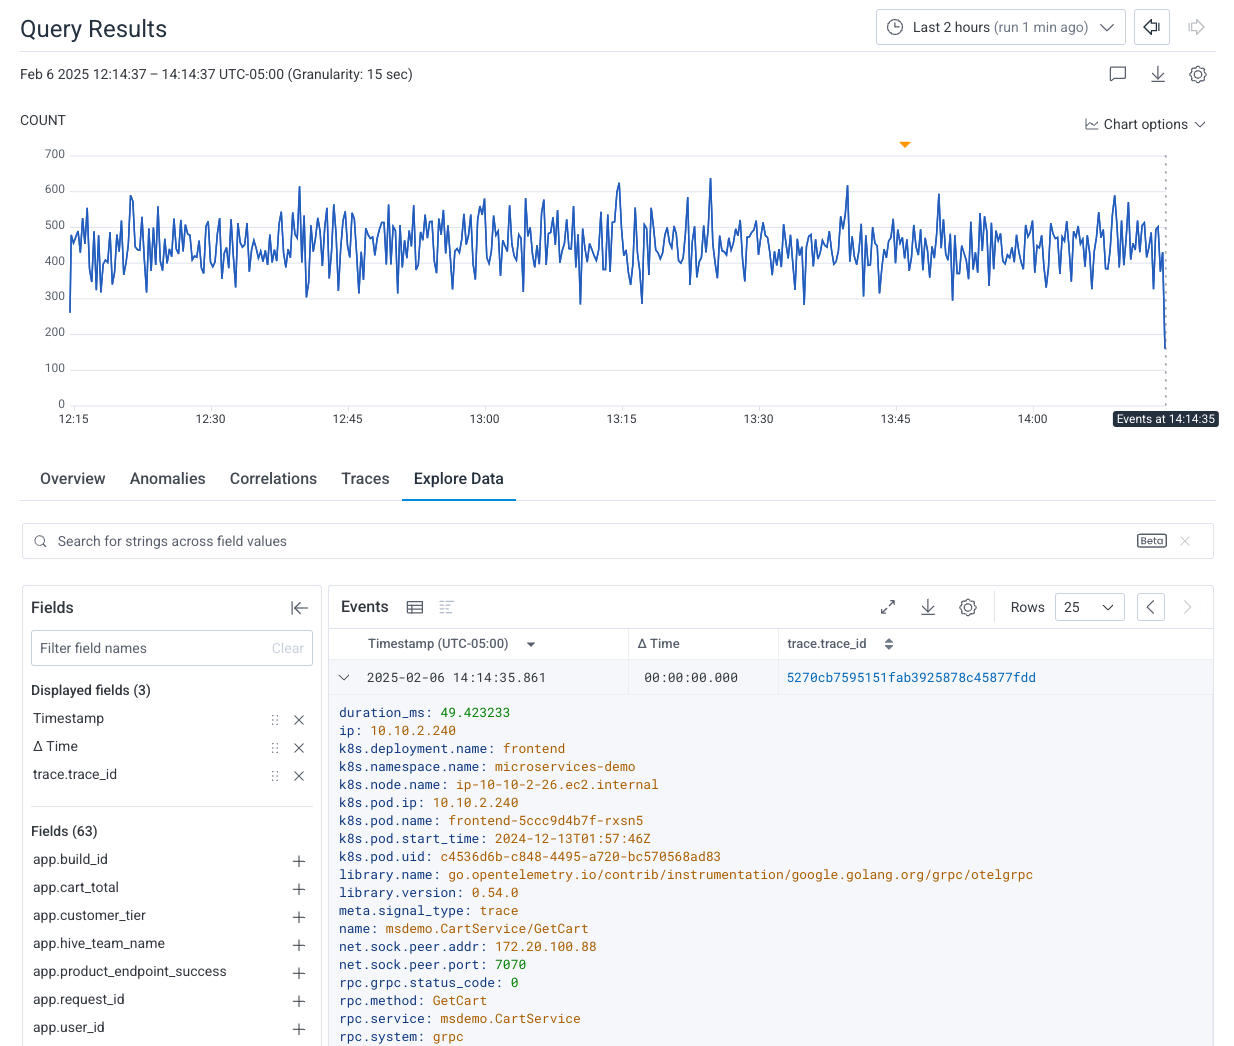
To access the underlying events of a query, click on any single point in time in the query result graph, and then choose View events from the context menu.View Events
Honeycomb’s Explore Data tab shows you:- An Events view, which contains all of the raw data from your current query, ignoring both the query’s aggregates and any GROUP BY, HAVING, or ORDER BY fields. Your data starts with the most recent events that occurred from the timestamp of the point you selected. At any time, you can choose to display your data either as a table view or as a log lines display, which is optimized for scanning across logs.
- A Fields list, which shows you all of the fields that contain data for your query. If you don’t see a field in your dataset in this list, that means that the spans in your query do not contain data for that field.
Events View
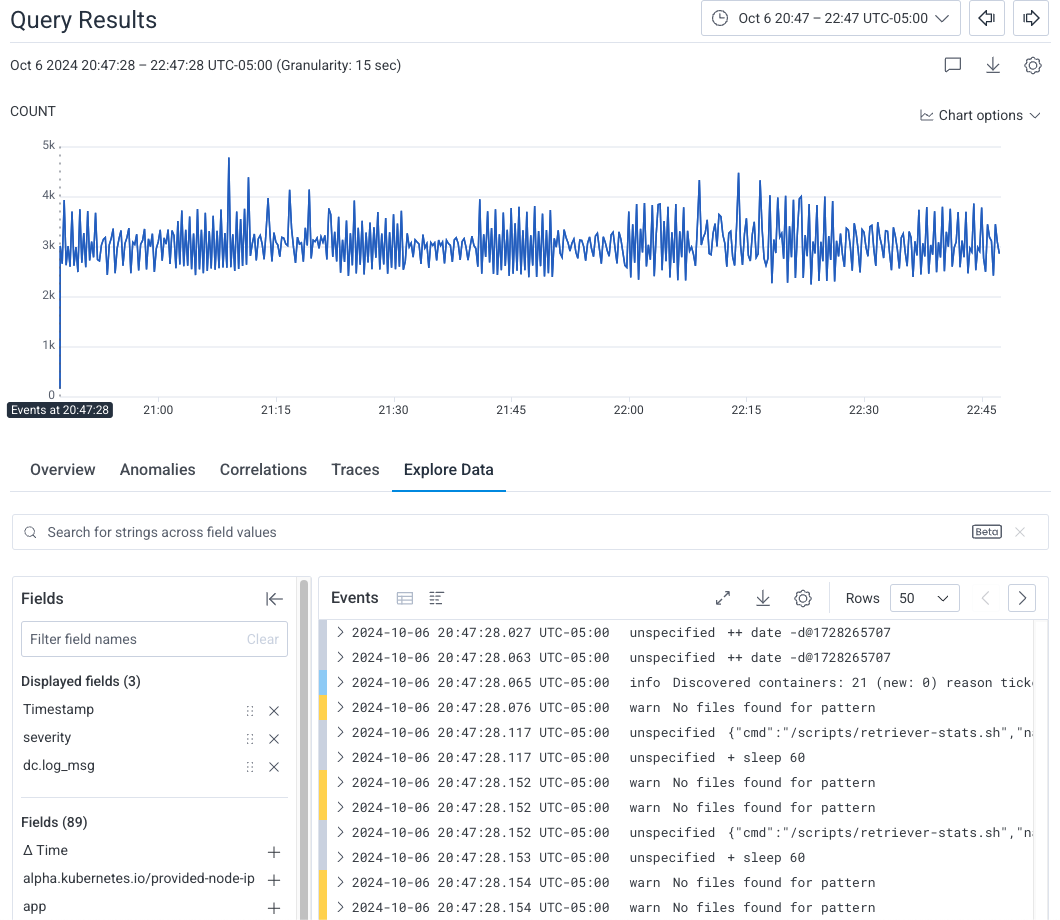
The Events view contains all of the raw data from your current query, ignoring both the query’s aggregates and any GROUP BY, HAVING, or ORDER BY fields. You view your data as either an events table or as a log lines display:- In the Events view, locate the Table () and Log Lines () icons in the upper left.
- Select each icon to display data as an events table or as a log lines display.
- Table Display
- Log Lines Display
- Each column represents a selected field from your dataset. You can customize your events display to add or remove columns.
- Each row represents an event, along with the values associated with the selected fields from your dataset.
-
Expanding an event row displays all of the event’s field names and their corresponding values, with optional syntax highlighting:
- Blue: Field name
- Orange: String value
- Green: Number value
- Dark pink: Boolean value
Event Details
You can examine individual events and navigate between them in the Event Details view. This view provides improved formatting for structured data like stack traces, JSON, or XML, and includes all available fields for the current event. To view the details of an event, select the drawer icon () next to the event or choose Expand in drawer when the event is expanded in the table view. Keyboard shortcuts for paging through events in Event Details.Manage Fields in Event Details
In the Fields tab you can see all available fields for the current event, including those not currently displayed in the main Events view. You can add or remove fields from the main the table view’s Displayed Fields list by selecting the empty space or x icon next to the field or choosing Add column to table from the field’s context menu.Fields Panel
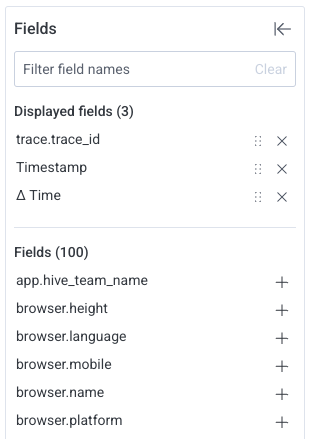
To the left of the Events view, you will see the Fields panel, which shows you all of the fields that contain data for your query. The Fields panel contains the following lists:- Displayed fields: Selected fields that display in the Events view.
-
Fields: Remaining fields that contain data for your query. You can add any of these fields to your Events view.
- Fields contains an additional Δ Time field. Add this field to your Events view to include the time difference between the current event and the previous event.
Change Data Display
At any time, you can choose to view your data as either an events table or as a log lines display, which is optimized for scanning across logs.- In the Events view, locate the Table () and Log Lines () icons in the upper left.
- Select each icon to display data as an events table or as a log lines display.
Customize Events Display
To make the events display work for you, you can control which fields are visible in the Events view and customize the display of the fields.Add Fields to the Events View
To add a field to the Events view:- From the Fields panel
- From the Events table display
- From the Events log lines display
- In the Fields list, locate the field that you want to add to the Events view.
- Select the add icon () to the right of the desired field.
Display Time Difference Between Events in the Events View
Honeycomb provide a field called Δ Time that displays the time difference between events. To add the Δ Time field to the Events view:- In the Fields list, locate the Δ Time field.
- Select the add icon () to its right.
Remove Fields from the Events View
- From the Fields panel
- From the Events table display
- From the Events log lines display
- In the Displayed Fields list, locate the field you want to remove from the events view.
- Select the remove icon () to the right of the desired field.
Reorder Fields in the Events View
- From the Fields panel
- From the Events table display
- From the Events log lines display
- In the Displayed Fields list, locate the field that you want to reorder in the Events view.
- Select the drag icon () next to the field, and drag to rearrange the fields.
Customize Display Formatting
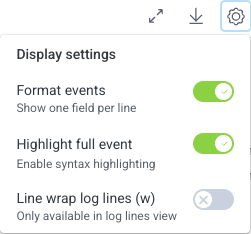
To customize the display formatting:- In the Events view, locate and select the Display Settings () icon.
-
Select the toggle that targets the behavior you want to customize:
- Format events: For expanded events in the table display, displays all fields in a single, pipe-delimited line [off] or one field per line [on].
- Automatically highlight: Displays field names and values in expanded events in black [off] or enables syntax highlighting [on].
- Line wrap log lines: In the log lines display, allows text to extend beyond the visible area [off] or wraps text to the next line [on].
Resize Columns in the Table Display
To resize columns in the Events table:- Locate the column to resize.
- In the target column’s header, hover over its right border.
- Drag to modify the width of the column.
Customize Paging for the Table Display
To customize paging for the Events table:- Locate the # of rows dropdown above the Events table.
- Select the number of rows you would like to show per page.
Search Within Events
The Explore Data search feature is in beta.Your feedback can help us improve this feature!
Share feedback in Pollinators or through your account team.
- Locate the search bar above the table, and enter your search term.
- Press Enter on the keyboard to execute your search.
Page Through Events in the Table Display
To page through the data in the Events table:- Locate the arrow buttons above the table.
- Select the appropriate button:
- >: Move to the next page.
- <: Move to the previous page.
View Tracing Details from the Table Display
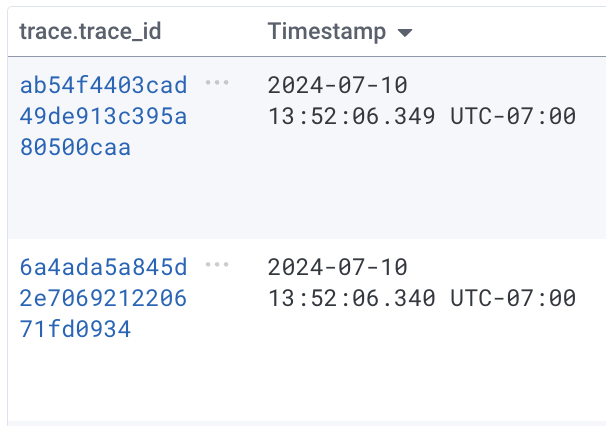
If your dataset is a tracing dataset, then thetrace.trace_id column displays trace ID fields as hyperlinks.
- Locate the event for which you would like to view a trace.
-
Locate the
trace.trace_idcolumn.If you can’t find yourtrace.trace_idcolumn, make sure you have added the column to your Events table. - Select the hyperlinked trace ID.
Modify the Query
You can modify your query from inside the Events view.- From the Table Display
- From the Log Lines Display
If your data in a table, expanding an event row will display a list of all fields and their values for the event, each of which you can interact with to modify the query or customize the table display.
- In the Events view, expand an event row to access all of the event’s fields and corresponding values.
- Select the name of the field with which you want to interact.
-
Select the action you want to take from the context menu:
- Add column to table: Adds the field to the columns displayed in the Events table.
- Remove column from table: Removes the field from the columns displayed in the Events table.
- Copy field name: Copies the field name to your local clipboard.
- Copy value: Copies the value to your local clipboard.
- Show only where field exists: Adds a WHERE clause to filter by
<field> exists, then re-runs the query. - Show only where field does not exist: Adds a WHERE clause to filter by
<field> does-not-exist, then re-runs the query. - Show only where field is value: Adds a WHERE clause to filter by
<field> = <value>, then re-runs the query. - Show only where field is not value: Adds a WHERE clause to filter by
<field> != <value>, then re-runs the query. - Group by field: Adds a GROUP BY clause to group by
<field>, then re-runs the query.
Download Your Data
To download your data:- In the Events view, locate and select the Download () icon.
- In the Export data modal, choose the fields to include in your download. Use the Export displayed fields only toggle to export all event fields [off] or export only fields displayed in the Events view [on].
- Choose the file format that you would like to download:
- CSV: Download Events data in comma-separated values format in a
.csvtext file. - JSON Download Events data in JSON format in a
.jsontext file.
- CSV: Download Events data in comma-separated values format in a
You can download a maximum of 1000 rows.