Beelines are deprecated and will reach End of Life on August 12, 2025.
The Python Beeline for Honeycomb is a quick and easy way to instrument your Python application. It has two powerful features:
Official API reference docs can be found here.
To see an example of the Python Beeline in action, try one of the Example Apps.
If you would like to see more options or functionality in the Python Beeline, please file an issue or vote up an already filed one!
If you prefer to use only Structured Logs, check out our Libhoney library.
You can find your API key in your Environment Settings. If you do not have an API key yet, sign up for a free Honeycomb account.
To use the Python Beeline for automatic instrumentation, you need to be using one of the following frameworks:
The Python Beeline does not currently support asyncio-based frameworks, and has limited support for Tornado. If you are using an asynchronous framework and would like to see support added in the Beeline, please file an issue.
Using a proxy requires overriding the default Transmission implementation when initializing libhoney:
import beeline
from libhoney.transmission import Transmission

beeline.init(
    writekey='YOUR_API_KEY',
    # The name of your app/service is a good choice
    service_name='my-python-app',
    debug=True,
    transmission_impl=Transmission(proxies={'https': 'https://myproxy.example.com'}),
)
The proxies map passed in is documented in the requests documentation.
Note that if you override transmission_impl, if you also have non-default values for options such as max_concurrent_batches and max_batch_size in libhoney.init, they will need to be specified in the new Transmission object.
Further configuration options can be found in the init.py file
Implementation of automatic instrumentation varies between frameworks, but each need just a few lines of code. Each implementation instruments the entrypoint for your application (usually a request) by starting a trace, collecting some commonly used fields, ending the trace, and sending the event data to Honeycomb.
You can build on this instrumentation by adding application-specific context as well as your own trace spans.
The Beeline uses Django’s request/response middleware (>1.10) and database query execution wrapper (>2.0).
In your project’s settings.py file:
MIDDLEWARE = [
    ...
    'beeline.middleware.django.HoneyMiddleware',
    ...
]
(If you would prefer to not use db instrumentation, use the HoneyMiddlewareHttp class instead.)
Then, in your app’s apps.py file:
from django.apps import AppConfig
import beeline

class MyAppConfig(AppConfig):
    def ready(self):
      # If you use uwsgi, gunicorn, celery, or other pre-fork models, see the section below on pre-fork
      # models and do not initialize here.
        beeline.init(
            writekey='YOUR_API_KEY',
            service_name='my-app-name',
            debug=True,
        )
Do not forget to set your app’s default config in your app’s __init__.py file:
default_app_config = 'myapp.apps.MyAppConfig'
The Beeline makes use of WSGI middleware. If you are using Flask’s SQLAlchemy extension, you can also take advantage of our built-in database middleware to automaticaly instrument your SQL queries.
Initialize the Beeline and pass your Flask app to HoneyMiddleware.
import beeline
from beeline.middleware.flask import HoneyMiddleware

# If you use uWSGI, Gunicorn, Celery, or other pre-fork models, do not initialize the Beeline here.
# See the section below on pre-fork models.
beeline.init(writekey='YOUR_API_KEY', service_name="my-app-name", debug=True)

# Pass your Flask app to HoneyMiddleware
app = Flask(__name__)
HoneyMiddleware(app, db_events=True) # db_events defaults to True, set to False if not using our db middleware with Flask-SQLAlchemy
This will instrument HTTP requests.
If you are using Flask’s SQLAlchemy extension, it will also instrument DB events.
If you are not using Flask SQLAlchemy or prefer not to instrument DB events, set db_events to False.
If you use uWSGI, Gunicorn, Celery, or other pre-fork models, do not initialize the Beeline here. See the section below on using the Python Beeline with pre-fork models.
After initializing the Beeline according to those instructions, you will be able to pass your Flask app to HoneyMiddleware as shown here.
The beeline instruments AWS Lambda using a decorator function that is applied to each Lambda handler function.
beeline.init(writekey='YOUR_API_KEY', service_name="my-lambda-function", debug=True)
from beeline.middleware.awslambda import beeline_wrapper

# wrapper starts a trace that ends when the function exits
@beeline_wrapper
def my_handler(event, context):
    # my code

    # add some context to this event
    beeline.add_context({"user_id": user_id})
The Tornado integration patches the Tornado Web RequestHandlers with code to instrument HTTP requests and exceptions. It works for Tornado version 5 and above.
import beeline
import libhoney
from beeline.patch import tornado

# If you use uwsgi, gunicorn, celery, or other pre-fork models, see the section below on pre-fork
# models and do not initialize here.
beeline.init(
    writekey='YOUR_API_KEY',
    service_name='my-app',
    # use a tornado coroutine rather than a threadpool to send events
    transmission_impl=libhoney.transmission.TornadoTransmission(),
    debug=True,
)
The beeline makes use of WSGI middleware to instrument HTTP requests.
To use it, add the following code where your Bottle app is initialized:
import beeline
from beeline.middleware.bottle import HoneyWSGIMiddleware

# If you use uwsgi, gunicorn, celery, or other pre-fork models, see the section below on pre-fork
# models and do not initialize here.
beeline.init(
  writekey='YOUR_API_KEY',
  service_name='my-app',
  debug=True,
)

app = bottle.app()
myapp = HoneyWSGIMiddleware(app)
bottle.run(app=myapp)
The beeline makes use of WSGI middleware to instrument HTTP requests.
To use it, add the following code where your Werkzeug app is initialized:
import beeline
from beeline.middleware.werkzeug import HoneyWSGIMiddleware

# If you use uwsgi, gunicorn, celery, or other pre-fork models, see the section below on pre-fork
# models and do not initialize here.
beeline.init(
  writekey='YOUR_API_KEY',
  service_name='my-app',
  debug=True,
)

app = YourApp()
myapp = HoneyWSGIMiddleware(app)
# ... start app
The Python Beeline supports auto-instrumentation of outgoing HTTP requests using the popular requests library.
When enabled, outgoing HTTP requests will generate their own span in a trace and include a Honeycomb trace context propagation header (X-Honeycomb-Trace) that can be used to construct distributed traces that cross process boundaries.
To enable automatic instrumentation of requests, just import the appropriate patch into the current namespace:
import requests
import beeline

from beeline.patch.requests import requests

beeline.init(
  writekey='YOUR_API_KEY',
  service_name='my-app',
  debug=True,
)

result = requests.get('https://other-service.local/path/info')
The Python Beeline has a complete tracing API that you can use on your own or in addition to the default automatic instrumentation. Tracing can be reduced to a few basic steps:
start_trace is the starting point for all tracing.
You will want to call it at the start of an interesting transaction, operation, or workflow that you want to instrument.
start_trace returns a copy of the root span, which should be passed back to finish_trace when you want to complete your trace.
Calling finish_trace concludes the trace in the Beeline’s internal state manager and sends its event data to Honeycomb.
def main():
    trace = beeline.start_trace(context={
        "name": "my application",
        "hostname": hostname,
        # other initial context
    })

    # application code

    # add some more context
    beeline.add_context({"user_id": user_id})

    # more application code

    beeline.finish_trace(trace)

    # since our app is shutting down, call close() to flush any remaining
    # events
    beeline.close()
start_trace and end_trace explicitly.Tracing tells a story of what transpired inside your transaction or workflow, but to tell that story, you need spans! Spans represent noteworthy parts of your application that you would like to instrument. Examples include: database queries, external service calls, long computations, batch processing, and more. If it is a potential bottleneck or point of failure, consider enclosing it in a span.
start_span creates a new span as a child of the active span.
When you start a trace, the root span is the active span.
As you add and finish spans, this will change.
The beeline keeps track of this for you, but it is important that each call to start_span is matched with a call to finish_span in order for the Beeline’s internal state manager to keep the trace’s ordering intact.
You must have an active trace to call start_span or no span will be created.
# trace is started - we have one active span: the root span
trace = beeline.start_trace()

# ...

# something interesting is coming up: a db query!
# create a new span
span = beeline.start_span(context={
    "name": "db query",
    "db_host": db_host,
    "query": sql,
})

# run db query

# add some more context to the current span
beeline.add_context({"db_result_count", result_count})

# close this span. This will automatically add a `duration_ms` field describing
# the length of the span
beeline.finish_span(span)

# more code

beeline.finish_trace(trace)
The Python Beeline includes an optional tracer context manager, which will do the work of starting and closing a span for you.
# This will create a span - or if no trace is in progress, will also
# start a trace
with beeline.tracer(name="external_api_call"):
    # add some context to this span
    beeline.add_context({"request_params": request_params})
    result, error = external_api_request(request_params)
    # add more context once we have results
    beeline.add_context({"result_count": len(result), "error": error})

    # You can have nested tracer context managers. A new child span will be
    # created
    with beeline.tracer(name="process api results"):
        # if an unhandled exception occurs inside a context manager, the event
        # will still get closed, and the exception type and message
        # will get added to the event
        raise Exception("something went wrong!")

# We have exited the context manager, which has done the work of closing the span
# for us
You can instrument entire functions using the traced decorator.
Wrapping a function with traced decorator will create a span when the function is called, and close it when it returns.
If no trace is ongoing, calling the decorated function will start a new trace.
import beeline

@beeline.traced(name='external_api_request')
def external_api_request(request_params):
    # ...

    # adding fields here will add it to the active span wrapping
    # this function
    beeline.add_context_field("response_time", response_time)

    # ...

@beeline.traced(name='main')
def main():
  beeline.add_context({"request_params": request_params})
  # calling this function will create a new span, under the "main" span
  result, error = external_api_request(request_params)
  # add more context once we have results
  beeline.add_context({"result_count": len(result), "error": error})

# This will create a span - or if no trace is in progress, will also
# start a trace
main()

# Do not forget to close the beeline to ensure all spans get sent
# before the application ends!
beeline.close()
Due to its use of threadlocal storage to keep track of spans, tracing in the Python Beeline does not currently work smoothly across threads.
If you use the tracer context manager inside a thread, it will generate a new trace ID separate from your other traced events.
If you call start_span inside a thread, it not work unless you also explicitly start a new trace with start_trace inside that thread.
trace = beeline.start_trace()

def thread_func():
    # there's no trace context inside this thread, so the span will not start
    span = beeline.start_span(context={'name': 'thread_func'})

    # ...

    beeline.finish_span(span)

    # tracer will detect that there is no active trace inside this thread, and
    # start a new one
    with beeline.tracer(name='thread_func'):
        # ...

t = threading.Thread(target=thread_func).start()
To work around this, you can use the traced_thread decorator to pass trace state to the new thread.
trace = beeline.start_trace()

@beeline.traced_thread
def thread_func():
    # this thread now has a copy of the active trace state, and new spans will be created
    # with the right parent and trace IDs
    with beeline.tracer(name='thread_func'):
        # ...

t = threading.Thread(target=thread_func).start()

beeline.finish_trace(trace)
Having detailed events is key to understanding your application. Consider keeping as much context as possible. Try putting a timer around a section of code, adding per-user information, or details about what it took to craft a response. You can add fields when and where you need to, or for some events but not others. (Error handlers are a good example of this.)
Use beeline.add_context_field to add fields to the currently active span.
For example, if want to add the user ID associated with the current request before the event is sent to Honeycomb:
beeline.add_context_field('user_id', user_id)
The currently active span is determined by the beeline’s internal state manager.
If a field is being attributed to the wrong event, make sure that for every call to beeline.start_span() there is a matching call to beeline.finish_span().
Sometimes it is useful for information you capture earlier in a trace to be available in other spans. For example, maybe you have an instrumented function shared by multiple HTTP endpoint handlers, and you would like to know which endpoint called it. You can do this with a trace field.
# Start a new trace
trace = beeline.start_trace(context={
    "name": "my application",
    "src_addr": src_addr,
    "method": http_method,
    # other initial context
})

# this field will be added to our root span and all child spans going forward
beeline.add_trace_field("endpoint", http_endpoint)

# ...

# here is our shared function, we will wrap it with `tracer` to start a new span
# The span automatically inherits the field "endpoint" from the trace
# with no extra effort
with beeline.tracer(name="my_shared_function"):
    my_shared_function()

# ...

# do not forget to finish our trace!
beeline.finish_trace(trace)
There may be circumstances where you would like to send events that are not closely related to an ongoing trace. You can access the Beeline’s underlying Libhoney client to create raw events that do not contain trace metadata.
client = beeline.get_beeline().client
ev = client.new_event()
ev.add(myfields)
ev.send()
We have built-in support for sampling in the Beeline.
Simply set the sample_rate variable when calling beeline.init():
beeline.init(
   writekey='YOUR_API_KEY',
   service_name='my-app',
   debug=True,
   sample_rate=5, # sends 1/5 (20%) of events
)
The value of sample_rate must be a positive integer.
The Python Beeline uses a deterministic sampling algorithm when sampling traces. Since trace IDs are randomly generated, sampling can be applied to the ID rather than randomly selecting individual events. This allows traces to stay intact when sampling is enabled, while still being random. Setting the sample rate to 10 will sample one in 10 traces.
Our sampler hook gives you more power over how events are sampled.
By including a sampler hook, you override the built-in sampling logic driven by the sample_rate variable and replace it with your own.
For example, assume you have instrumented an HTTP app and want a default sampling rate of 1 in 10 events.
However, you would like to keep all requests that return an error, and heavily sample healthy traffic like 200 response codes.
Also, you do not really care about 302 redirects in your app, and want to drop those.
You could define a sampler function like so:
import hashlib
import math
import struct

MAX_INT32 = math.pow(2, 32) - 1

# Deterministic _should_sample taken from https://github.com/honeycombio/beeline-python/blob/1ffe66ed1779143592edf9227d3171cb805216b6/beeline/trace.py#L258-L267
def _should_sample(trace_id, sample_rate):
  sample_upper_bound = MAX_INT32 / sample_rate
  sha1 = hashlib.sha1()
  sha1.update(trace_id.encode('utf-8'))
  # convert last 4 digits to int
  value, = struct.unpack('<I', sha1.digest()[-4:])
  return value < sample_upper_bound

def sampler(fields):
  # our default sample rate, sample one in every 10 events
  sample_rate = 10

  response_code = fields.get('response.status_code')
  # False indicates that we should not keep this event
  if response_code == 302:
    return False, 0
  elif response_code == 200:
    # heavily sample healthy requests
    sample_rate = 100
  elif response_code >= 500:
    # sample every error request
    sample_rate = 1

  # The truthiness of the first return argument determines whether we keep the
  # event. The second argument, the sample rate, tells Honeycomb what rate the
  # event was sampled at (important to correctly weight calculations on the data).
  trace_id = fields.get('trace.trace_id')
  if _should_sample(trace_id, sample_rate):
    return True, sample_rate
  return False, 0
To apply this new logic, pass this function to beeline.init():
import beeline
beeline.init(writekey='mywritekey', service_name='myapp', debug=True, sampler_hook=sampler)
trace.trace_id into account (as we did above in by hashing the trace ID), you will get incomplete traces.Our presend hook enables you to modify data right before it is sent to Honeycomb.
For example, if you have a field that sometimes contains PII or other sensitive data, you might want to scrub the field or drop it all together.
def presend(fields):
  # We don't want to log customer IPs that get captured in the beeline
  if 'request.remote_addr' in fields:
    del fields['request.remote_addr']

  # this field is useful, but sometimes contains sensitive data.
  # Run a scrubber method against it before sending
  if 'transaction_log_msg' in fields:
    fields['transaction_log_msg'] = scrub_msg(fields['transaction_log_msg'])
You could also set global fields that you want in all events:
fields['environment'] = 'myenv'
After defining your presend hook function, pass it to the beeline’s init method:
import beeline
beeline.init(writekey='mywritekey', service_name='myapp', debug=True, presend_hook=presend)
Note: Sampler hooks are executed before presend hooks.
When a service calls another service, you want to ensure that the relevant trace information is propagated from one service to the other. This allows Honeycomb to connect the two services in a trace.
Distributed tracing enables you to trace and visualize interactions between multiple instrumented services. For example, your users may interact with a front-end API service, which talks to two internal APIs to fulfill their request. In order to have traces connect spans for all these services, it is necessary to propagate trace context between these services, usually by using an HTTP header.
Both the sending and receiving service must use the same propagation format, and both services must be configured to send data to the same Honeycomb environment.
Distributed tracing enables you to trace and visualize interactions between multiple instrumented services. For example, your users may interact with a front-end API service, which talks to two internal APIs to fulfill their request. In order to have traces connect spans for all these services, it is necessary to propagate trace context between these services, usually by using an HTTP header.
Automatic instrumentation supports trace propagation automatically, as long as your services are using the Honeycomb beeline, and an instrumented component to send and receive requests.
Trace context propagation with OpenTelemetry is done by sending and parsing headers that conform to the W3C Trace Context specification.
To get Beelines and OpenTelemetry instrumentation to interoperate, you will need to use W3C headers.
The Beeline includes marshal and unmarshal functions that can generate and parse W3C Trace Context headers. Honeycomb Beelines default to using a Honeycomb-specific header format on outgoing requests, but can automatically detect incoming W3C headers and parse them appropriately. In mixed environments where some services are using OpenTelemetry and some are using Beeline, W3C header propagation should be used.
To propagate trace context, a parser hook and propagation hook are needed. The parser hook is responsible for reading the trace propagation context out of incoming HTTP requests from upstream services. The propagation hook is responsible for returning the set of headers to add to outbound HTTP requests to propagate the trace propagation context to downstream services.
Note: Older versions of Honeycomb Beelines required HTTP parsing hooks to properly parse incoming W3C headers. Current versions of Honeycomb Beelines can automatically detect incoming W3C headers and parse them appropriately. Check the release notes for your Beeline version to confirm whether an upgraded version is needed.
To specify that a service should propagate W3C Trace Context Headers with outgoing requests, you must specify a propagation hook in the beeline configuration.
To specify parser and propagation hooks for W3C trace headers, use the beeline.propagation.w3c module, and configure them as follows during beeline initialization:
import beeline
import beeline.propagation.w3c as w3c

beeline.init(
    writekey='YOUR_API_KEY',
    # The name of your app/service is a good choice to start with
    service_name='my-python-app',
    debug=True,
    http_trace_parser_hook=w3c.http_trace_parser_hook,
    http_trace_propagation_hook=w3c.http_trace_propagation_hook
)
In order to propagate trace context, two things need to be configured: the http_trace_parser_hook and the http_trace_propagation_hook.
If you are using Honeycomb’s beeline trace propagation, you do not need to do any additional configuration - we default to using the Honeycomb implementations in beeline.propagation.honeycomb.
The http_trace_parser_hook is responsible for reading the trace propagation context out of HTTP requests from upstream services.
If you are using one of our automatic instrumentations for a request framework (Django, Flask, and Lambda, for example), this hook will be called automatically to parse the trace context.
The http_trace_propagation_hook is responsible for returning the set of headers to add to outbound HTTP requests to propagate the trace propagation context to downstream services.
If you are using automatic instrumentation for Requests or urllib, this hook will be called automatically to propagate the trace context.
You may choose to use custom trace propagation hooks for various reasons:
If you intend to use your own custom trace propagation, you will need to implement these hooks, and configure the beeline to use them.
You can configure the beeline by setting the http_trace_parser_hook and http_trace_propagation_hook in beeline.init as below:
import beeline

beeline.init(
    writekey='YOUR_API_KEY',
    # The name of your app/service is a good choice to start with
    service_name='my-python-app',
    debug=True,
    http_trace_parser_hook=my_parser_hook,
    http_trace_propagation_hook=my_propagation_hook
)
For more details on writing your own custom parser and propagation hooks, we recommend looking at the http_trace_parser_hook and http_trace_propagation_hook implementations in beeline.propagation.honeycomb
and beeline.propagation.w3c.
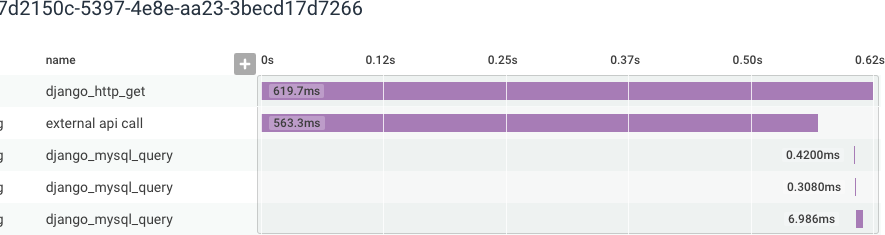
Below is a sample event from the Python Beeline.
This example is an http_server event, generated when your app handles an incoming HTTP request.
{
  "Timestamp": "2018-07-03T04:57:12.517022Z",
  "duration_ms": 619.703,
  "meta.beeline_version": "0.1.1",
  "meta.local_hostname": "hostname123",
  "name": "django_http_get",
  "request.content_length": "",
  "request.host": "localhost:8000",
  "request.method": "GET",
  "request.path": "/",
  "request.post": "{}",
  "request.query": "{}",
  "request.remote_addr": "127.0.0.1",
  "request.scheme": "http",
  "request.secure": false,
  "request.user_agent": "Mozilla/5.0 (Macintosh; Intel Mac OS X 10_13_4) AppleWebKit/537.36 (KHTML, like Gecko) Chrome/67.0.3396.99 Safari/537.36",
  "request.xhr": false,
  "response.status_code": 200,
  "service_name": "my-app",
  "trace.span_id": "3eada0ce-934b-4ffd-bb72-2c9f57b02bf1",
  "trace.trace_id": "07d2150c-5397-4e8e-aa23-3becd17d7266",
  "type": "http_server"
}
Events are also (optionally) created for DB queries.
{
  "Timestamp": "2018-07-03T04:57:13.119424Z",
  "db.duration": 6.8919999999999995,
  "db.last_insert_id": 0,
  "db.query": "SELECT `blog_post`.`id`, `blog_post`.`author_id`, `blog_post`.`title`, `blog_post`.`text` FROM `blog_post`",
  "db.query_args": "[]",
  "db.rows_affected": 6,
  "duration_ms": 6.986,
  "meta.beeline_version": "0.1.1",
  "meta.local_hostname": "hostname123",
  "name": "django_mysql_query",
  "service_name": "my-app",
  "trace.parent_id": "3eada0ce-934b-4ffd-bb72-2c9f57b02bf1",
  "trace.span_id": "4a5bb9ab-1aab-4772-ab06-4ba31e196bea",
  "trace.trace_id": "07d2150c-5397-4e8e-aa23-3becd17d7266",
  "type": "db"
}
Here are some examples to get you started querying your app’s behavior:
This query uses a custom user.email field.
To create a custom field, see Adding fields, below.
Support for asyncio is available in beeline 2.11 and later. When using asyncio, you can follow all of the usual tracing patterns described in this doc. The main difference is that you will need to init the beeline from code that is run inside the event loop. Here is some example code that may help you get started:
import asyncio
import beeline

# traced wraps the method in a span
@beeline.traced("do_work")
def do_work(parameters):
    # some work ...

@beeline.traced("report_result")
async def report_result(res):
    # ... call api with result

@beeline.traced("run_job")
async def run_job(name, parameters):
    beeline.add_context({"name": name, "parameters": parameters"})

    result = do_work(parameters)

    await report_result(result)

async def main():
    # you should init the beeline inside the event loop
    beeline.init(writekey='yourwritekey', service_name='job-app', debug=True)

    with beeline.tracer("main"):
        jobs = get_jobs()

        runs = []
        for job in jobs:
            runs.append(run_job(job.name, job.parameters))

        await asyncio.wait(runs)

if __name__ == "__main__":
    asyncio.run(main())

    # close beeline on shutdown to flush any remaining events
    beeline.close()
By default, events are sent to the Honeycomb API.
It is possible to override the default transmission implementation by specifying transmission_impl to init.
A couple of alternative implementations ship with the libhoney SDK.
To override the default transmission and write events out to stderr:
import beeline
import libhoney
from libhoney.transmission import FileTransmission

beeline.init(writekey='yourwritekey', transmission_impl=FileTransmission(output=sys.stderr))
Not seeing your newly instrumented service appearing in Honeycomb? Here are some things to check:
The service name is a required configuration value.
If it is unspecified, all trace data will be sent to a default dataset called unknown_service.
The Python Beeline supports an optional debug mode.
When enabled, additional logging to stderr will indicate when an event is enqueued, when a trace starts and ends, and whether or not the Beeline initialized correctly.
To enable verbose mode, set debug=True in the call to beeline.init():
beeline.init(
   writekey='YOUR_API_KEY',
   service_name='my-app'
   debug=True,
   )
You can use the queue returned by beeline.get_responses_queue() to check whether events were successfully received by Honeycomb’s servers.
Each response includes the following fields:
status_code: the HTTP status code returned by Honeycomb when trying to send the eventduration: the number of milliseconds it took to send the eventbody: the body of the HTTP response from Honeycomb.
On failures, this body contains some more information about the failure.error: in the case of an error before the HTTP attempt, the reason will be in this field.
For example, when sampled or dropped because of a queue overflow.There can be a number of reasons for missing root spans. One potential reason could be that there is an upstream service, load balancer, or other proxy propagating W3C trace headers as part of your distributed trace. Since beelines accept both Honeycomb and W3C headers, that service propagating a W3C header will cause “missing span” gaps in your trace if the service is not also configured to send telemetry to Honeycomb. The solution is to either instrument that service and configure it to send telemetry to Honeycomb, or to specify in the downstream service’s beeline configuration that only Honeycomb propagation headers should be parsed.
To override undesired W3C trace header propagation behavior, configure the Beeline to use an http_trace_parser_hook:
beeline.init(
    writekey='YOUR_API_KEY',
    service_name='my-python-app',
    http_trace_parser_hook=honeycomb.http_trace_parser_hook,
)
The above configuration will solely use the Honeycomb format when parsing incoming trace headers. See Distributed Trace Propagation for more details.
Honeycomb events are sent in batches.
By default, this happens every 100ms.
When your application terminates, it is possible for some events to still be in the queue, unsent.
To ensure that all events get flushed before shutdown, call beeline.close() before your application exits.
You can register an atexit handler after initializing the Beeline like so:
import beeline
import atexit

beeline.init(...)
atexit.register(beeline.close)
Popular servers like uWSGI and Gunicorn utilize a pre-fork model where requests are delegated to separate Python processes.
Initializing the Python Beeline before the fork happens can lead to a state where events cannot be sent.
To initialize the Python Beeline correctly, you will need to run your init code inside a post-fork hook, and remove any other calls to init.
beeline.init step there with the initialization steps you followed here.The beeline uses the requests lib, which uses urllib3.
If you are using gevent, you should call its monkey patching functions before importing the beeline for the first time, or you may encounter a RecursionError when sending events.
import gevent.monkey
gevent.monkey.patch_all()

import beeline
Users of uWSGI can use a postfork decorator.
Simply add the @postfork decorator to the function that initializes the Python Beeline,
and it will be executed post-fork.
import logging
import os

import beeline
from uwsgidecorators import postfork

@postfork
def init_beeline():
    logging.info(f'beeline initialization in process pid {os.getpid()}')
    beeline.init(writekey="YOUR_API_KEY", service_name="honeycomb-uwsgi-example", debug=True)
Gunicorn users can define a post_worker_init function in the Gunicorn config, and initialize the Python Beeline there.
 # conf.py
import logging
import os
import beeline

def post_worker_init(worker):
    logging.info(f'beeline initialization in process pid {os.getpid()}')
    beeline.init(writekey="YOUR_API_KEY", service_name="honeycomb-gunicorn-example", debug=True)
Then start gunicorn with the -c option:
gunicorn -c /path/to/conf.py
Celery uses a pre-fork approach to create worker processes.
You can specify a worker_process_init decorated function to initialize the Python Beeline after each worker has started.
import logging
import os
import beeline

from celery.signals import worker_process_init
@worker_process_init.connect
def initialize_honeycomb(**kwargs):
    logging.info(f'beeline initialization in process pid {os.getpid()}')
    # don't call init in other parts of your code, only in this hook
    beeline.init(writekey="YOUR_API_KEY", service_name="honeycomb-celery-example", debug=True)

# optional: start a trace with the start of each task
from celery.signals import task_prerun
@task_prerun.connect
def start_celery_trace(task_id, task, args, kwargs, **rest_args):
    queue_name = task.request.delivery_info.get("exchange", None)
    task.request.trace = beeline.start_trace(
        context={
            "name": "celery",
            "celery.task_id": task_id,
            "celery.args": args,
            "celery.kwargs": kwargs,
            "celery.task_name": task.name,
            "celery.queue": queue_name,
        }
    )

# optional: finish and send the trace at the end of each task
from celery.signals import task_postrun
@task_postrun.connect
def end_celery_trace(task, state, **kwargs):
    beeline.add_field("celery.status", state)
    beeline.finish_trace(task.request.trace)
Bug fixes and other changes to Beelines are gladly accepted. Please open issues or a pull request with your change via GitHub. Remember to add your name to the CONTRIBUTORS file!
All contributions will be released under the Apache License 2.0.