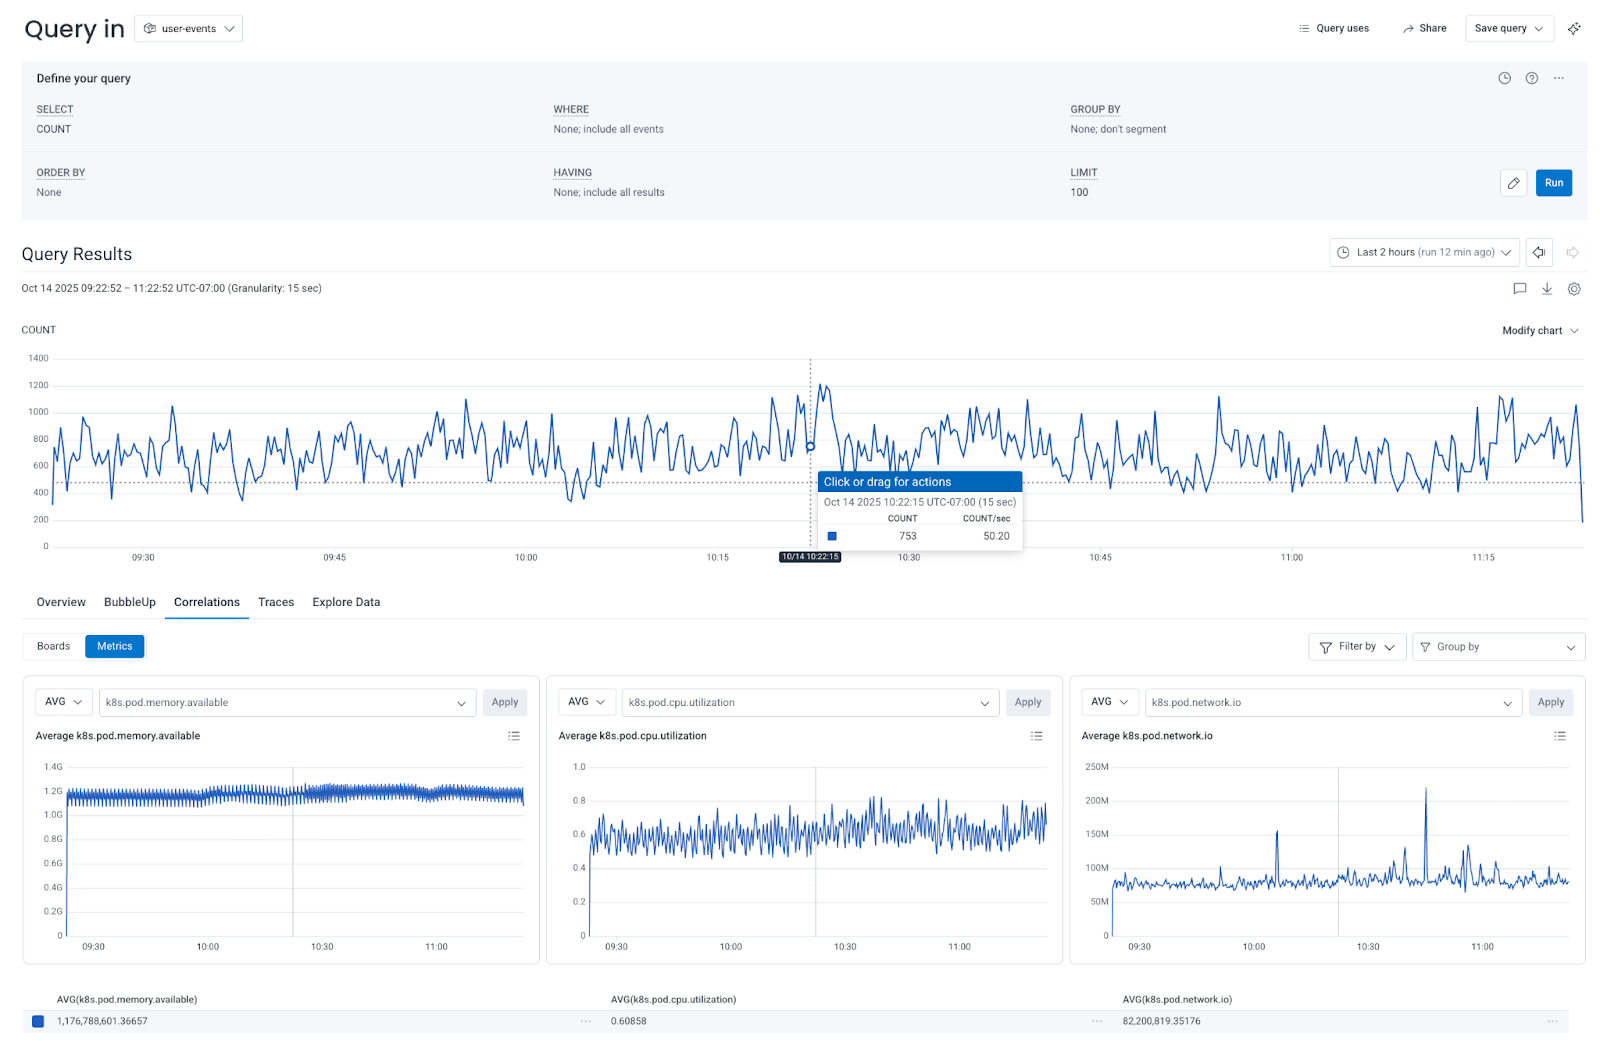
Connect events and metrics data in Honeycomb to understand how system resources impact application performance.
Metrics Correlations connect your events and metrics data, helping you understand how system-level resource performance relates to application behavior.
When you query an events dataset in Honeycomb, you can explore correlated metrics, such as CPU utilization or memory usage, directly alongside your query results. You don’t need to manually construct Boards or switch between Datasets.
This feature helps you quickly answer questions like:
When you run an events-based query, Honeycomb automatically enables the Correlations > Metrics view beneath your query results.
When you open this view, Honeycomb triggers a parallel query against your metrics dataset, using the same time window and any compatible filters from your main events query (when the fields exist in both datasets’ schemas).
You get a contextual, correlated view of your metrics data shown in familiar Honeycomb visualizations.
The metrics query runs independently, so you can interact with it further. Choose which metrics to access, add filters or groupings, or explore the underlying query directly.

To use metrics correlations:
Run an events query.
For example, query your user-events dataset to explore error rates or response times.
Open the Correlations view. Select Correlations > Metrics at the bottom of your query results.
Access correlated metrics.
Honeycomb automatically surfaces up to three charts showing relevant metrics (for example, k8s.pod.cpu.time, k8s.pod.cpu.utilization, and k8s.pod.network.io).
Each chart shows a time series over the same period as your events query.
Interact and explore.
Review the metrics overview table below the charts. The metrics overview table lists the aggregated data points for each metric.
Each chart displays an aggregated metric over time. By default, Honeycomb populates these charts with common metrics for your environment (for example, CPU time or memory usage).
Use these correlations to:
You can adjust the metrics view to fit your investigation:
k8s.pod.name or host).The metrics query inherits filters from your main query where compatible fields exist, ensuring alignment between your events and metrics views.
This initial release of Metrics Correlations focuses on events-to-metrics context within the query results view.
It does not yet include:
Future releases will expand correlations into trace and span detail views.
For now, Metrics Correlations gives you an instant, contextual way to connect application events to the underlying system metrics all in one place.