

This page covers telemetry from the Claude Platform: Claude Managed Agents and the Claude API.
To send telemetry from other Anthropic sources:
- Claude Code: Refer to Remapping existing telemetry.
- Anthropic usage and cost reports: Refer to Monitor Anthropic Usage & Cost.
Before you begin
Make sure that you have:- The Admin role in your organization at platform.claude.com, which Anthropic calls the Claude Console. This is the organization that owns your Claude API keys, and it’s separate from any Claude Team or Enterprise organization you use at claude.ai.
- A Honeycomb Ingest API key for the environment that should receive your Claude traces. The key needs permission to create datasets.
Add Honeycomb as a destination
1
Open OpenTelemetry settings
At platform.claude.com, open your settings and select OpenTelemetry in the left navigation.
If a workspace is selected, select the X on the workspace filter to clear it.
2
Select Add destination
Select Add destination.
3
Choose Honeycomb
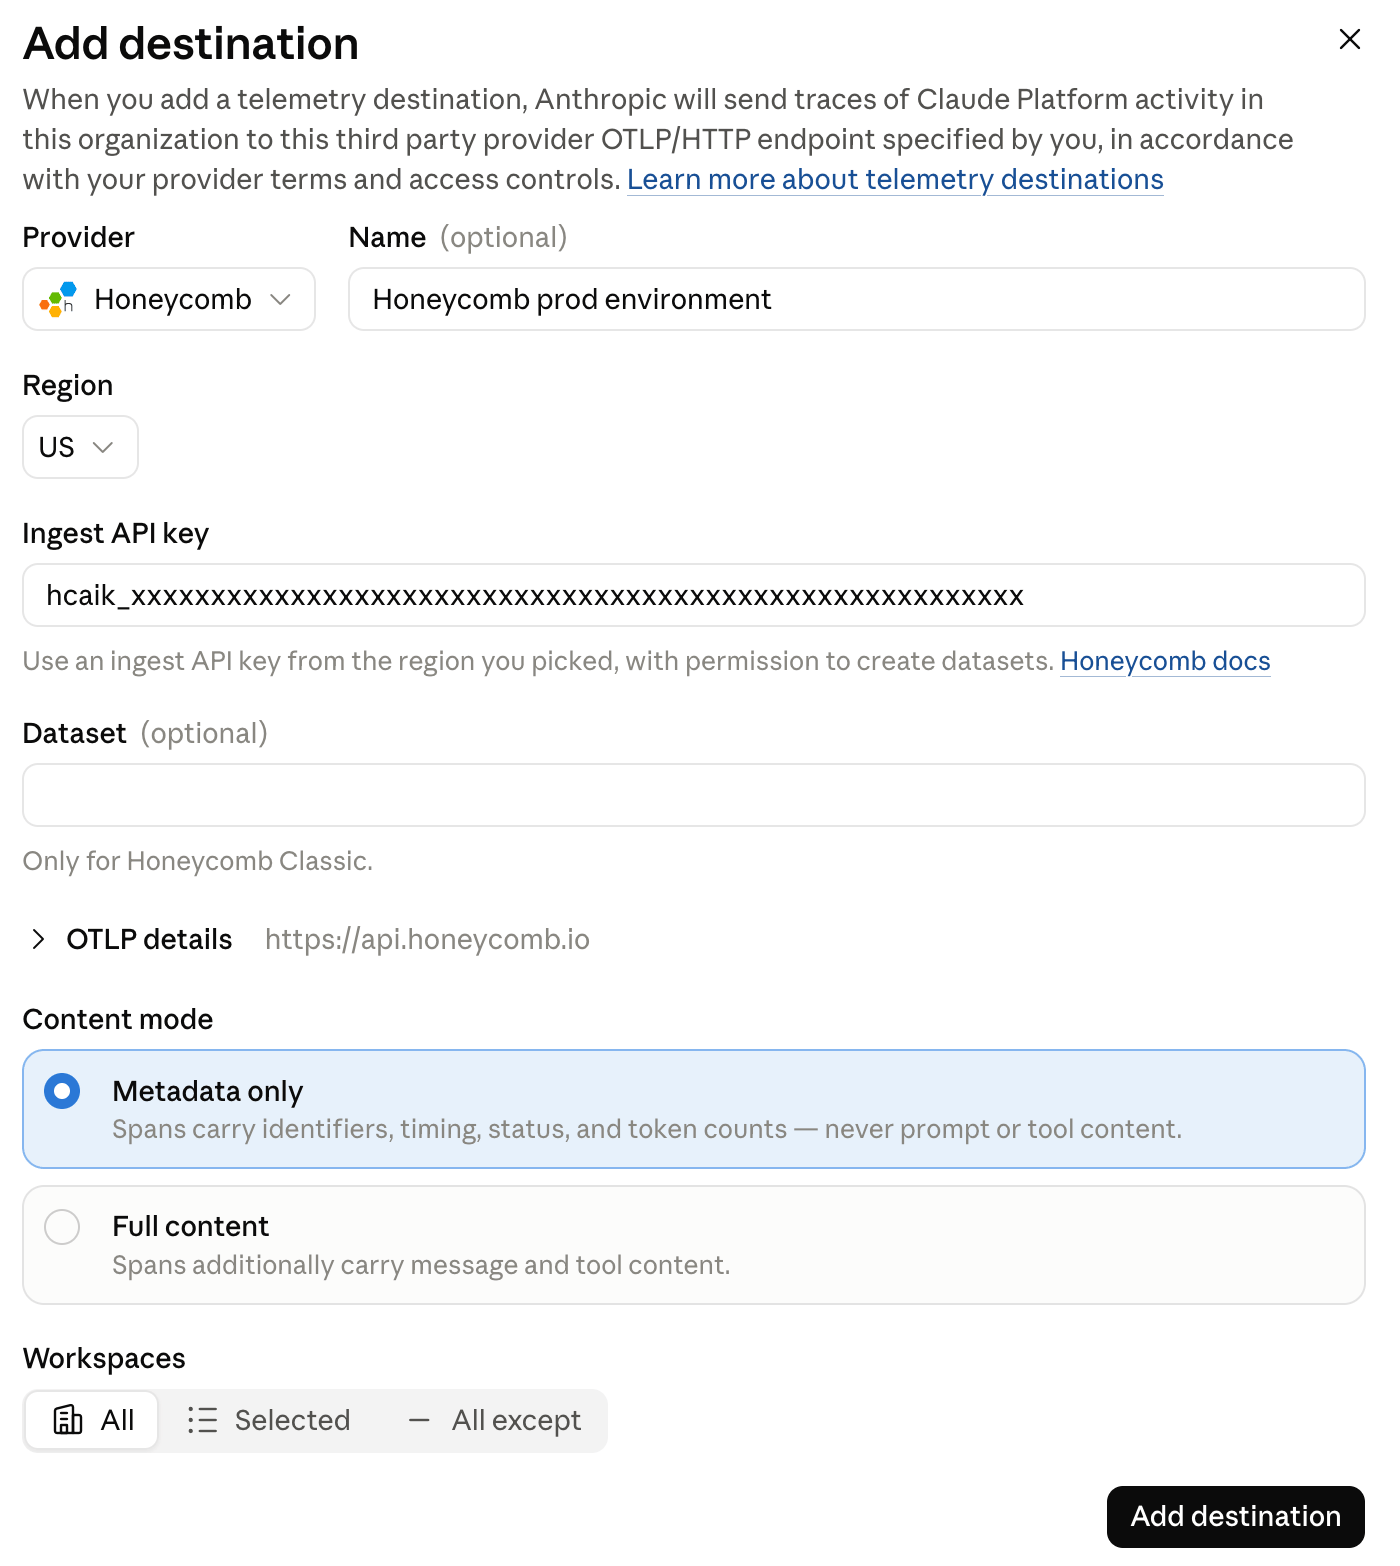
In Provider, select Honeycomb.
Optionally, change the Name of the destination, such as
Honeycomb production.4
Check the region
Region is US, and the endpoint under OTLP details is
https://api.honeycomb.io.If your Honeycomb team is in the EU, you can’t select EU when you add the destination. Either:
- Add the destination with the Honeycomb provider, then edit the destination and change OTLP endpoint URL to
https://api.eu1.honeycomb.io. - Add the destination with the Custom provider instead. Set OTLP endpoint URL to
https://api.eu1.honeycomb.io, and under Request headers, addx-honeycomb-teamwith your Ingest API key as the value.
5
Add your API key
In Ingest API key, paste your Honeycomb Ingest API key.
Use a key with permission to create datasets.
6
Leave Dataset empty
Leave Dataset empty.
Honeycomb names the dataset after the service,
claude-platform.7
Choose a content mode
Select how much content Claude includes in each span:
- Metadata only: Spans carry identifiers, timing, status, and token counts, but never prompt or tool content.
- Full content: Spans also carry message and tool content, including system instructions, prompts, and model responses.
8
Choose where it applies
In Workspaces, choose which Claude Platform workspaces will send data to Honeycomb.
9
Save the destination
Select Add destination.
Send traces through your own collector
To route Claude traces through your own OpenTelemetry Collector or Refinery before they reach Honeycomb, add a destination with the Custom provider instead of Honeycomb.1
Open OpenTelemetry settings
Open the OpenTelemetry settings page, as described in Add Honeycomb as a destination.
2
Select Add destination
Select Add destination.
3
Choose Custom
In Provider, select Custom.
4
Enter your collector's endpoint
In OTLP endpoint URL, enter your collector’s OTLP/HTTP base URL.
Don’t include
/v1/traces, because Claude Platform appends it to the URL.The endpoint must:- Use HTTPS on port 443.
- Have a certificate from a publicly trusted certificate authority.
5
Add authentication headers
Under Request headers, add any authentication headers that your collector needs.
6
Save the destination
Complete the remaining fields, and then select Add destination.
7
Export from your collector to Honeycomb
Claude Platform sends OTLP/HTTP with protobuf encoding, so make sure your collector accepts it.
Then configure your collector to export to Honeycomb:
- OpenTelemetry Collector: Refer to Send Data with the OpenTelemetry Collector.
- Refinery: Refer to Set Up Honeycomb Refinery.
Verify your data
To generate traces, run an agent from the Claude Console agent quickstart, send a message in the Claude Console playground, or send a request to the Claude API. Within about a minute, the Delivery column on the Claude Console’s OpenTelemetry settings page should display Healthy.
- Open the environment that matches your API key.
- Select Query, and choose the
claude-platformdataset. - Select Run Query. The graph shows a count of Claude Platform spans.
- Select any point on the graph, and in the menu that appears, select View trace.
claude-platform dataset.
What Claude Platform sends
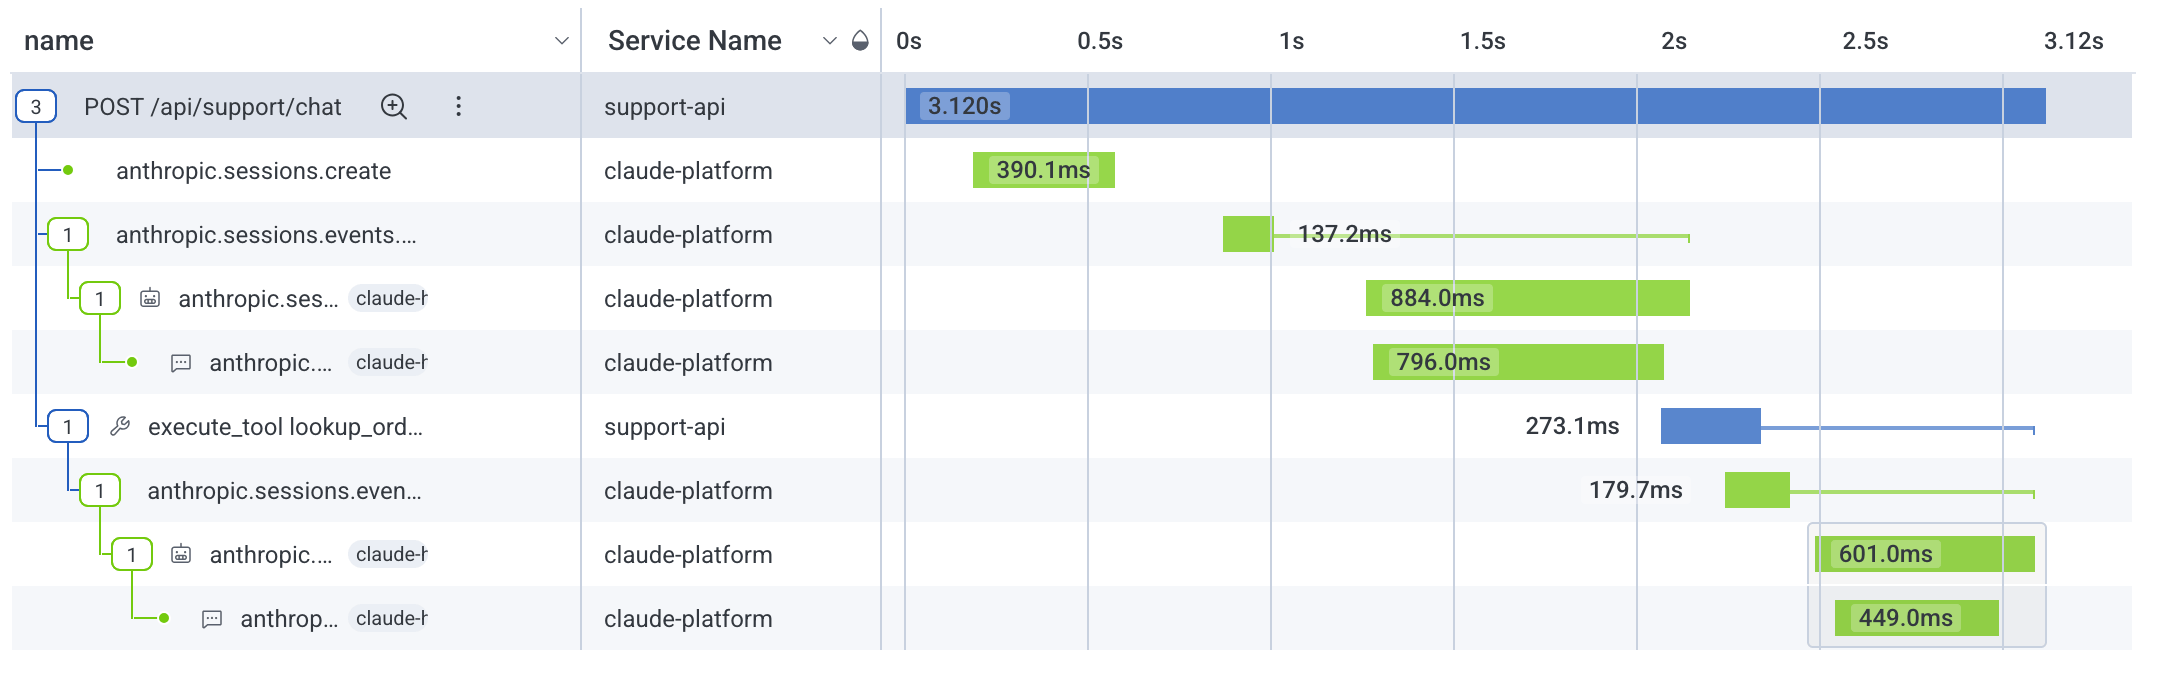
Claude Platform sends traces only, with no metrics or logs. It doesn’t sample: every span is sent, unless your application’s trace context says to drop the trace. Unless you pass in your own trace context, each request to the Claude API starts a new trace. In Managed Agents, the trace for a request contains the agent turns it starts, and each turn contains its model calls and tool calls. One Managed Agents conversation can span several traces. To see a whole conversation in one place, open it in the Agent Timeline, or filter ongen_ai.conversation.id.
The conversation ID is on each turn, model call, and tool call span.
Key attributes
Honeycomb adds estimated LLM cost fields at ingest to spans with a
gen_ai.operation.name of chat.
Each model call has exactly one chat span, so you can sum estimated cost across all spans without counting a call twice.
Limitations
As of October 14, 2026, Claude Platform doesn’t populate all the fields that the Agent Timeline uses, so some details don’t appear there. Honeycomb’s conversation cost totals include onlychat spans.
To use Anthropic’s spans as a source of token counts instead, sum only the spans named anthropic.model_request, anthropic.compaction, and anthropic.session.outcome_evaluation.
OpenTelemetry export is in beta on the Claude Platform, and Anthropic may change field names at any time.
Full compatibility with Honeycomb’s GenAI features isn’t guaranteed.
Connect Claude traces to your application
When your application calls the Claude API, it can send its trace context in a W3Ctraceparent header.
Claude’s request span then becomes a child of your application’s span, and everything the request starts nests under it.
In Honeycomb, you see one trace: your request handler, the agent turns and model calls it triggered, and the custom tools your code ran in between.
httpx for the Claude Python SDK.
Its OpenTelemetry instrumentation creates a client span for each request and adds the traceparent header for you.
To have your coding agent set this up, give it a prompt like this one:
extra_headers argument works for Messages API calls, such as client.messages.create.
Claude Platform respects the sampled flag in traceparent.
Claude’s spans follow your application’s head sampling decision, so a trace is either complete or absent.
Honeycomb assembles traces across all datasets in an environment, so send your application’s telemetry to the same environment as your Claude Platform destination.
Troubleshooting
You don’t see Add destination:- Confirm that the page isn’t filtered to a workspace. The button appears only when no workspace is selected.
- Confirm that you have the Admin role in your organization at platform.claude.com.
claude-platform dataset appears:
- Check the Delivery column on the Claude Console’s OpenTelemetry settings page. If it displays Failing, hover over it to see the last error:
HTTP error (status 401)orHTTP error (status 403)usually means the API key is wrong.HTTP error (status 404)usually means the endpoint URL has the wrong path. With a Custom provider, don’t include/v1/traces.TLS failuremeans a certificate problem with the endpoint.
- If it displays Disabled, hover over it to see why. Claude Platform disables a destination that redirects, resolves to a non-public IP address, or fails every delivery for 24 hours. Fix the cause, then select Enable from the destination’s More actions menu. Spans produced while the destination was disabled are not delivered later.
- Confirm that the destination’s endpoint matches your Honeycomb team’s region:
https://api.honeycomb.iofor US orhttps://api.eu1.honeycomb.iofor EU. To check it, edit the destination and look at OTLP endpoint URL. - Confirm that the Ingest API key belongs to the environment you’re checking, and that the key can create datasets.
- Confirm that the destination’s Workspaces setting includes the workspace where your agent runs.
- Confirm that your application sends a
traceparentheader on its Claude API requests, and that the header’s sampled flag is “keep” (if thetraceparentends in-00, it means “drop”). - Confirm that your application and your Claude Platform destination send to the same Honeycomb environment.