

- generates a JSON object from user input
- parses that object
- validates its contents
- uses the content elsewhere in the application
- Do some user inputs result in higher latency or more errors?
- Was the JSON object structurally valid as per the JSON schema?
- Did the JSON object contain expected fields?
- Did the new version of our prompt result in more invalid JSON objects?
- Are there particular patterns in the user input that result in invalid JSON objects?
Before You Begin
Before instrumenting your LLM application, you’ll need to do a few things:- Create a Honeycomb Account. Signup is free!
- Create a Honeycomb Team. Complete your account creation by giving us a team name. Honeycomb uses teams to organize groups of users, grant them access to data, and create a shared work history in Honeycomb.
- Get Your Honeycomb API Key. To send data to Honeycomb, you’ll need your Honeycomb API Key. Once you create your team, you will be able to view or copy your API key. Make note of it; you will need it later! You can also find your Honeycomb API Key any time in your Environment Settings.
Send Telemetry Data to Honeycomb
Once you have your Honeycomb API key and your LLM application to instrument, it’s time to send telemetry data to Honeycomb! To instrument your LLM, you will add automatic instrumentation to your code for standard trace data telemetry, and then add custom instrumentation specifically for your LLM.Add Automatic Instrumentation to Your Code
The quickest way to start seeing your trace data in Honeycomb is to use OpenTelemetry, an open-source collection of tools, APIs, and SDKs, to automatically inject instrumentation code into your application without requiring explicit changes to your codebase.Automatic instrumentation works slightly differently within each language, but the general idea is that it attaches hooks into popular tools and frameworks and “watches” for certain functions to be called.
When they’re called, the instrumentation automatically starts and completes trace spans on behalf of your application.
- JavaScript
- Python
- Java
- .NET
- Go
- Ruby
- Other
This Quick Start uses the
npm dependency manager.
For instructions with yarn or if using TypeScript, read our OpenTelemetry Node.js documentation.Acquire Dependencies
Open your terminal, navigate to the location of your project on your drive, and install OpenTelemetry’s automatic instrumentation meta package and OpenTelemetry’s Node.js SDK package:Alternatively, install individual instrumentation packages.If using TypeScript, install
ts-node to run the code:Initialize
Create an initialization file, commonly known as thetracing.js file:Configure the OpenTelemetry SDK
Create anotelconfig.yaml file with the following content:If you are using the EU instance, replace
https://api.honeycomb.io with https://api.eu1.honeycomb.io in the configuration file.When
OTEL_CONFIG_FILE is set, the configuration file is the single source of truth for the SDK. Other OTEL_* environment variables are ignored by design, so set all SDK options in the YAML file. You can still reference environment variables from inside the YAML using ${VAR_NAME} substitution.The OpenTelemetry declarative configuration is stable at the specification level. Individual fields still under active development are marked with a
/development suffix in the YAML (see configuration versioning). Check the language support status for per-SDK maturity.If you use Honeycomb Classic, you must also specify the Dataset using the
x-honeycomb-dataset header.If you are sending data directly to Honeycomb, you must configure the API key and service name.
If you are using an OpenTelemetry Collector, configure your API key at the Collector level instead.
Run Your Application
Point the SDK at your configuration file using theOTEL_CONFIG_FILE environment variable, then run the Node.js app with the initialization file:YOUR_APPLICATION_NAME with the name of your application’s main file.Alternatively, you can import the initialization file as the first step in your application lifecycle.In Honeycomb’s UI, you should now see your application’s incoming requests and outgoing HTTP calls generate traces.Generate Automated Data
Now that you have added automatic instrumentation to your application and have it running in your development environment, interact with your application by making a few requests. Making requests to your service will generate telemetry data and send it to Honeycomb where it will appear in the Honeycomb UI within seconds.Add Custom Instrumentation for LLMs
With OpenTelemetry’s automatic instrumentation now installed in your application, trace data is being sent to Honeycomb. The next step is to add custom instrumentation that tracks all relevant information related to your LLM feature. In OpenTelemetry, custom instrumentation is called manual instrumentation. To get the most out of your traces, you must use OpenTelemetry APIs to instrument. To add custom instrumentation, create a single span that tracks all relevant information related to your LLM feature. Specifically, the minimum information to track must include:- User ID
- Prompt version
- User input
- Full prompt text
- Full LLM response
- Any error including parsing JSON and/or validating it
- Error message
- Token count
Examples
The following code examples show how to capture the correct information on an OpenTelemetry span:Explore Your Data
With your app running and telemetry being sent to Honeycomb, it’s time to explore your data.Create a Board
For quick reference over time, you should create a Board to show LLM-specific queries of interest. We recommend creating a Board first before trying queries, so you can save with ease later. To create a Board:- In the Honeycomb UI’s left navigation menu, select Boards ()n. When the left navigation menu is compact, only the icon appears.
- Select New Board.
- In the modal that appears, name your new board, such as “LLM Dashboard.” Optionally, give your Board a description to help others find and use it. Determine the board’s Sharing setting - Public to the Team or Limited to Collaborators.
- Select Create to finish. Your new board appears next.
Next Steps
- Select Add Query to go to the Query Builder display.
- Use the example queries in the next section to populate your LLM Board.
- Follow the directions to add queries to an existing Board.
Create Queries
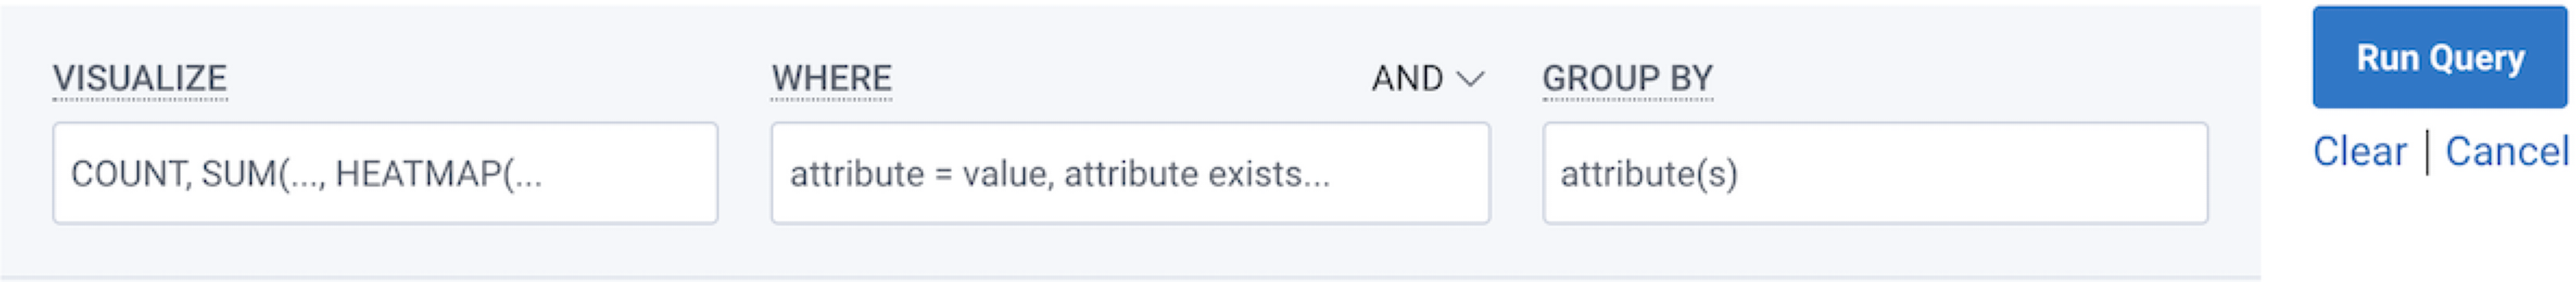
Now it’s time to create your first queries for LLMs! Use the query examples below to explore the performance and behavior of your LLM application. The specific attributes should exist in your data and environment if you added custom instrumentation for LLMs in the previous step. Enter each example query using the Query Builder. These example queries use two to three of theVISUALIZE, WHERE, and GROUP BY clauses, located at the top of the Query Builder.
VISUALIZE- Performs a calculation and displays a corresponding graph over time. MostVISUALIZEqueries return a line graph while theHEATMAPvisualization shows the distribution of data over timeWHERE- Filters based on attribute parameter(s)GROUP BY- Groups fields by attribute parameter(s)
Track Overall Latency
This query tracks overall latency of all LLM-related operations and the slowest requests.
Use to identify any spikes in latency, or if latency is increasing over time.
In the event of a spike, you can investigate what happened by using BubbleUp to find outliers.
Track Invalid JSON Objects
This query shows each instance that a user input led to a bad JSON object, whether that was because of a parsing error or a validation error.
Use to identify exactly which inputs lead to bad behavior, which makes it easier to identify specific bugs to solve.
Track all User Inputs Grouped by Response and Errors
This query shows groups of all inputs and LLM outputs that succeeded.
Use to understand general user behavior, and to identify any patterns in user input that leads to a particularly useful response.
It’s just as helpful to understand what’s working as it is to understand what isn’t.
Show Token Usage Over Time
This query tracks token use over time, grouped by user ID.
Use to understand how many tokens being used over time, but also to identify that usage down to specific users, as often a small number of users is responsible for the majority of usage.
Investigate Specific Traces
The queries on our LLM Board act as a starting point. If curious about specific behavior, you can view a specific trace that represents one request. Select any point on a graph, and in the menu that appears, select View trace. The next screen displays a trace detail view that lets you see what happened step by step.Next Steps
The queries on our LLM board act as a referenceable starting point. If you’re curious about specific behavior(s), start with any query and:- Add additional fields in the GROUP BY clause to slice your data into revealing interesting field values.
- Use BubbleUp to find outlier behavior and identify its contributing characteristics.
- Select a specific trace that represents one request to see what happened step-by-step.