

Interact with Traces
The trace detail view displays information in four areas:- trace identification with navigation and trace ID
- trace summary with trace metadata
- waterfall representation of spans with search and customization options
- trace sidebar with details about the selected span
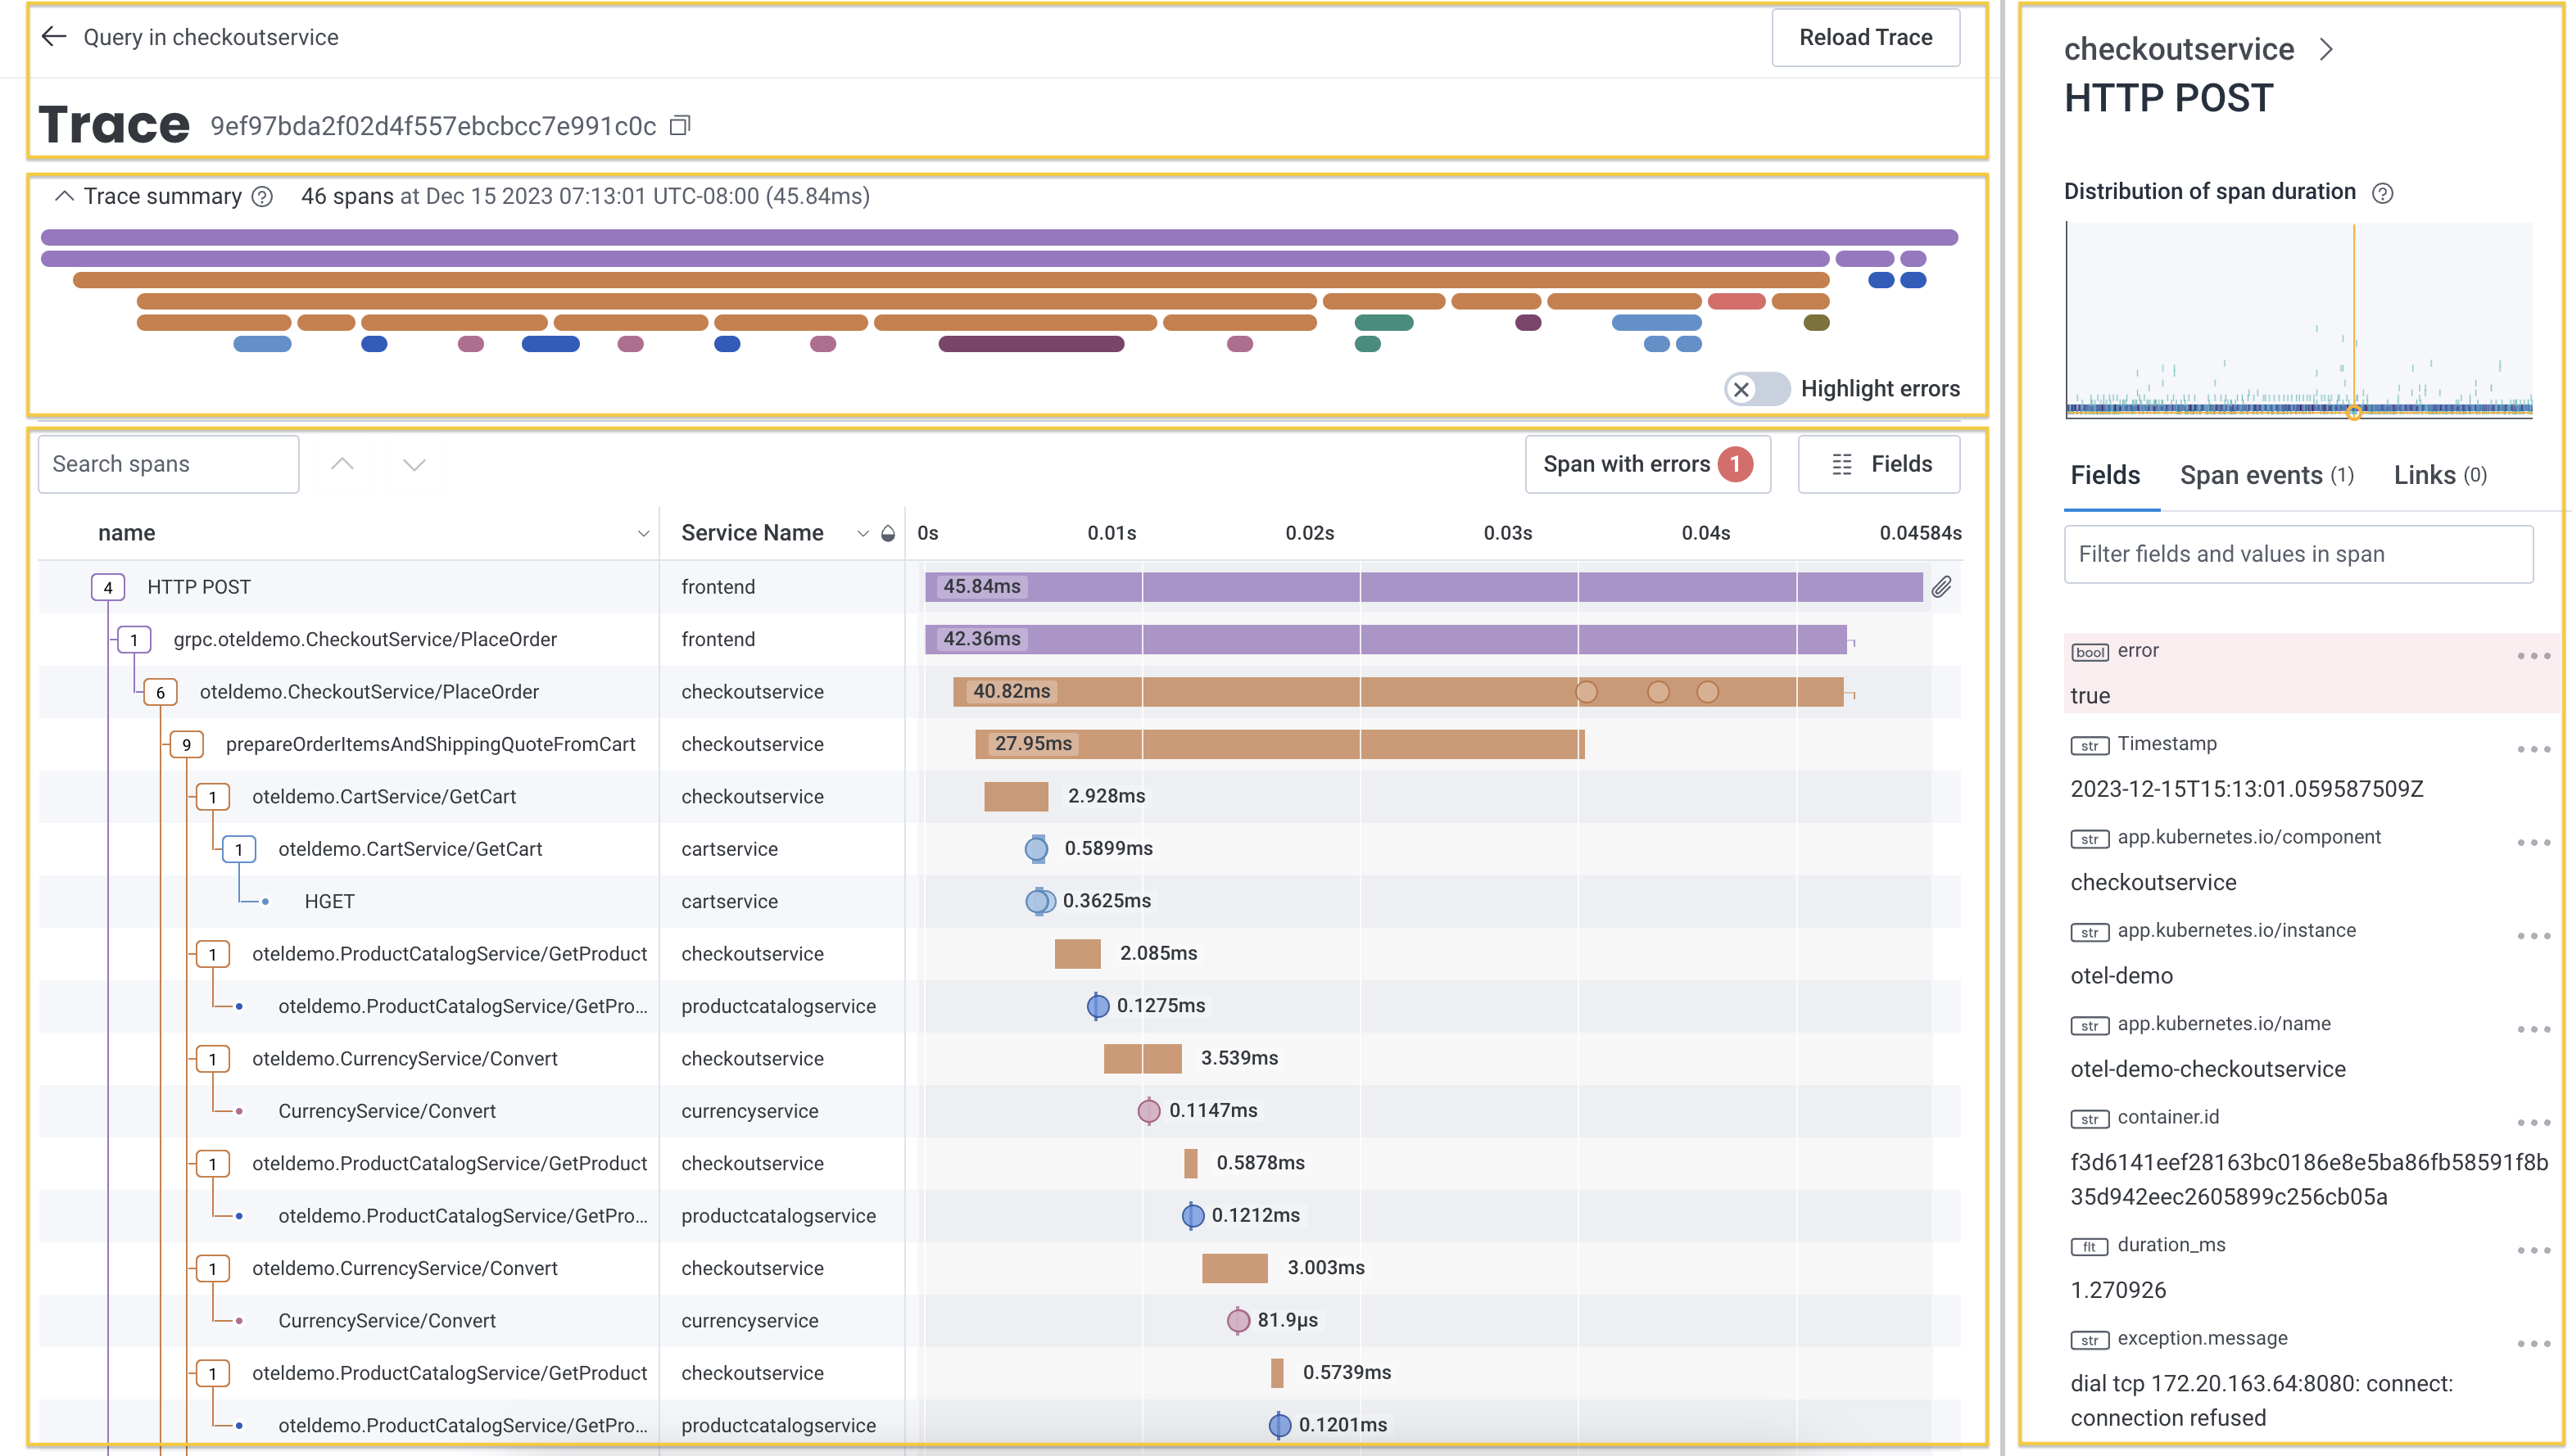
Trace Identification
Each trace has a unique identifier presented at the top of page along side navigation elements.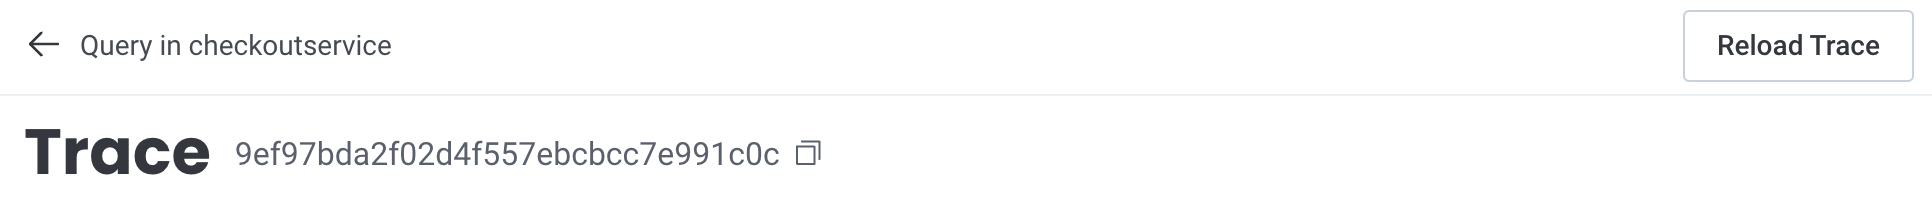

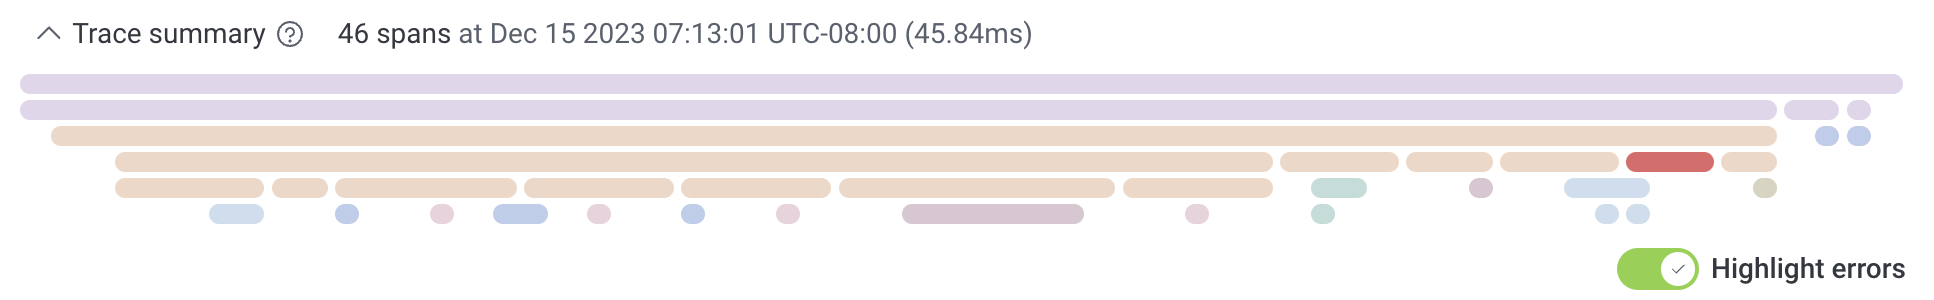
Trace Summary
The trace summary displays important metadata and provides a condensed view of the trace waterfall diagram. Metadata about the trace includes its total number of spans, the timestamp of the root span, and the total trace duration. Use this view to find long-running spans and spans with errors within your trace without scrolling through the entire trace waterfall. Expand or collapse the summary view by selecting the directional caret.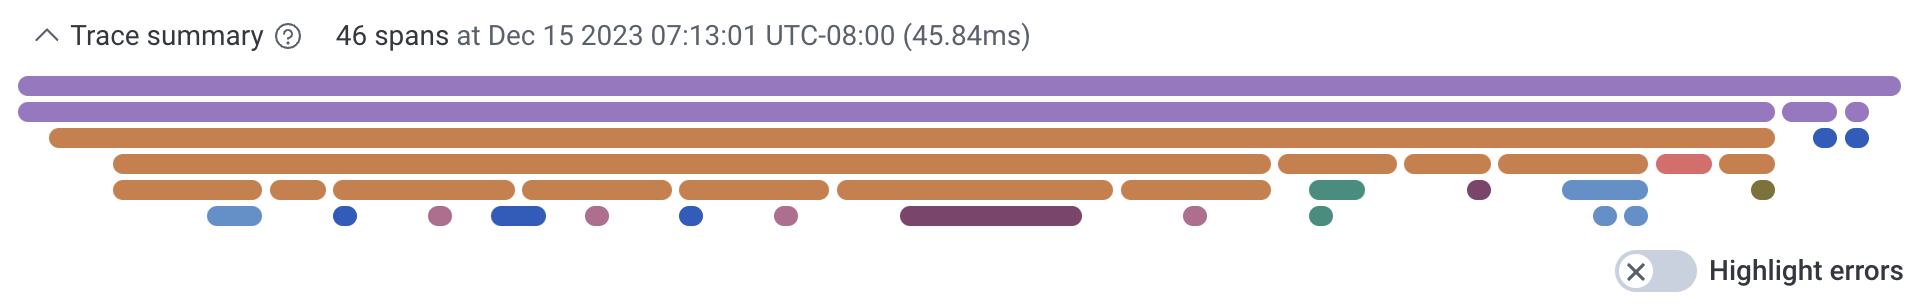
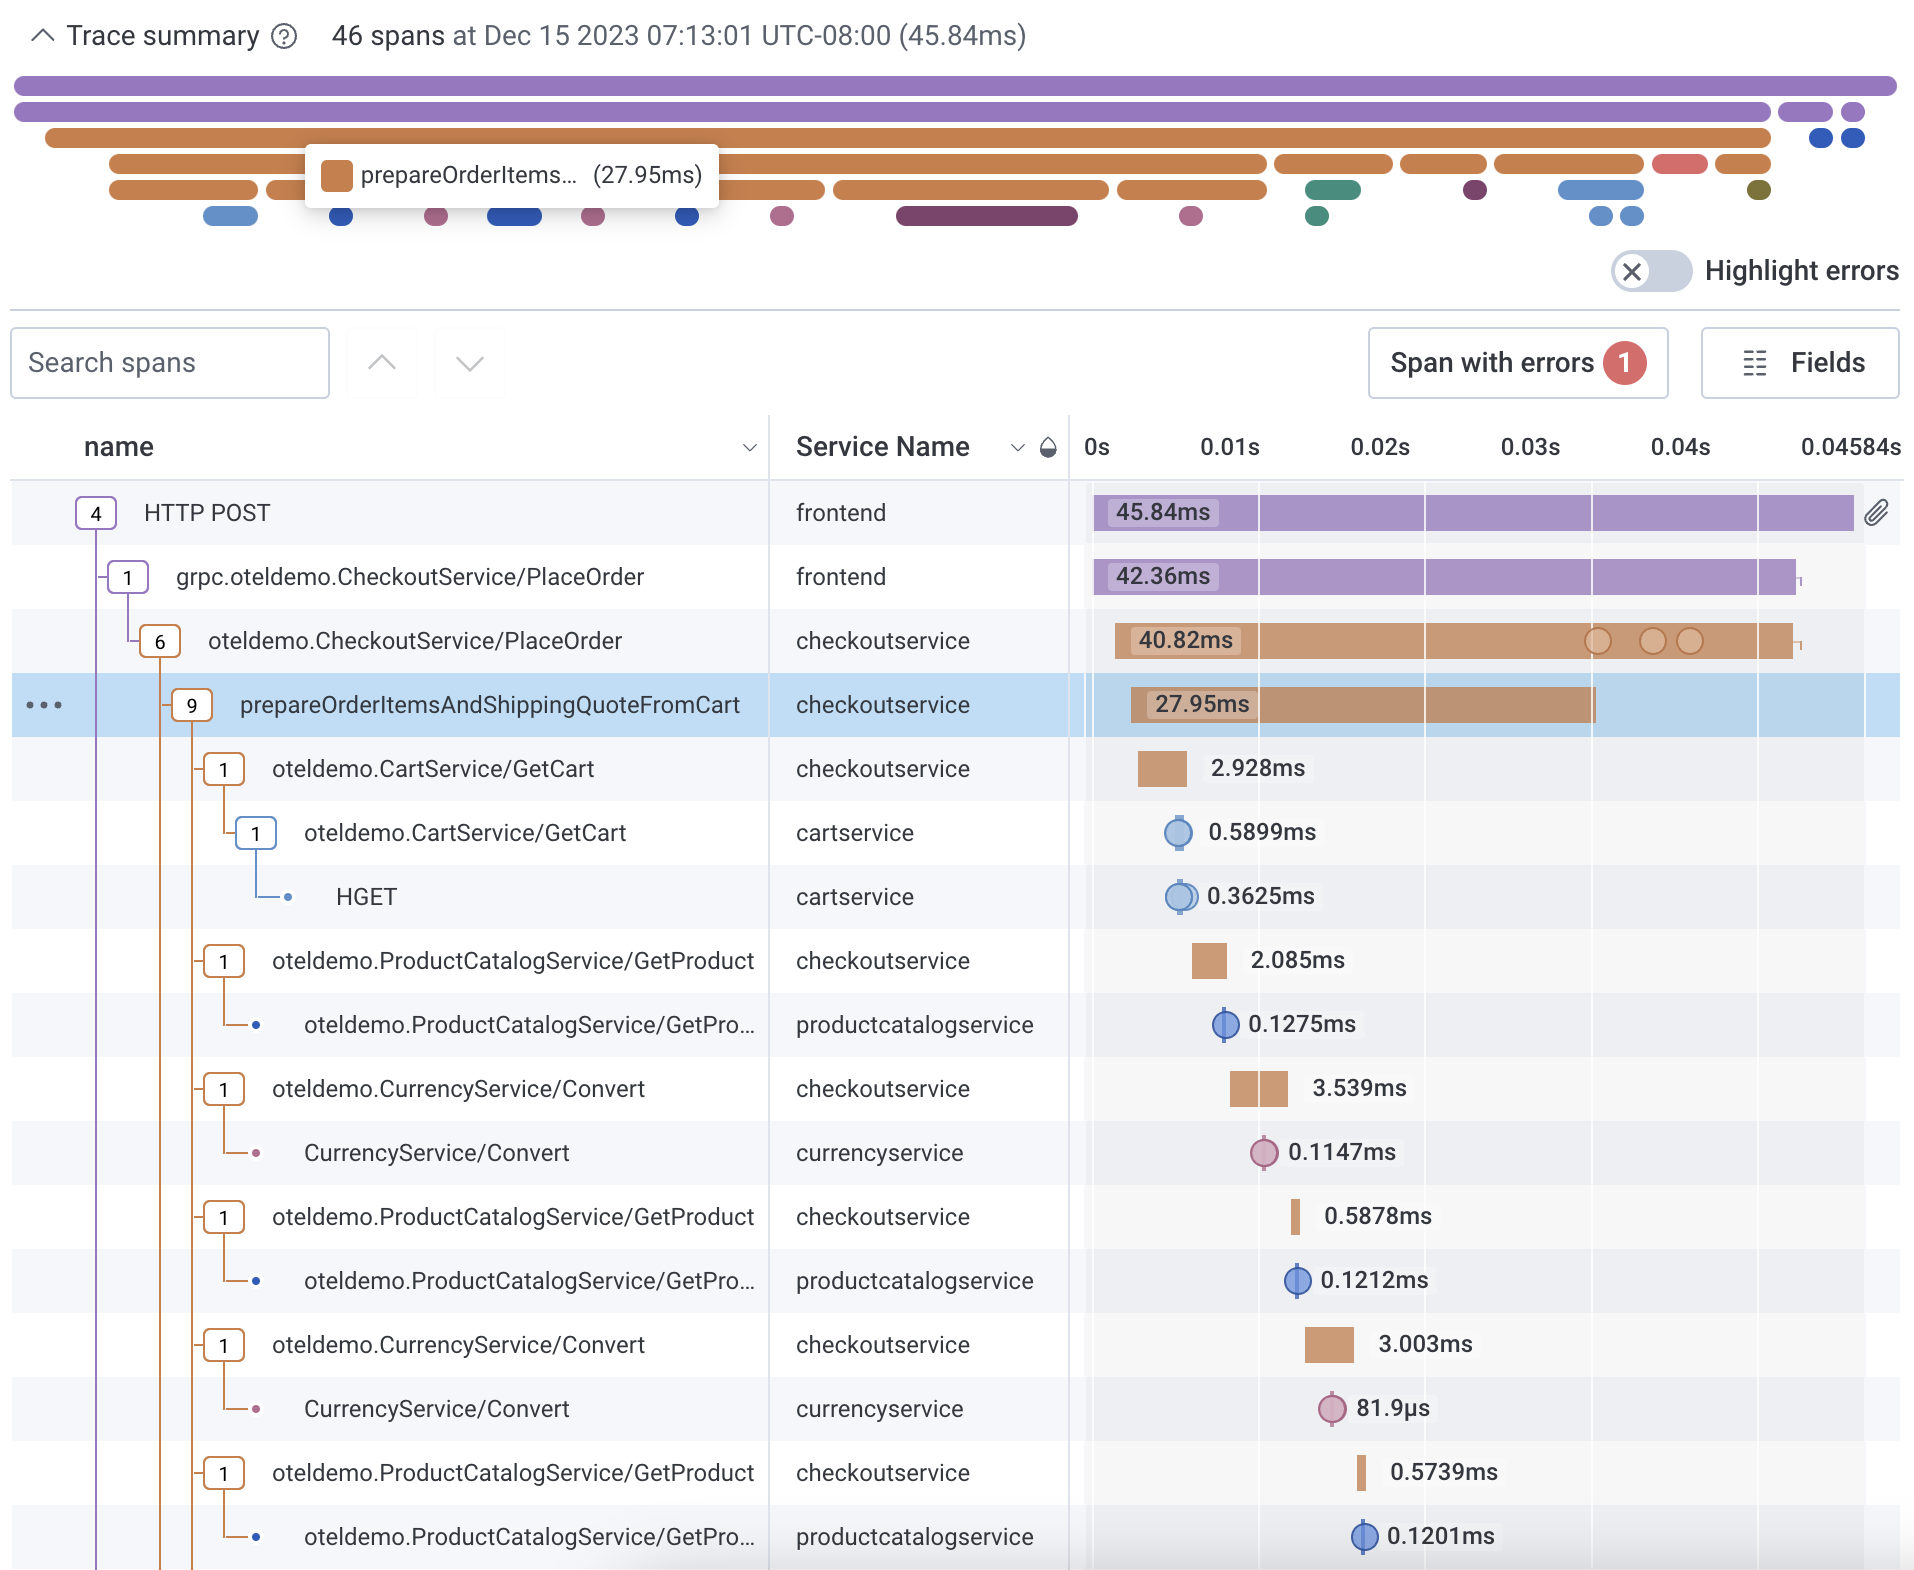
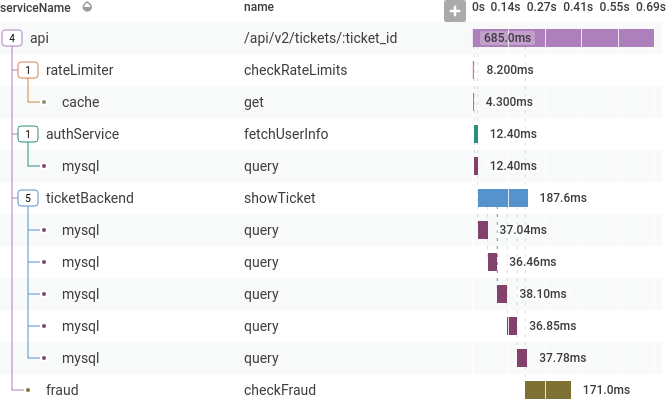
Waterfall Representation
Honeycomb uses the metadata from each span to reconstruct the relationships between them and generate a trace diagram. This is also called a waterfall diagram because it shows how the order of operations cascades across the total execution time.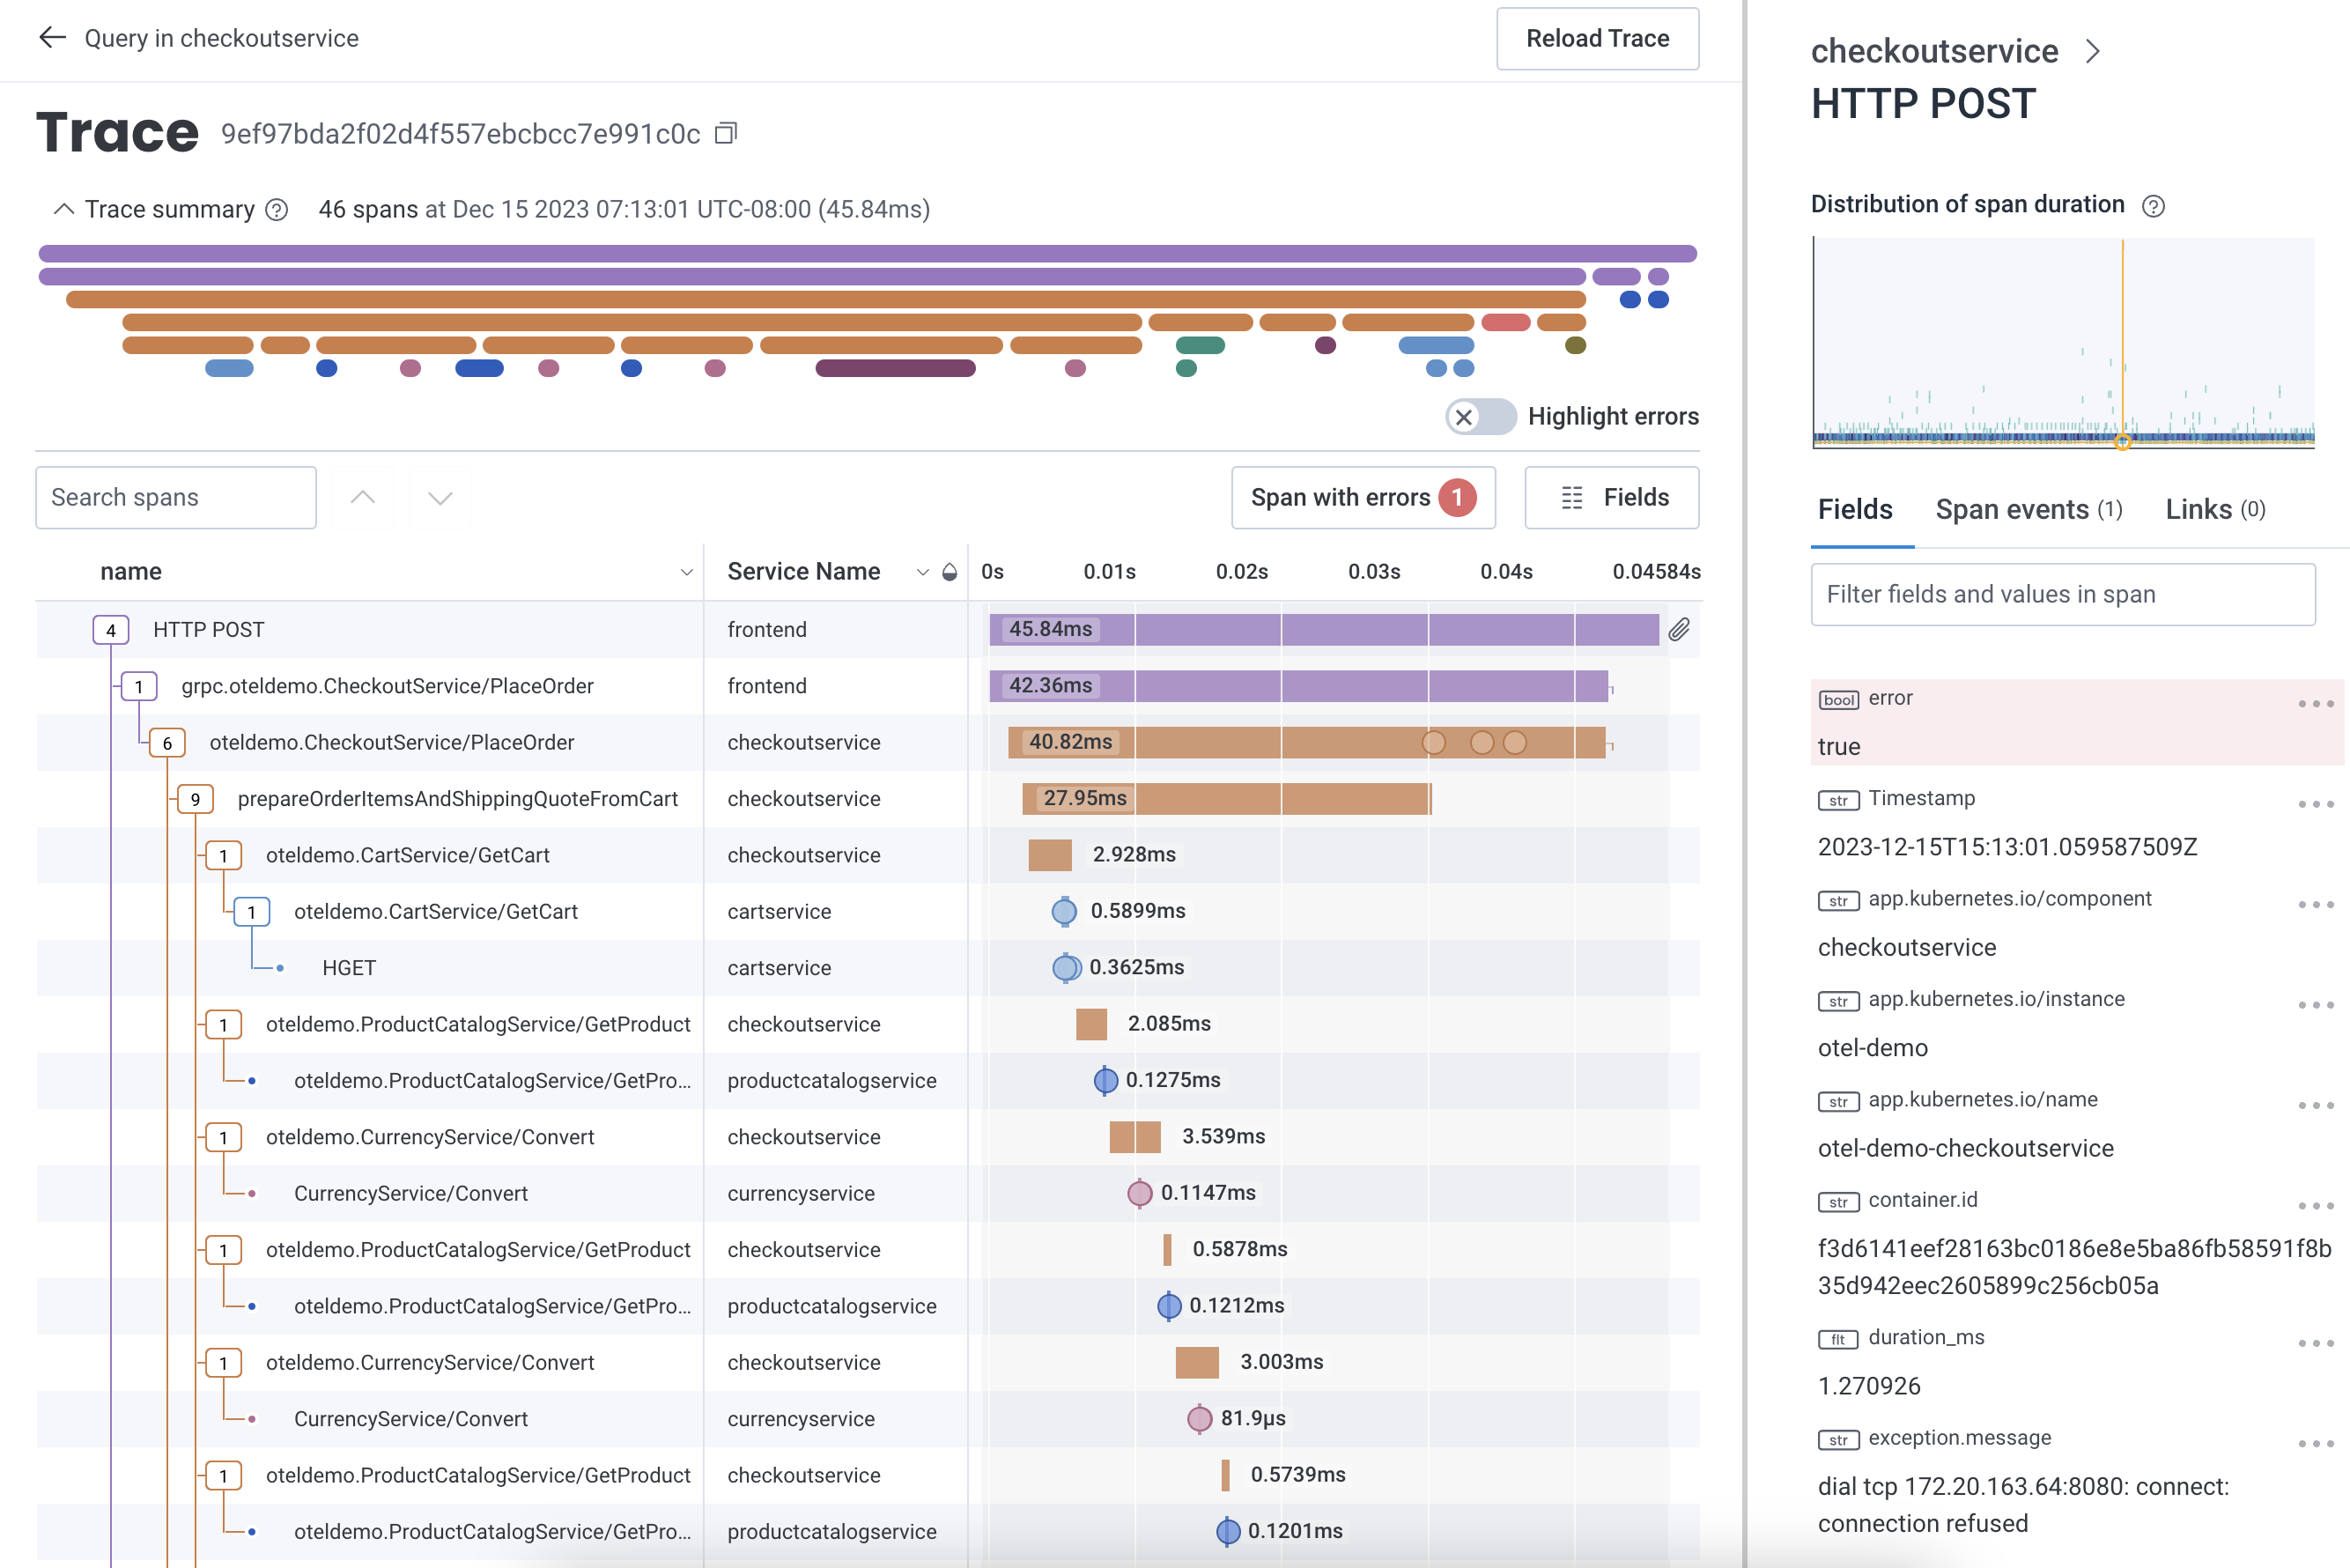
Trace Sidebar
When a span is selected, the trace sidebar updates with details about the span, including its fields, span events, and links. The Span Events tab of the trace sidebar displays details about span events, if applicable. To access, navigate to the Span Events tab and select the Span Event name to show its details. Alternatively, in the waterfall diagram, select the circle that represents a span event to display the span event’s details in the trace sidebar’s Span Events tab. The Links tab of the trace sidebar displays details about span links, if applicable. To access, navigate to the Links tab to view span link details. Alternatively, in the waterfall diagram, select the link icon that represents a span link to display details in the trace sidebar’s Links tab.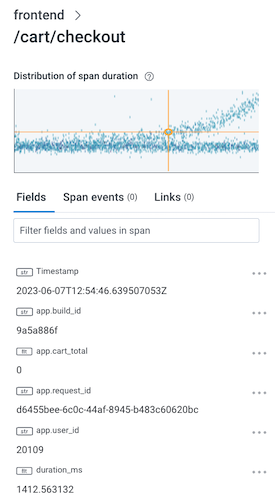
The Minigraph
The minigraph, at the top of the trace sidebar, shows a heatmap view of the selected span relative to others with the same fields displayed in the waterfall. Selecting anywhere in the minigraph sends you to the Query Builder display with a query that corresponds to the minigraph.Tasks
- Reload trace
- Search for spans that contains a field or value name
- Expand or collapse trace summary
- Collapse and expand Spans
- Zoom in on Spans
- Navigate between highlighted Errors
- Customize Waterfall Representation
- Customize Displayed Fields
- Resize Columns
- Change Span Color
- Filter results in Trace Sidebar
- Refine search based on field and return to Query Builder