This feature is available as an add-on for the Honeycomb Enterprise plan.
Please contact your Honeycomb account team for details.
Benchmarking Setup
For our benchmarking setup we have two agents running on a GCP n2-standard-2 Compute Engine instance, which has 2 vCPUs and 8GB of memory. One agent will be the test agent that we will be applying processors to. The other agent will be acting as our destination. It is configured with an OTLP Source and custom destination to log the output of the data it receives. For the log generation tests static JSON logs were generated at a rate of 1000 logs per second, across 10 files. This roughly equates to 140MiB of logs per minute. The log source is the Filelog source with JSON parsing configured. For metric generation the Host Metrics source was used with the default configuration.Control Runs
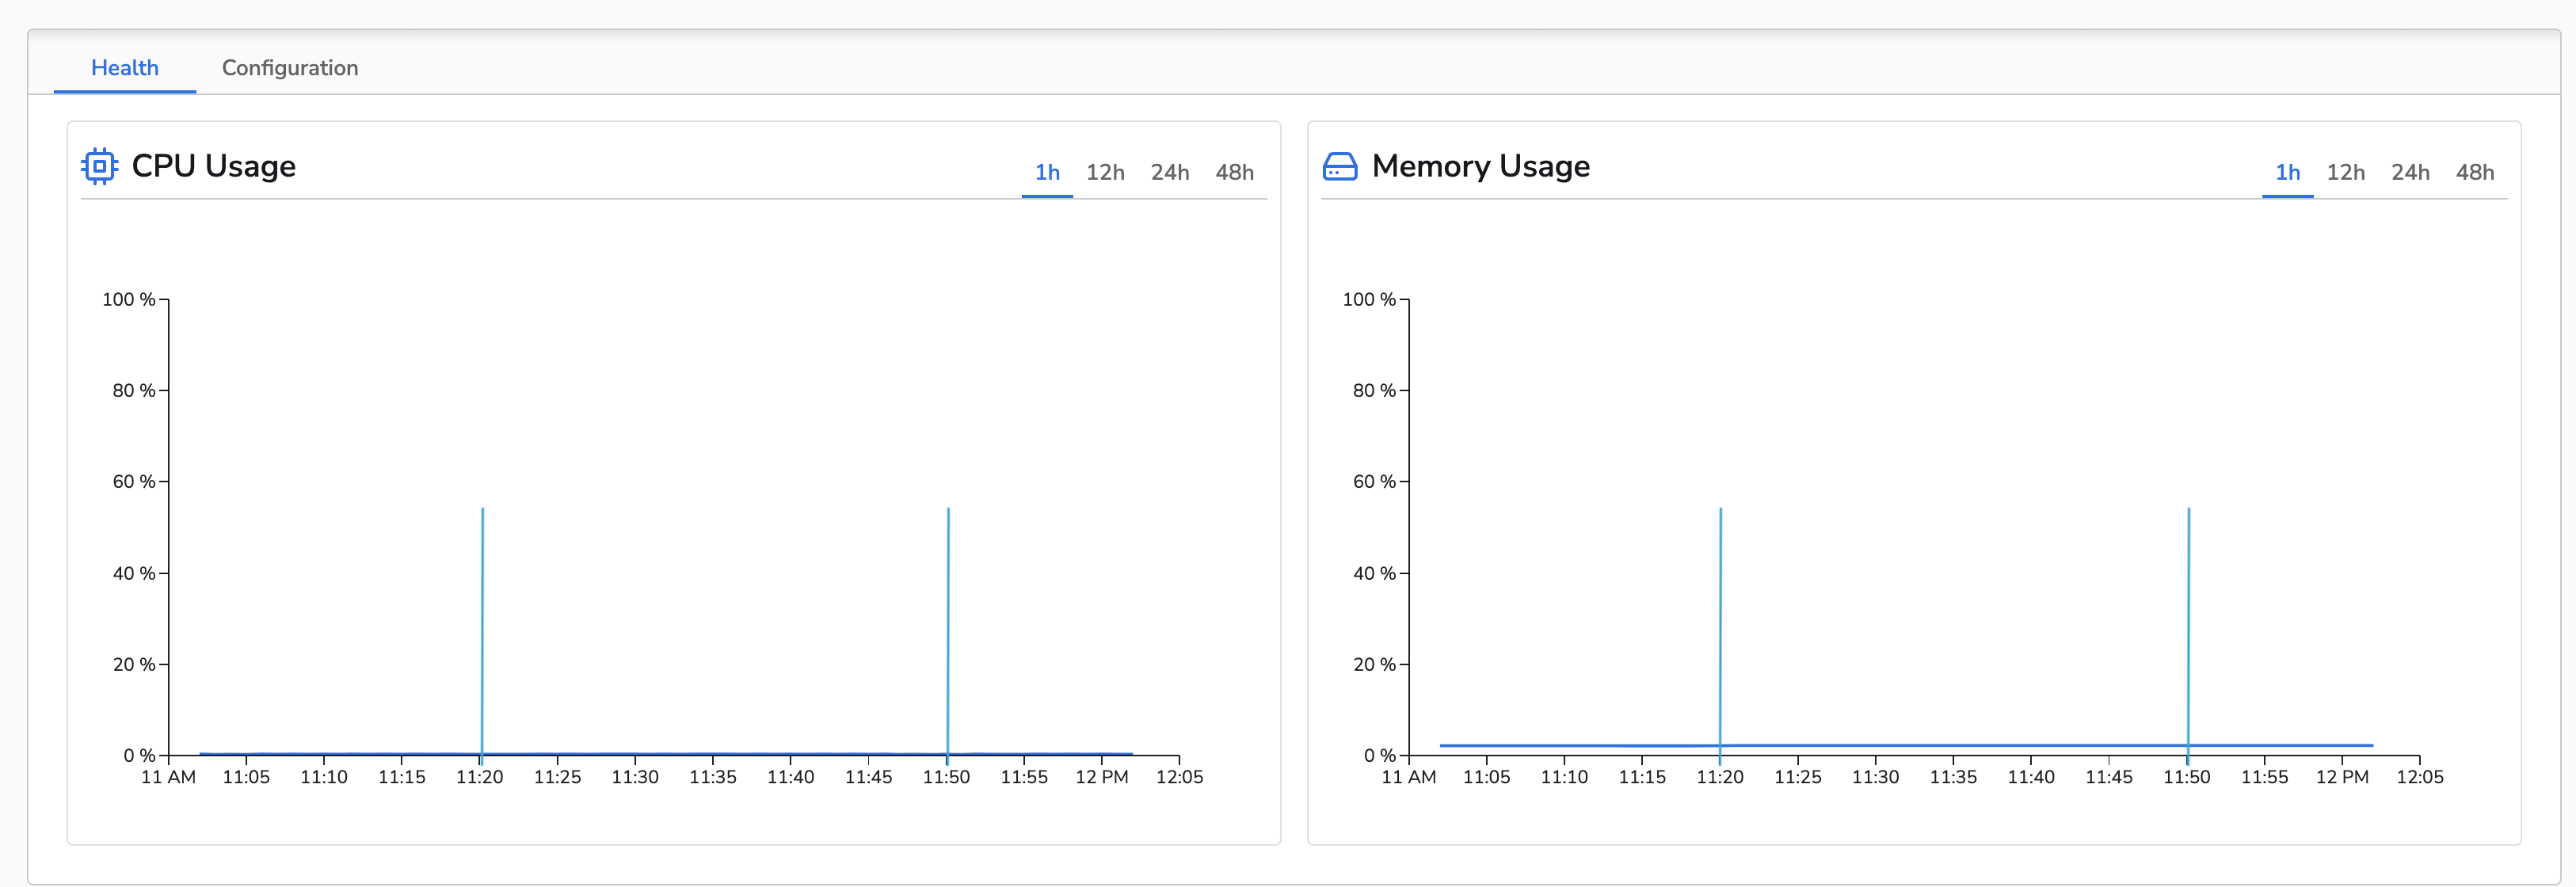
A one hour control run was done for both the log and metric generation tests. This was to establish a baseline for the agent’s performance without any processors applied.Logs Control
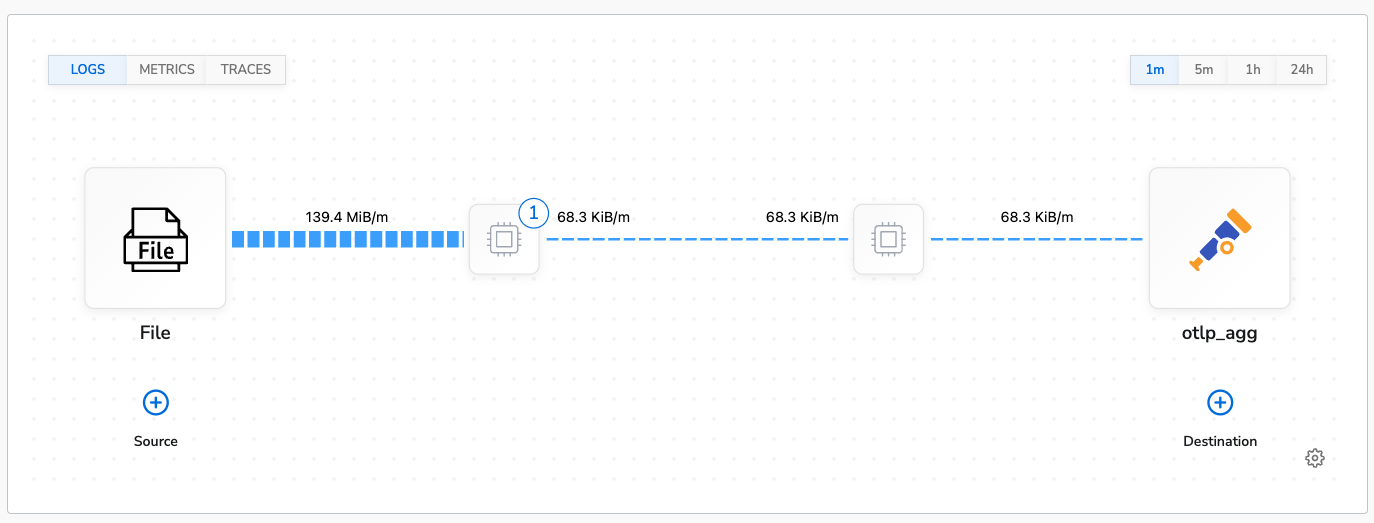
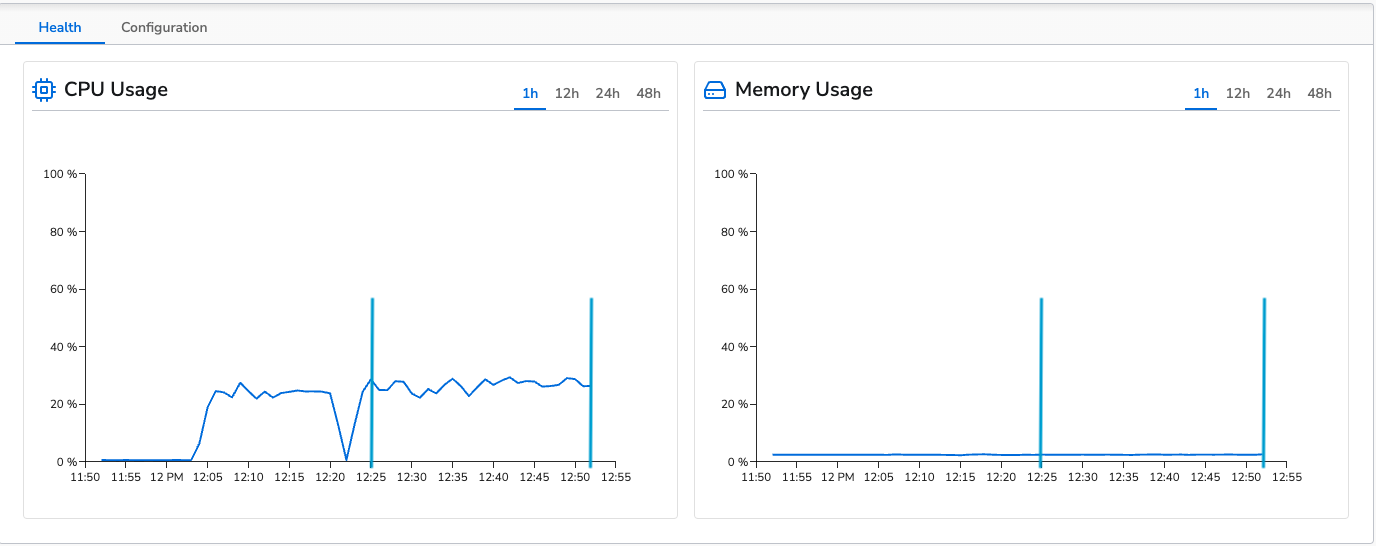
The control run for logs was conducted collecting from 10 log files with logs generating at 1000 logs per second to each file. This results in a throughput of ~140MiB/m. The agent’s average CPU usage was 27% and average memory usage was 2.8% (~230MB). This is the topology view of the control configuration: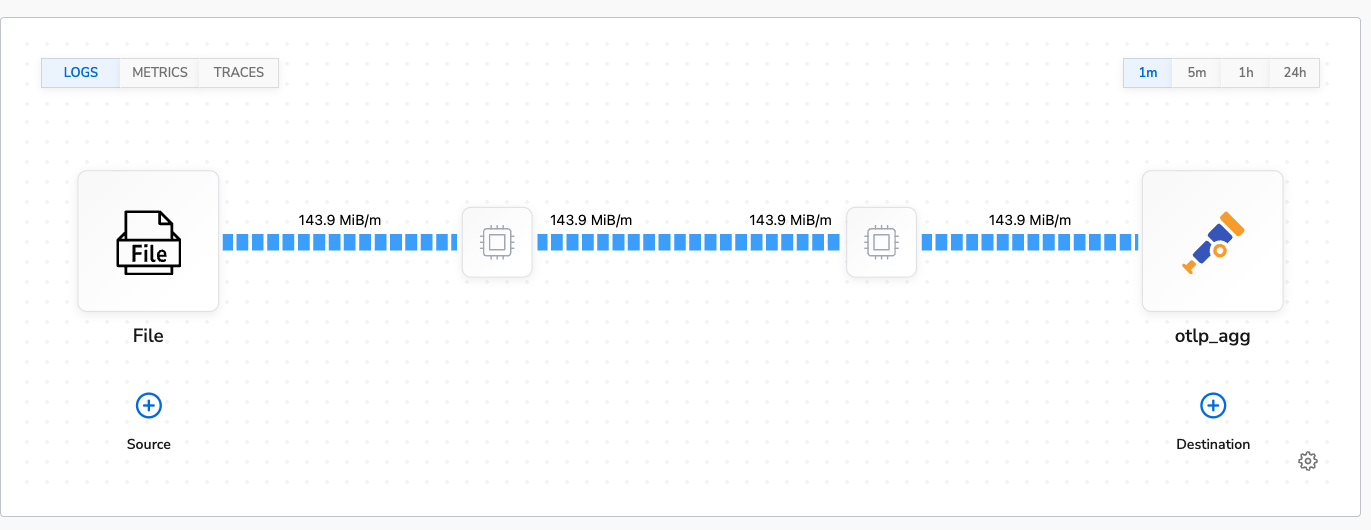
Metrics Control
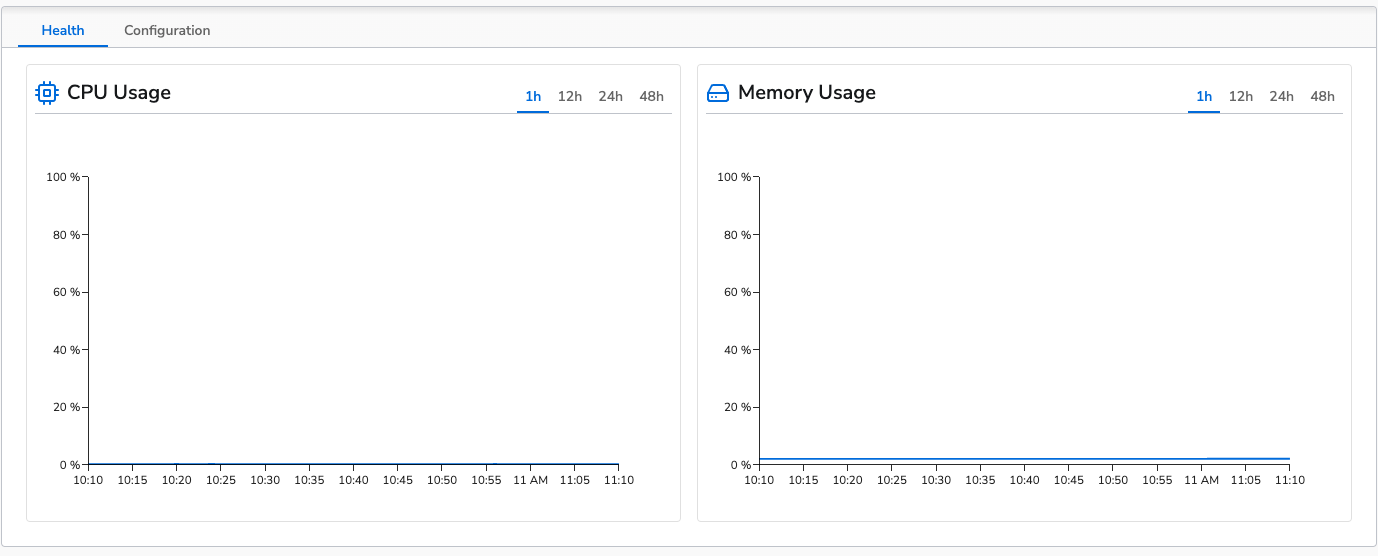
The control run for metrics had a data throughput of ~99KiB/m. The agent’s average CPU usage was 0.2% and average memory usage was 2.1% (~16MB). This is the topology view of the control configuration: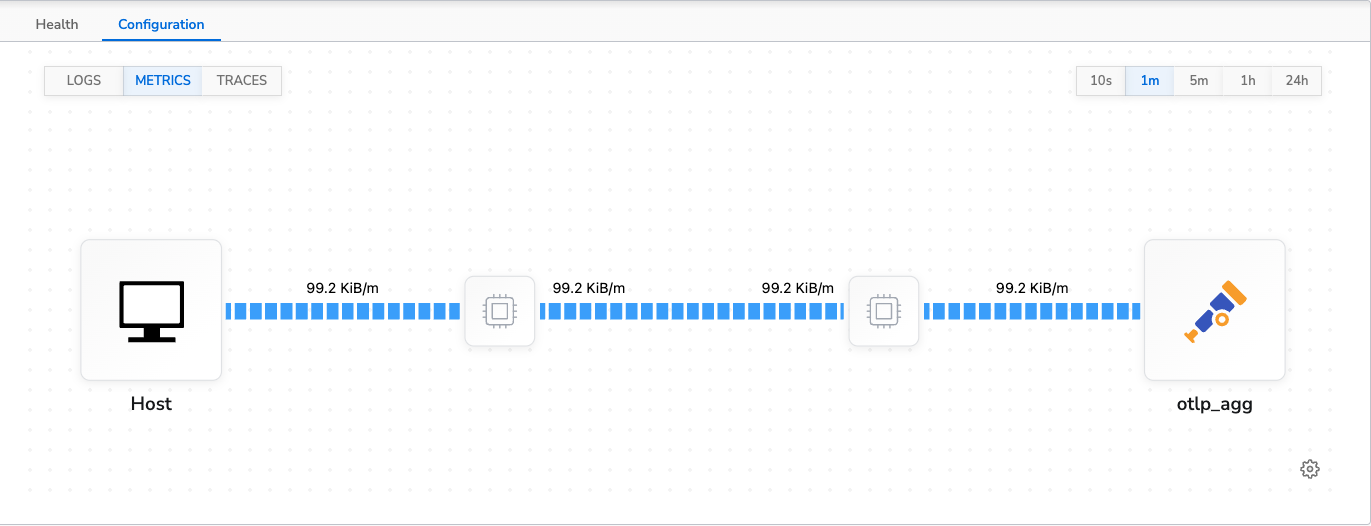
Deduplicating Logs
Deduplicating logs is a common data reduction use case for logs. It can help reduce the number of redundant logs that are sent to a destination. For our tests we used the Deduplicate Logs processor to deduplicate logs. The processor is configured to deduplicate logs excluding the timestamp andlog.file.name attributes.
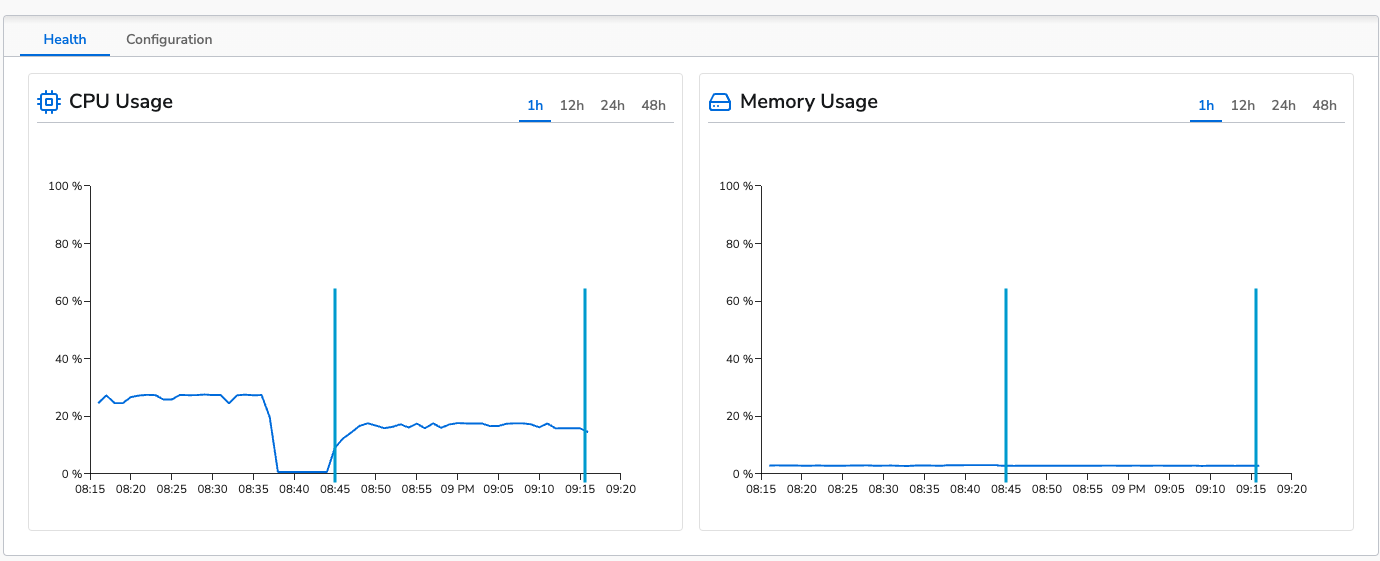
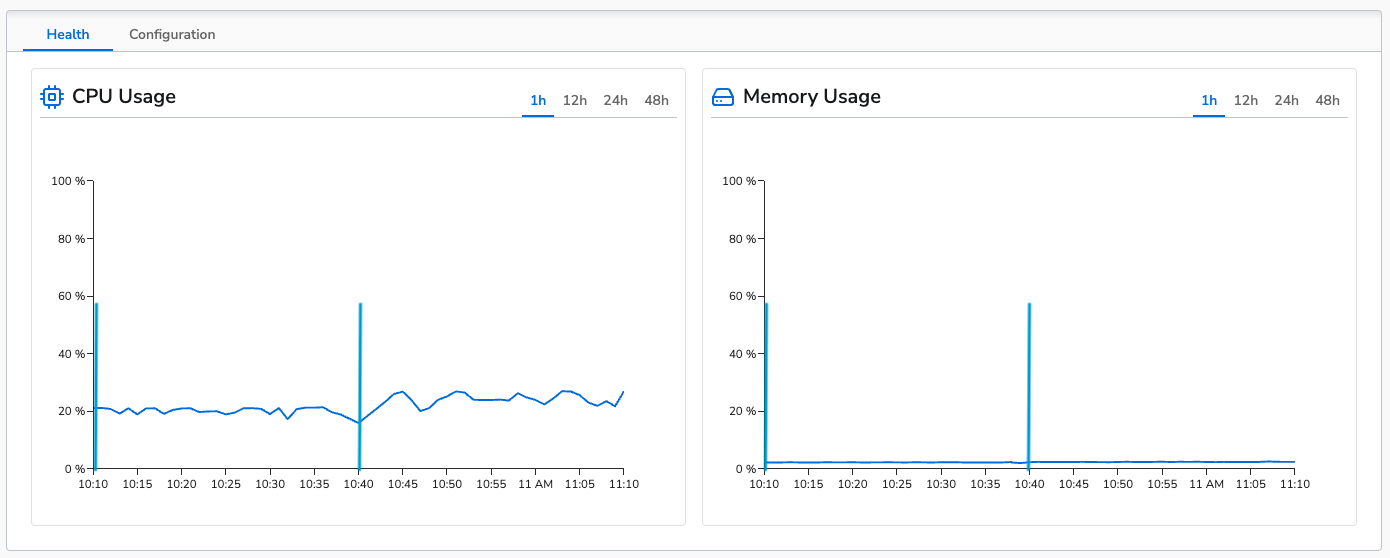
The benchmark was run for 30 minutes. The agent’s average CPU usage was 16% and average memory usage was 2.8% (~230MB). This is actually lower than the control run. This is due to the fact that the logs are being deduplicated and the agent is processing less data.
This is the topology view of the benchmark configuration:
Benchmark Conclusion
The above images show that apply a log deduplication processor does not negatively impact the agent’s performance. It actually reduces CPU usage as it reduces the amount of data the agent has to process.Converting Logs to Metrics
Converting logs to metrics is a great way to reduce cost and data ingestion of logs if you just want to see some metric based off of the logs. For this benchmark we will be solving the use case of wanting to know the number of logs for each severity and discard the logs themselves. We will use the Count Telemetry processor to count the number of info, warning, and error logs. We will use the Filter by Field processor to filter out the logs and only send the metrics. Here is the order in which the processors are applied: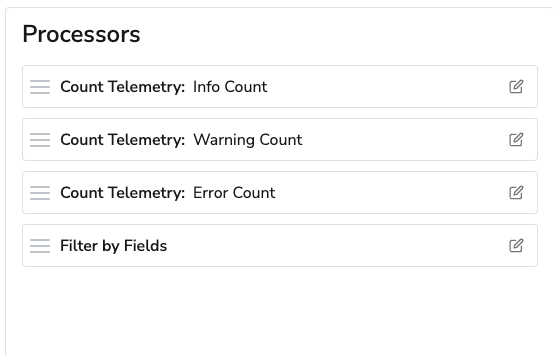
Benchmark Conclusion
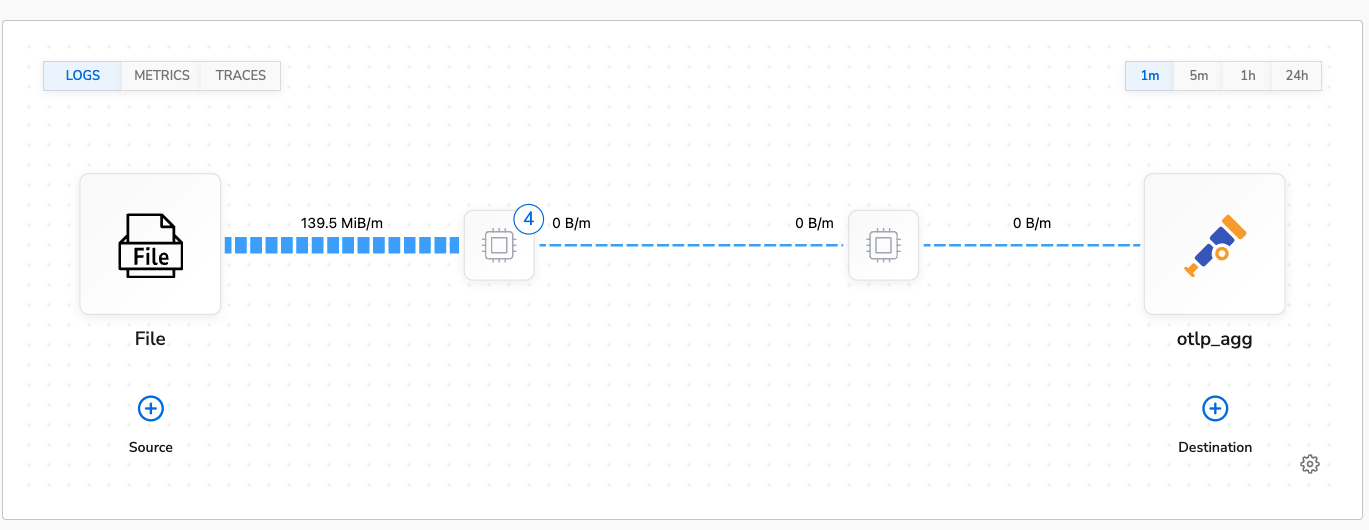
The above images show that apply even with four processors in use it does not negatively impact the agent’s performance. Both CPU and memory usage are lower than the control run.Lookup Fields
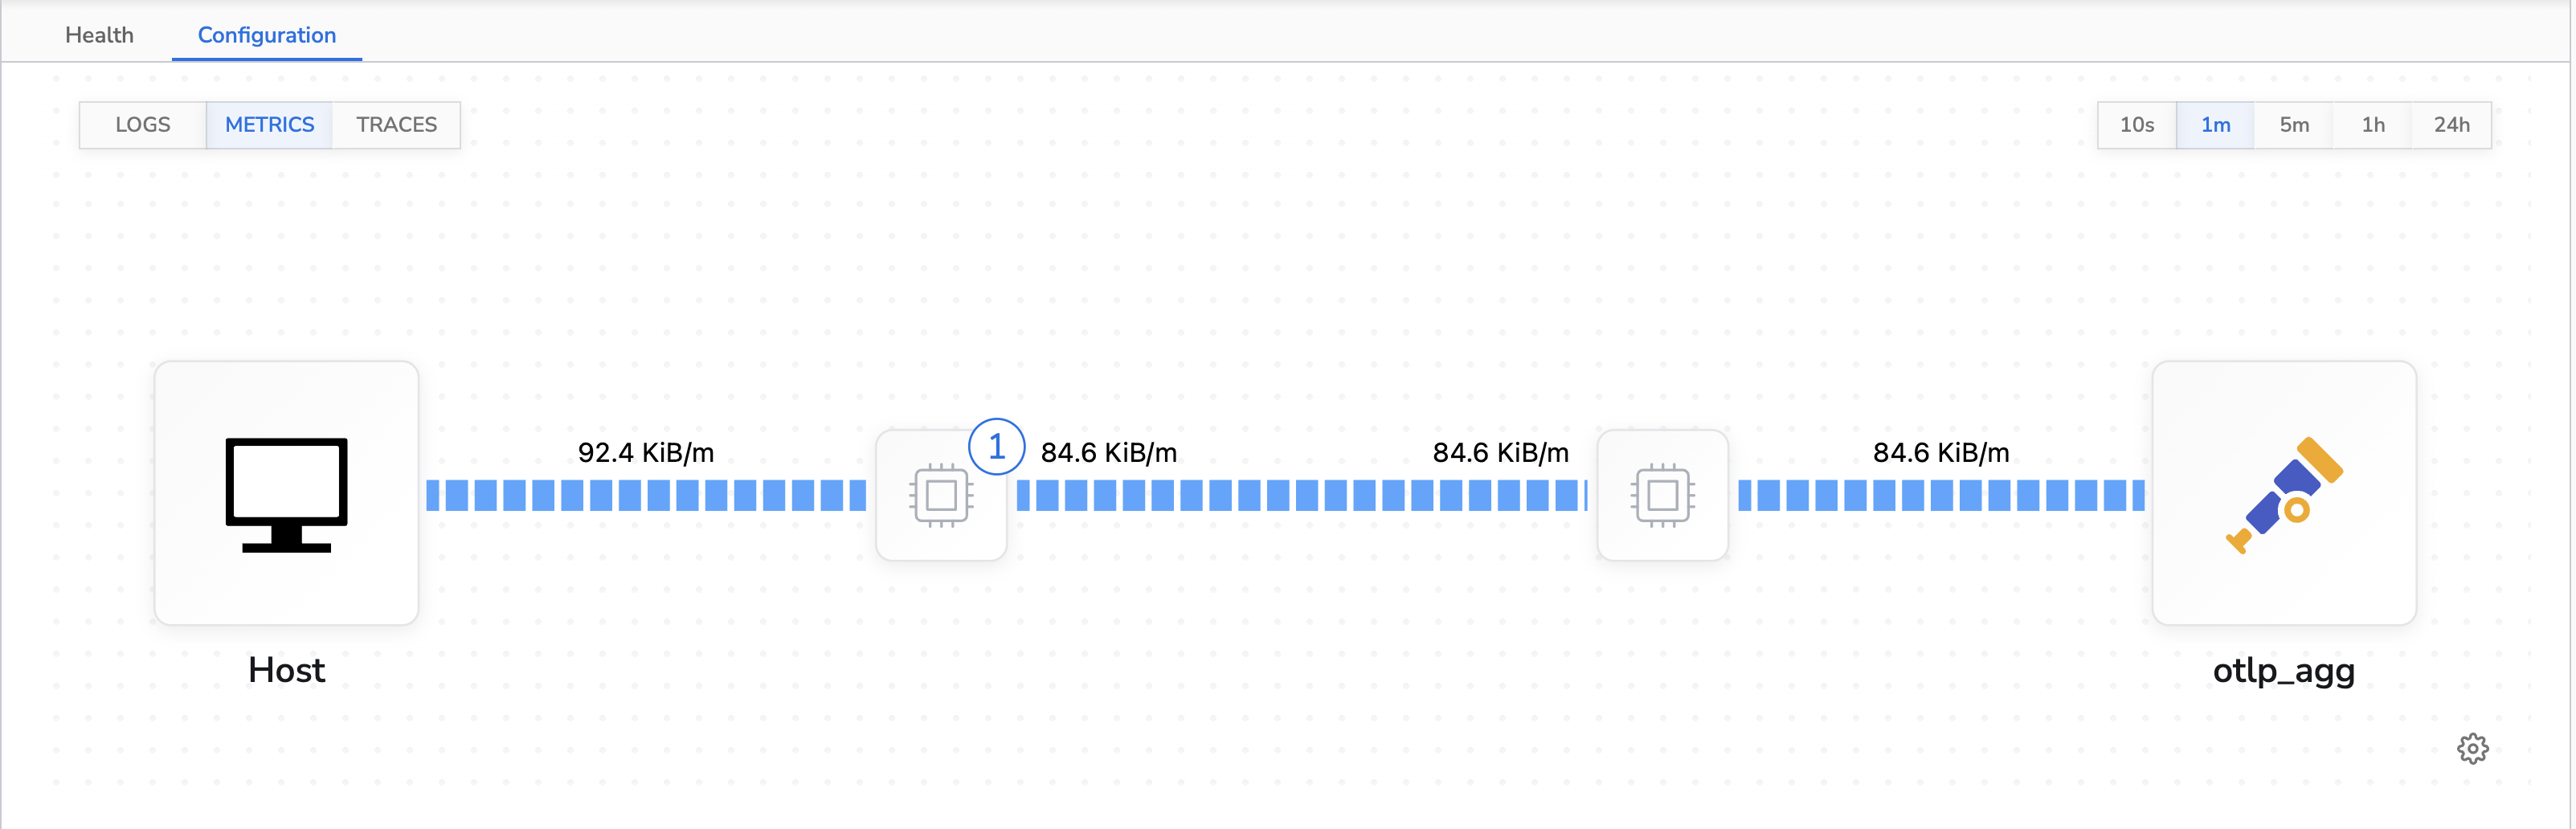
The Lookup Fields processor allows adding additional fields to telemetry based on existing fields. This can be useful for adding additional context before sending to a destination. This benchmark we add an additional field to the logs based on theenv field in the body.
The benchmark was run for 30 minutes. The agent’s average CPU usage was 25% and average memory usage was 2.5% (~205MB). This is fairly close to the control run.
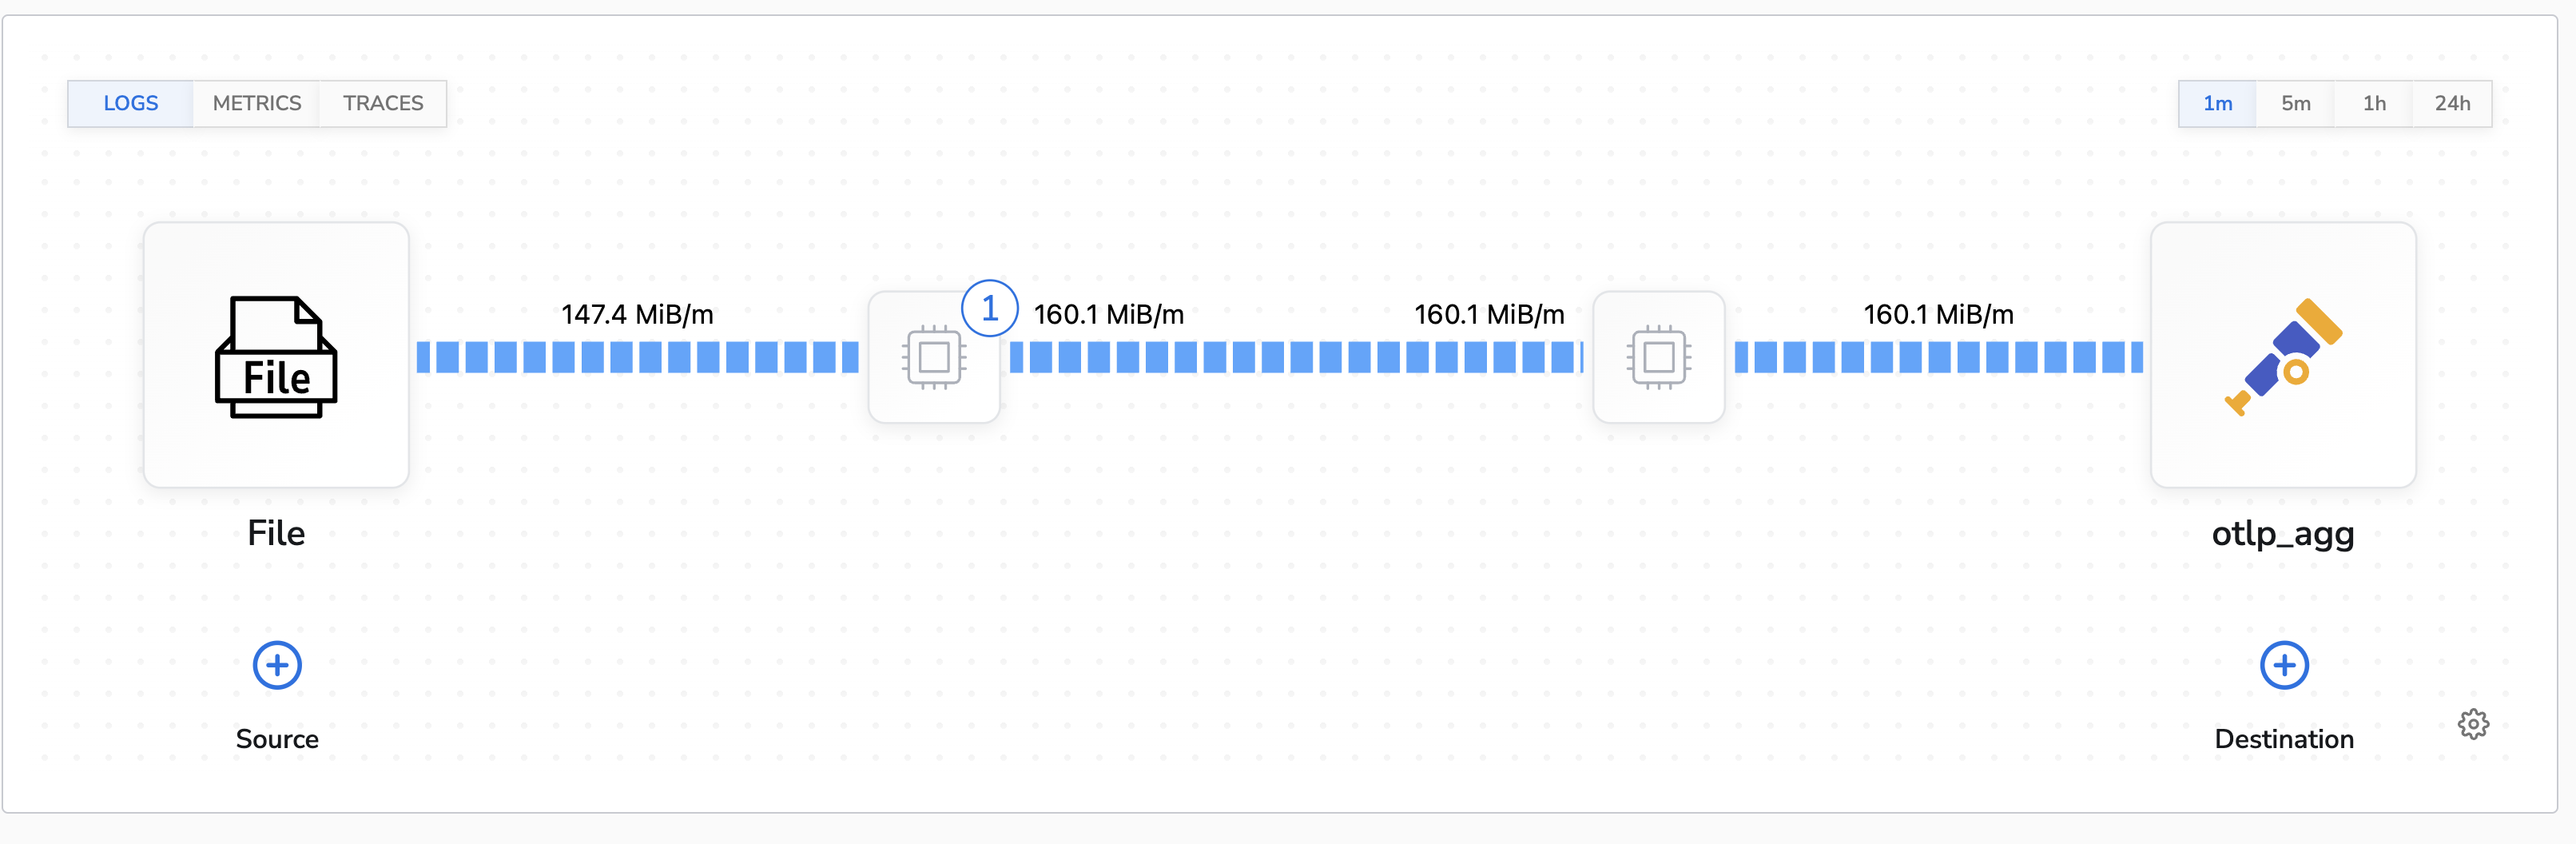
This is the topology view of the benchmark configuration:
Benchmark Conclusion
The results are fairly close to the control run. We don’t see a performance improvement like the previous runs as we are adding a small amount of metadata to the logs rather than reducing overall throughput.Delete Fields
The Delete Fields processor allows removing fields from telemetry. This can be useful for removing extraneous or sensitive data from telemetry before sending it to a destination. This benchmark was run against both logs and metrics deleting fields from both.Logs
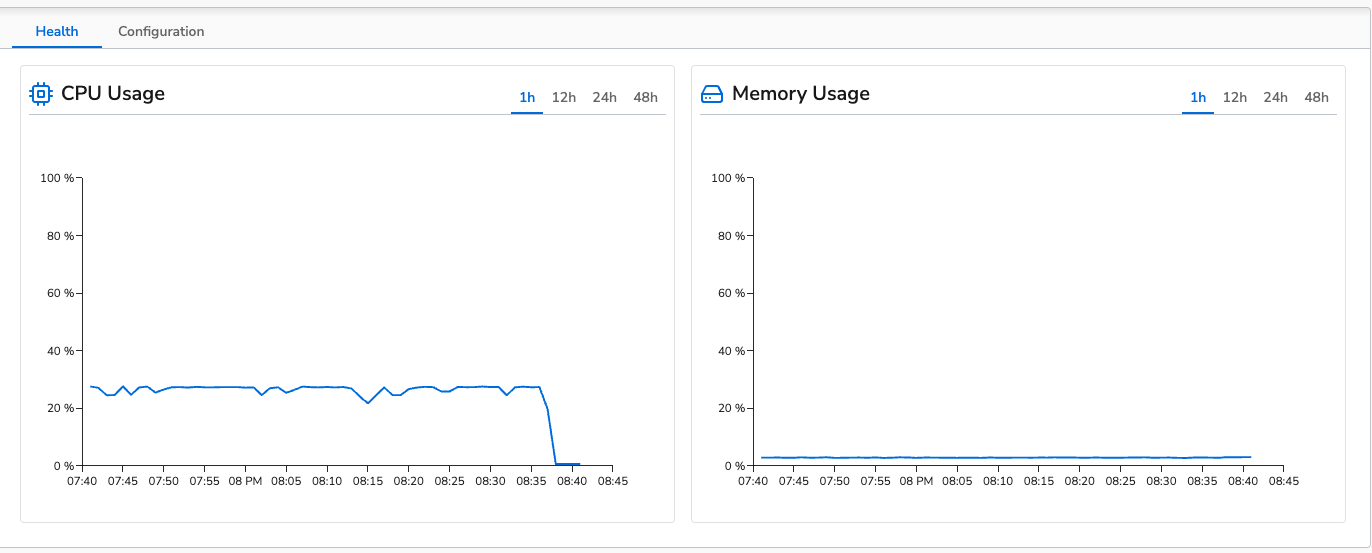
The benchmark was run for 30 minutes. The agent’s average CPU usage was 24% and average memory usage was 2.4% (~196MB). This is fairly close to the control run. This is the topology view of the benchmark configuration: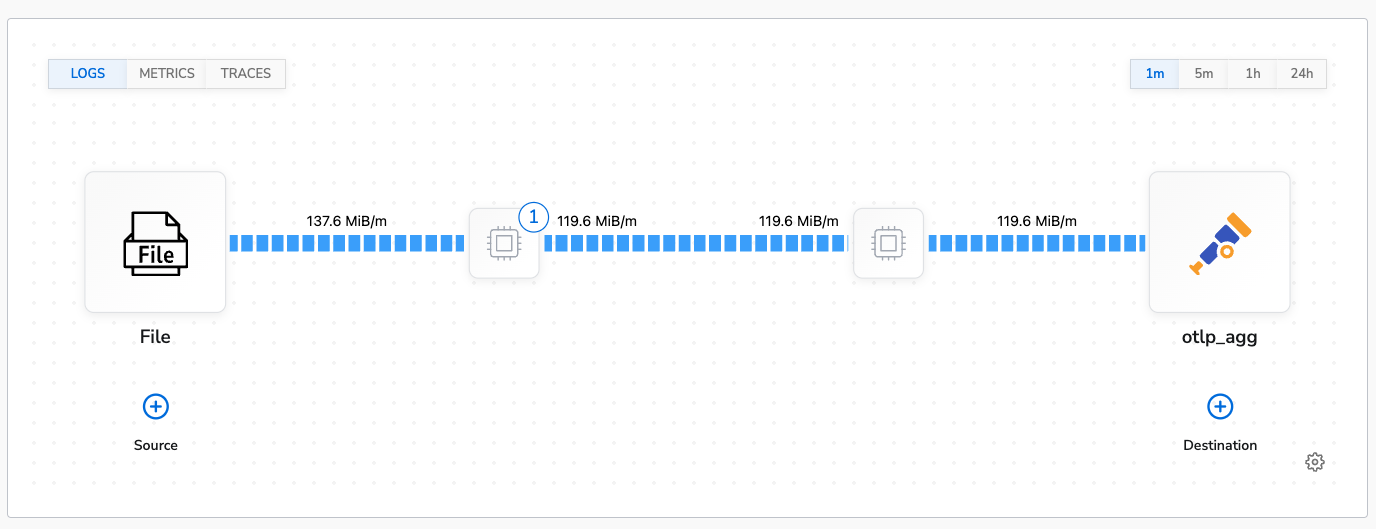
Benchmark Conclusion
The results are fairly close to the control run with using slightly less CPU and memory as the logs are slightly smaller due to the fields being removed.Metrics
The benchmark was run for 30 minutes. The agent’s average CPU usage was 0.2% and average memory usage was 2.1% (~172MB). This is identical to the metrics control run. This is the topology view of the benchmark configuration: