

What is the Board Detail page?
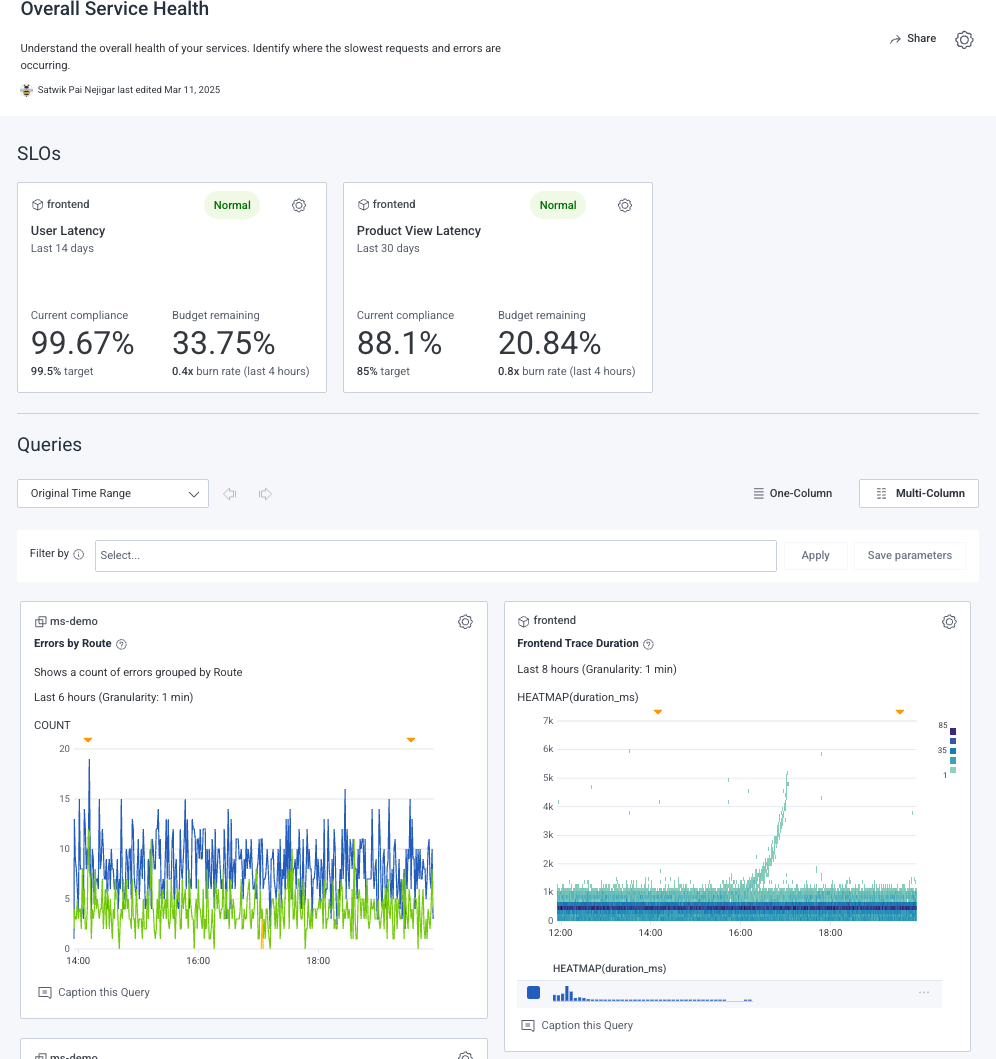
The Board Detail page provides a focused view of a single Board, including its associated queries and Service Level Objectives (SLOs). Use this page to review key information, analyze data, and manage settings for an individual Board.Layout and Components
The Board Detail page is divided into these sections:- Board Details and Actions: Displays key information about the Board and provides management options.
- SLOs: Shows Service Level Objectives (SLOs) added to the Board, along with their current status and compliance metrics.
- Queries: Shows queries added to the Board, allowing you to explore and customize data analysis.
Board Details and Actions
This section provides key information about the Board and tools to manage it. Use this section to keep your board organized and up to date.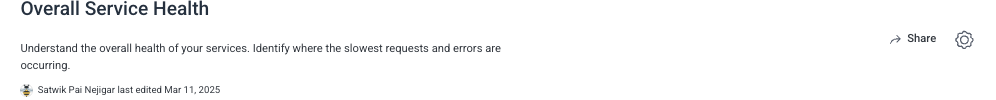
Board Details
This section provides essential information about the Board, including:- Board name: Assigned title of the Board.
- Board description: Brief explanation of the Board’s purpose or contents.
- Last edited by and date: Name of the last person who modified the Board and when.
- Tags: Key:value pairs assigned to the Board. Valid on Flexible Boards only.
Board Actions
Manage your Board using these options:- Share (): Share the Board and manage collaborator access.
- Manage Board settings (): Access key actions:
- Add query: Attach a new or existing query.
- Add SLO: Attach a new or existing Service Level Objective (SLO).
- Duplicate: Create a copy of the Board.
- Delete board: Permanently remove the Board.
SLOs Section
If at least one Service Level Objective (SLO) has been added to the Board, then the SLOs section appears. The SLOs section contains panels, each of which displays compliance and performance metrics for a single SLO.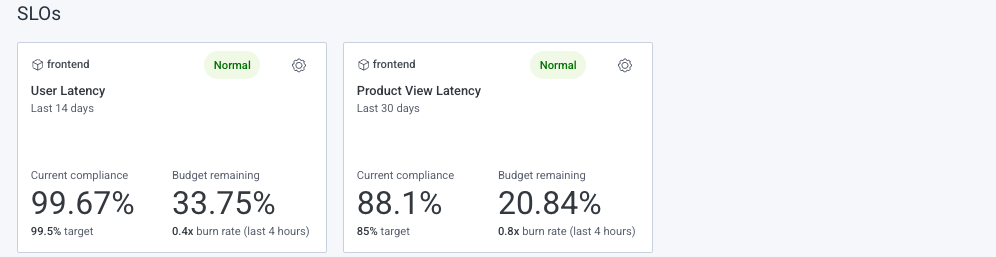
SLO Panel
Each Service Level Objective (SLO) panel represents an individual SLO. It displays the SLO’s details and setting options.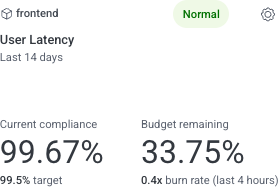
SLO Details
Each Service Level Objective (SLO) panel includes:-
Applicable dataset: Dataset associated with the SLO, including its name and an associated type icon. Icon options include:
-
Status indicator: Indicator that reflects the SLO’s current state. Options include:
- Name: Title of the SLO.
- Time period: Timeframe over which compliance is measured.
-
Performance metrics: Metric summaries, including:
- Compliance summary: Represents the overall percentage of requests that meet the defined SLO within the specified time period. Details include:
- Current compliance percentage: Proportion of requests meeting the defined SLO.
- Compliance target: Defined goal for compliance.
- Error budget summary: Represents the remaining allowable proportion of requests that can fail before the SLO is breached. Details include:
- Remaining budget percentage: Percentage of the error budget that is left.
- Burn rate and time period: Multiplier and time period indicating the rate at which the budget is being used.
- Compliance summary: Represents the overall percentage of requests that meet the defined SLO within the specified time period. Details include:
SLO Settings
Use Manage SLO settings () to manage your Service Level Objective (SLO). Options include:Queries Section
Because every Board requires at least one query, this section is always present. Use it to analyze data across different time ranges and customize query result displays.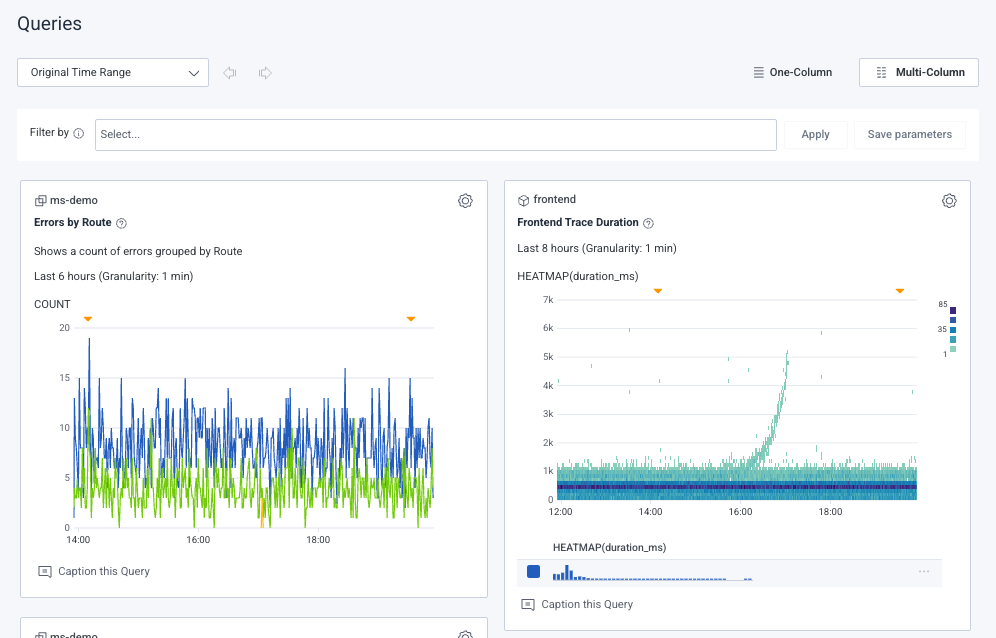
Section Controls
Adjust how query panels appear across the entire Queries section using these controls:- Time range & granularity:
- Original time range: Use the default time setting.
- Relative time ranges: Dynamically adjust the timeframe based on preset dynamic time ranges (for example,
Last 10 minutes,Last 2 hours,Last 28 days). - Custom time range: Manually select a specific timeframe.
- Granularity: Define how detailed the data points are.
- Time navigation:
- Previous time range: Step back to an earlier time window.
- Next time range: Advance to a later time window.
- Column layout:
- One-Column: Stack query panels vertically in a single column.
- Multi-Column: Display panels side by side, adjusting to the width of your browser window.
- Filters:
- Filter field: Enter text to filter queries.
- Apply: Apply selected filters to query results.
- Save Parameters: Save filters so they persist for all users of the Board.
Query Panel
Each query panel represents an individual query and displays its settings, details, and visualization.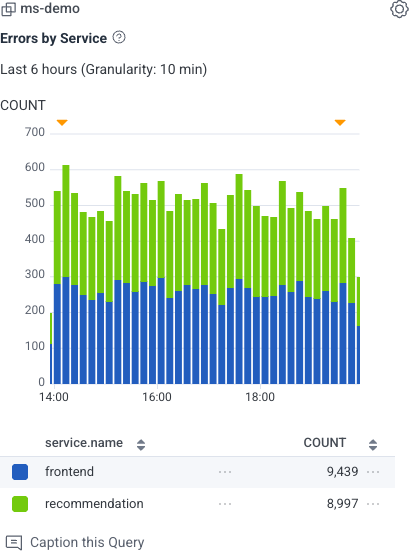
Query Details
Each query includes:-
Applicable dataset: Dataset from which the query retrieves data, including its name and an associated type icon. Icon options include:
- Name: Title of the query.
- Description: Brief summary of what the query does.
- Time range: Time period covered by the query.
- Granularity: Level of data aggregation.
-
Visualization preview:
- Graph: Visual representation of the data.
- Table: Structured, tabular view of the data. If using a heatmap visualization, the table contains a histogram.
Query Settings
Use Settings () to manage your query:-
Display settings: Choose the display format. Options include: