

- Automatic instrumentation for common frameworks like Flask, Django, Lambda, and others - with a few lines of code, you can get rich events describing HTTP requests and database queries, and automatic tracing to tie these events together. With a few more lines, you can add application-specific context and tracing of your own.
- A complete tracing API. Even if your application does not neatly fit into a box like Flask or Django, you can still wield the power of distributed tracing to by initiating your own traces and instrumenting components of your service with spans.
Requirements
- Python 3.7 or greater
- A Honeycomb API key
- Flask
- Django
- AWS Lambda
- Bottle
- Tornado
Installation
If using the dataset-only data model, refer to the Honeycomb Classic tab for instructions.
Not sure?
Learn more about Honeycomb versus Honeycomb Classic.
- Honeycomb
- Honeycomb Classic
To install the Python Beeline for your application:
-
Make sure your version of setuptools is up to date:
-
Install the Beeline package:
-
Initialize the Beeline by including the following at the entry point to your application:
debug set to True you’ll see events being generated in your terminal output, but they won’t be sent to Honeycomb.
Set debug=False to start sending events to Honeycomb.Working With Proxies
Using a proxy requires overriding the defaultTransmission implementation when initializing libhoney:
proxies map passed in is documented in the requests documentation.
Note that if you override transmission_impl, if you also have non-default values for options such as max_concurrent_batches and max_batch_size in libhoney.init, they will need to be specified in the new Transmission object.
Further configuration options can be found in the init.py file
Honeycomb API keys have the ability to create and delete data, and should be managed in the same way as your other application secrets.
For example you might prefer to configure production API keys via environment variables, rather than checking them into version control.
Using Automatic Instrumentation
Implementation of automatic instrumentation varies between frameworks, but each need just a few lines of code. Each implementation instruments the entrypoint for your application (usually a request) by starting a trace, collecting some commonly used fields, ending the trace, and sending the event data to Honeycomb. You can build on this instrumentation by adding application-specific context as well as your own trace spans.- Django
- Flask
- Lambda
- Tornado
- Bottle
- Werkzeug
The Beeline uses Django’s request/response middleware (>1.10) and database query execution wrapper (>2.0).
-
In your project’s
settings.pyfile:If you would prefer to not use db instrumentation, use theHoneyMiddlewareHttpclass instead. -
In your app’s
apps.pyfile:
__init__.py file:Instrumenting Outgoing Requests
The Python Beeline supports auto-instrumentation of outgoing HTTP requests using the popular requests library. When enabled, outgoing HTTP requests will generate their own span in a trace and include a Honeycomb trace context propagation header (X-Honeycomb-Trace) that can be used to construct distributed traces that cross process boundaries.
To enable automatic instrumentation of requests, just import the appropriate patch into the current namespace:
Using Traces
- Start a trace: This creates a “root span” which is the top of your trace.
- Create one or more “child spans”. Each span covers a notable section of your application: a database call, an external API call, a long computation, or any other section.
- Close child spans in reverse order.
- Close trace (root span).
Starting and Ending a Trace
start_trace is the starting point for all tracing.
You will want to call it at the start of an interesting transaction, operation, or workflow that you want to instrument.
start_trace returns a copy of the root span, which should be passed back to finish_trace when you want to complete your trace.
Calling finish_trace concludes the trace in the Beeline’s internal state manager and sends its event data to Honeycomb.
If you are using the middleware for Django, Flask, Lambda, or other frameworks, you do not need to explicitly begin a trace at the start of each request or finish it at the end - it will be done for you.
To initiate a trace outside of the request code path (such as in a separate thread) you should use
start_trace and end_trace explicitly.Starting a Span
Tracing tells a story of what transpired inside your transaction or workflow, but to tell that story, you need spans! Spans represent noteworthy parts of your application that you would like to instrument. Examples include: database queries, external service calls, long computations, batch processing, and more. If it is a potential bottleneck or point of failure, consider enclosing it in a span.start_span creates a new span as a child of the active span.
When you start a trace, the root span is the active span.
As you add and finish spans, this will change.
The beeline keeps track of this for you, but it is important that each call to start_span is matched with a call to finish_span in order for the Beeline’s internal state manager to keep the trace’s ordering intact.
You must have an active trace to call start_span or no span will be created.
Using a Context Manager
The Python Beeline includes an optionaltracer context manager, which will do the work of starting and closing a span for you.
Using a Decorator
You can instrument entire functions using thetraced decorator.
Wrapping a function with traced decorator will create a span when the function is called, and close it when it returns.
If no trace is ongoing, calling the decorated function will start a new trace.
Threading and Traces
Due to its use of threadlocal storage to keep track of spans, tracing in the Python Beeline does not currently work smoothly across threads. If you use thetracer context manager inside a thread, it will generate a new trace ID separate from your other traced events.
If you call start_span inside a thread, it not work unless you also explicitly start a new trace with start_trace inside that thread.
traced_thread decorator to pass trace state to the new thread.
Adding Fields to a Span
Having detailed events is key to understanding your application. Consider keeping as much context as possible. Try putting a timer around a section of code, adding per-user information, or details about what it took to craft a response. You can add fields when and where you need to, or for some events but not others. (Error handlers are a good example of this.) Usebeeline.add_context_field to add fields to the currently active span.
For example, if want to add the user ID associated with the current request before the event is sent to Honeycomb:
beeline.start_span() there is a matching call to beeline.finish_span().
Adding Fields to an Entire Trace
Sometimes it is useful for information you capture earlier in a trace to be available in other spans. For example, maybe you have an instrumented function shared by multiple HTTP endpoint handlers, and you would like to know which endpoint called it. You can do this with a trace field.Creating Isolated Events
There may be circumstances where you would like to send events that are not closely related to an ongoing trace. You can access the Beeline’s underlying Libhoney client to create raw events that do not contain trace metadata.Sampling Events
We have built-in support for sampling in the Beeline. Simply set thesample_rate variable when calling beeline.init():
sample_rate must be a positive integer.
The Python Beeline uses a deterministic sampling algorithm when sampling traces.
Since trace IDs are randomly generated, sampling can be applied to the ID rather than randomly selecting individual events.
This allows traces to stay intact when sampling is enabled, while still being random.
Setting the sample rate to 10 will sample one in 10 traces.
Customizing Sampling Logic
Oursampler hook gives you more power over how events are sampled.
By including a sampler hook, you override the built-in sampling logic driven by the sample_rate variable and replace it with your own.
For example, assume you have instrumented an HTTP app and want a default sampling rate of 1 in 10 events.
However, you would like to keep all requests that return an error, and heavily sample healthy traffic like 200 response codes.
Also, you do not really care about 302 redirects in your app, and want to drop those.
You could define a sampler function like so:
beeline.init():
Defining a sampling hook overrides the deterministic sampling behavior for trace IDs. Unless you take
trace.trace_id into account (as we did above in by hashing the trace ID), you will get incomplete traces.Presend Hook
Ourpresend hook enables you to modify data right before it is sent to Honeycomb.
For example, if you have a field that sometimes contains PII or other sensitive data, you might want to scrub the field or drop it all together.
init method:
Sampler hooks are executed before presend hooks.
Distributed Trace Propagation
When a service calls another service, you want to ensure that the relevant trace information is propagated from one service to the other. This allows Honeycomb to connect the two services in a trace. Distributed tracing enables you to trace and visualize interactions between multiple instrumented services. For example, your users may interact with a front-end API service, which talks to two internal APIs to fulfill their request. In order to have traces connect spans for all these services, it is necessary to propagate trace context between these services, usually by using an HTTP header. Both the sending and receiving service must use the same propagation format, and both services must be configured to send data to the same Honeycomb environment. Distributed tracing enables you to trace and visualize interactions between multiple instrumented services. For example, your users may interact with a front-end API service, which talks to two internal APIs to fulfill their request. In order to have traces connect spans for all these services, it is necessary to propagate trace context between these services, usually by using an HTTP header. Automatic instrumentation supports trace propagation automatically, as long as your services are using the Honeycomb beeline, and an instrumented component to send and receive requests.Interoperability With OpenTelemetry
Trace context propagation with OpenTelemetry is done by sending and parsing headers that conform to the W3C Trace Context specification. To get Beelines and OpenTelemetry instrumentation to interoperate, you will need to use W3C headers. The Beeline includes marshal and unmarshal functions that can generate and parse W3C Trace Context headers. Honeycomb Beelines default to using a Honeycomb-specific header format on outgoing requests, but can automatically detect incoming W3C headers and parse them appropriately. In mixed environments where some services are using OpenTelemetry and some are using Beeline, W3C header propagation should be used. To propagate trace context, a parser hook and propagation hook are needed. The parser hook is responsible for reading the trace propagation context out of incoming HTTP requests from upstream services. The propagation hook is responsible for returning the set of headers to add to outbound HTTP requests to propagate the trace propagation context to downstream services.Older versions of Honeycomb Beelines required HTTP parsing hooks to properly parse incoming W3C headers.
Current versions of Honeycomb Beelines can automatically detect incoming W3C headers and parse them appropriately.
Check the release notes for your Beeline version to confirm whether an upgraded version is needed.
beeline.propagation.w3c module, and configure them as follows during beeline initialization:
Configuring Parsers and Propagators
To propagate trace context, two things need to be configured: thehttp_trace_parser_hook and the http_trace_propagation_hook.
If you are using Honeycomb’s beeline trace propagation, you do not need to do any additional configuration; we default to using the Honeycomb implementations in beeline.propagation.honeycomb.
The http_trace_parser_hook is responsible for reading the trace propagation context out of HTTP requests from upstream services.
If you are using one of our automatic instrumentations for a request framework (Django, Flask, and Lambda, for example), this hook will be called automatically to parse the trace context.
The http_trace_propagation_hook is responsible for returning the set of headers to add to outbound HTTP requests to propagate the trace propagation context to downstream services.
If you are using automatic instrumentation for Requests or urllib, this hook will be called automatically to propagate the trace context.
You may choose to use custom trace propagation hooks for various reasons:
- You want to avoid potentially leaking information to downstream services you do not control for security reasons.
- You may want to start your traces at your services, and ignore trace information coming from upstream services.
http_trace_parser_hook and http_trace_propagation_hook in beeline.init:
http_trace_parser_hook and http_trace_propagation_hook implementations in beeline.propagation.honeycomb
and beeline.propagation.w3c.
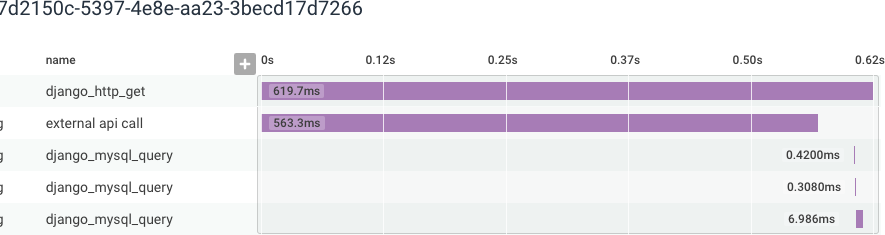
Example Events
This sample event from the Python Beeline. It is anhttp_server event, generated when your app handles an incoming HTTP request.
Queries to Try
Here are some examples to get you started querying your app’s behavior:Which of My App’s Routes Are The Slowest?
- GROUP BY: request.path
- VISUALIZE: P99(duration_ms)
- WHERE: type = http_server
- ORDER BY: P99(duration_ms) DESC
Where Is My App Spending The Most Time?
- GROUP BY: type
- VISUALIZE: SUM(duration_ms)
- ORDER BY: SUM(duration_ms) DESC
Which Users Are Using The Endpoint That I Would Like to Deprecate?
This query uses a customuser.email field.
To create a custom field, see Adding fields, below.
- GROUP BY: app.user.email
- VISUALIZE: COUNT
- WHERE: request.path == /my/deprecated/endpoint
Using Asyncio
Support for asyncio is available in beeline 2.11 and later. When using asyncio, you can follow all of the usual tracing patterns described in this doc. The main difference is that you will need to init the beeline from code that is run inside the event loop. Here is some example code that may help you get started:Customizing Event Transmission
By default, events are sent to the Honeycomb API. It is possible to override the default transmission implementation by specifyingtransmission_impl to init.
A couple of alternative implementations ship with the libhoney SDK.
- FileTransmission: writes events to a file handle, defaulting to stderr
- TornadoTransmission: sends events using Tornado’s AsyncHTTPClient rather than using a thread pool
Troubleshooting The Beeline
Not seeing your newly instrumented service appearing in Honeycomb? Here are some things to check.No Traces for a Service
The service name is a required configuration value. If it is unspecified, all trace data will be sent to a default dataset calledunknown_service.
Debug Mode
The Python Beeline supports an optional debug mode. When enabled, additional logging to stderr will indicate when an event is enqueued, when a trace starts and ends, and whether or not the Beeline initialized correctly. To enable verbose mode, setdebug=True in the call to beeline.init():
Checking The Responses Queue
You can use the queue returned bybeeline.get_responses_queue() to check whether events were successfully received by Honeycomb’s servers.
Each response includes the following fields:
status_code: the HTTP status code returned by Honeycomb when trying to send the eventduration: the number of milliseconds it took to send the eventbody: the body of the HTTP response from Honeycomb. On failures, this body contains some more information about the failure.error: in the case of an error before the HTTP attempt, the reason will be in this field. For example, when sampled or dropped because of a queue overflow.
My Traces Are Showing Missing Root Spans
There can be a number of reasons for missing root spans. One potential reason could be that there is an upstream service, load balancer, or other proxy propagating W3C trace headers as part of your distributed trace. Since beelines accept both Honeycomb and W3C headers, that service propagating a W3C header will cause “missing span” gaps in your trace if the service is not also configured to send telemetry to Honeycomb. The solution is to either instrument that service and configure it to send telemetry to Honeycomb, or to specify in the downstream service’s beeline configuration that only Honeycomb propagation headers should be parsed. To override undesired W3C trace header propagation behavior, configure the Beeline to use anhttp_trace_parser_hook:
Call Close At Application Shutdown
Honeycomb events are sent in batches. By default, this happens every 100ms. When your application terminates, it is possible for some events to still be in the queue, unsent. To ensure that all events get flushed before shutdown, callbeeline.close() before your application exits.
You can register an atexit handler after initializing the Beeline like so:
Using The Python Beeline With Python Pre-Fork Models
Popular servers like uWSGI and Gunicorn utilize a pre-fork model where requests are delegated to separate Python processes. Initializing the Python Beeline before the fork happens can lead to a state where events cannot be sent. To initialize the Python Beeline correctly, you will need to run your init code inside a post-fork hook, and remove any other calls toinit.
After initializing the Beeline for your webserver, you can follow the Using Automatic Instrumentation instructions to take advantage of the automatic instrumentation we offer for Django, Flask, and other frameworks and integrations.
Be sure to substitute the
beeline.init step there with the initialization steps you followed here.gevent
The beeline uses therequests lib, which uses urllib3.
If you are using gevent, you should call its monkey patching functions before importing the beeline for the first time, or you may encounter a RecursionError when sending events.
uWSGI
Users of uWSGI can use a postfork decorator. Simply add the@postfork decorator to the function that initializes the Python Beeline,
and it will be executed post-fork.
Gunicorn
Gunicorn users can define apost_worker_init function in the Gunicorn config, and initialize the Python Beeline there.
-c option:
Celery
Celery uses a pre-fork approach to create worker processes. You can specify aworker_process_init decorated function to initialize the Python Beeline after each worker has started.