The goal of Honeycomb instrumentation is to give you a language for sending wide, structured events into Honeycomb, so that they can be queried later.Documentation Index
Fetch the complete documentation index at: https://docs.honeycomb.io/llms.txt
Use this file to discover all available pages before exploring further.
What is an Event?
Abstractly, an event is anything that happens in your system that is worth tracking. Some common choices of events include http requests to a server, a query to an SQL database, or a single step of a build process. We say that events should be wide because they can contain many different fields. You can use the fields to associate the events with all of the additional data that it takes to understand what your system did with that event. There are traditional fields — client IP address, latency, server — but you can also add others. Did your system need to go through authorization? Did the result hit a cache? Did it go through a branch of an A/B test? Did it get a transient warning? What build of the server code was it using? Which AWS zone hosted it? Any data that can make sense of the event can be accumulated and attached to the event. But at the end of the day, what you will send to Honeycomb is simply a JSON object that you POST to our API. Events get ingested into our storage engine for later querying. Honeycomb’s fast storage engine serves queries in seconds, with no need to define schemas or indexes ahead of time. The Honeycomb query engine allows you to ask all sorts of questions of your data. You can filter on any field, or combination of fields, to narrow down on a single page, or even on any user. You can group by error code or error message to spot common or recently occurring problems. You could SUM time spent on certain MySQL queries to identify if there are slow queries, but also if there are queries that are running too often.Requests and Tracing
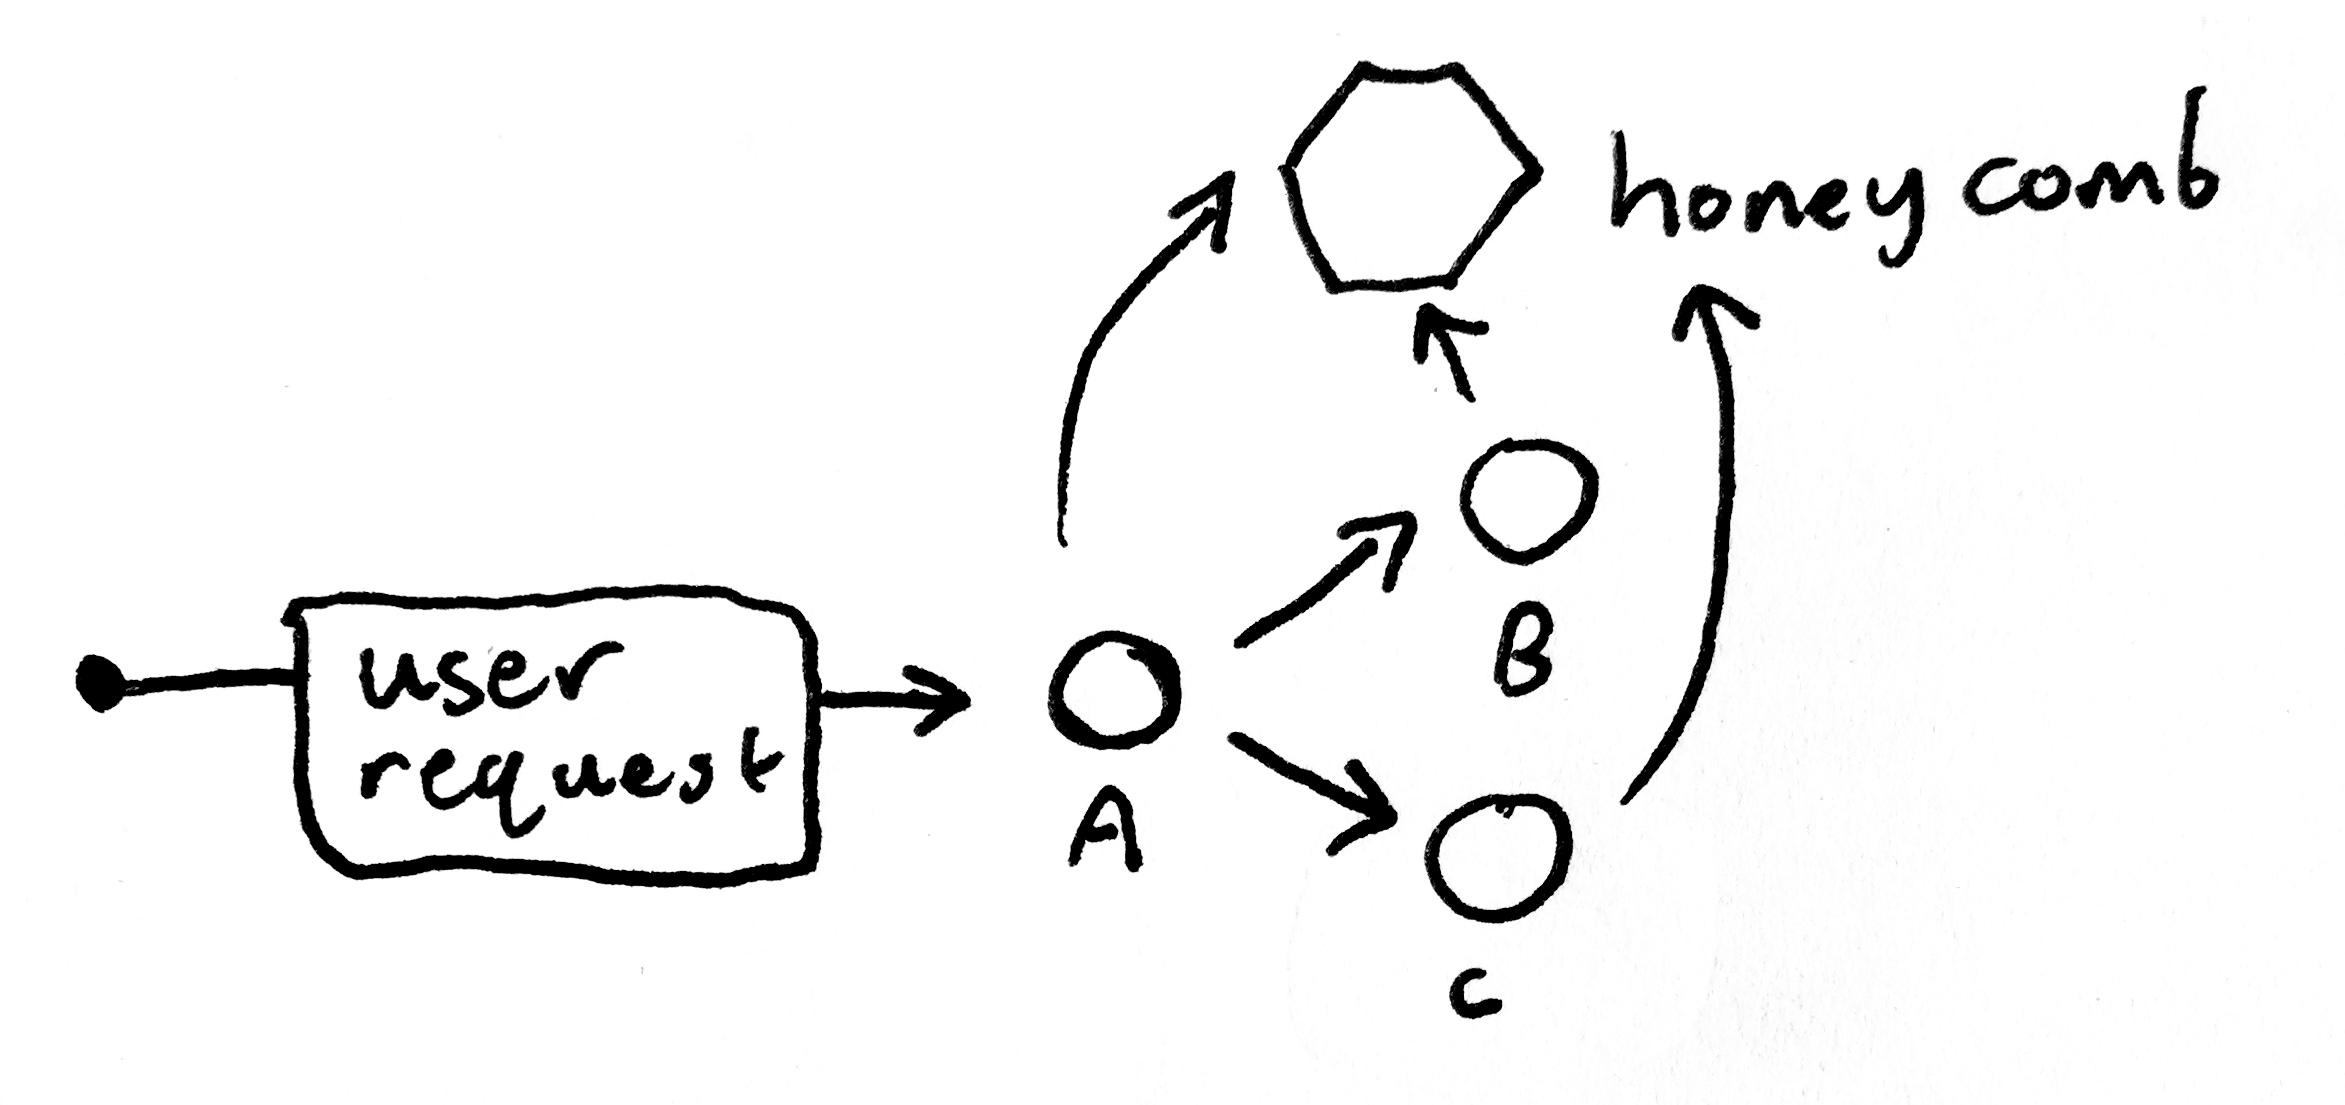
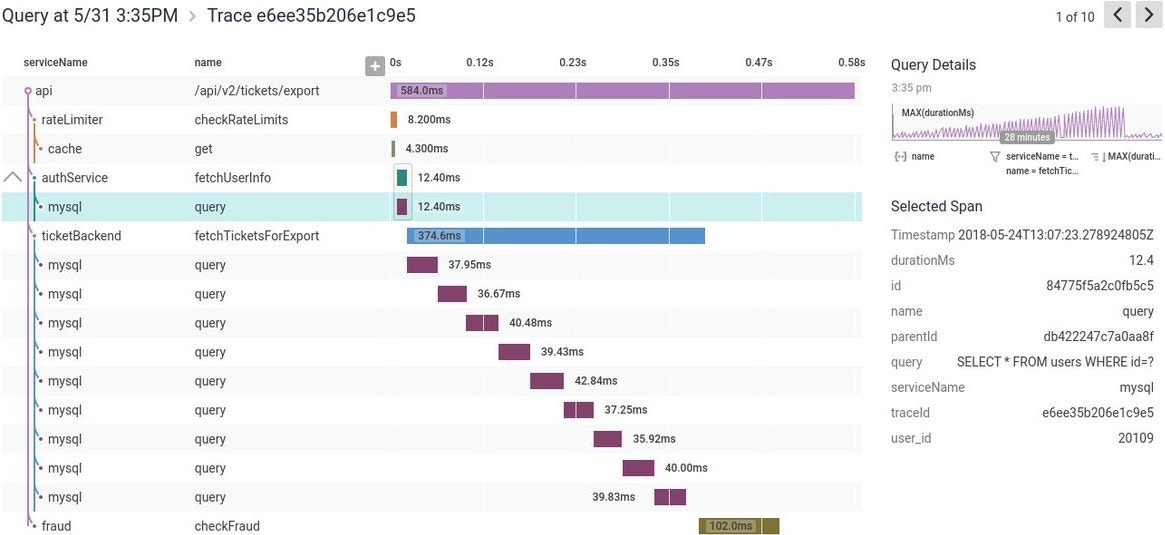
One of the most common Honeycomb use cases is to send one event for each HTTP or RPC request in your system. You might even have several services (e.g., A, B, and C) that are touched in the lifecycle of serving what is one request to the end user, and they all send events to Honeycomb.

Batch Jobs and Serverless
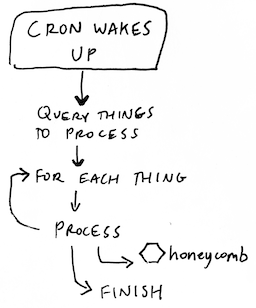
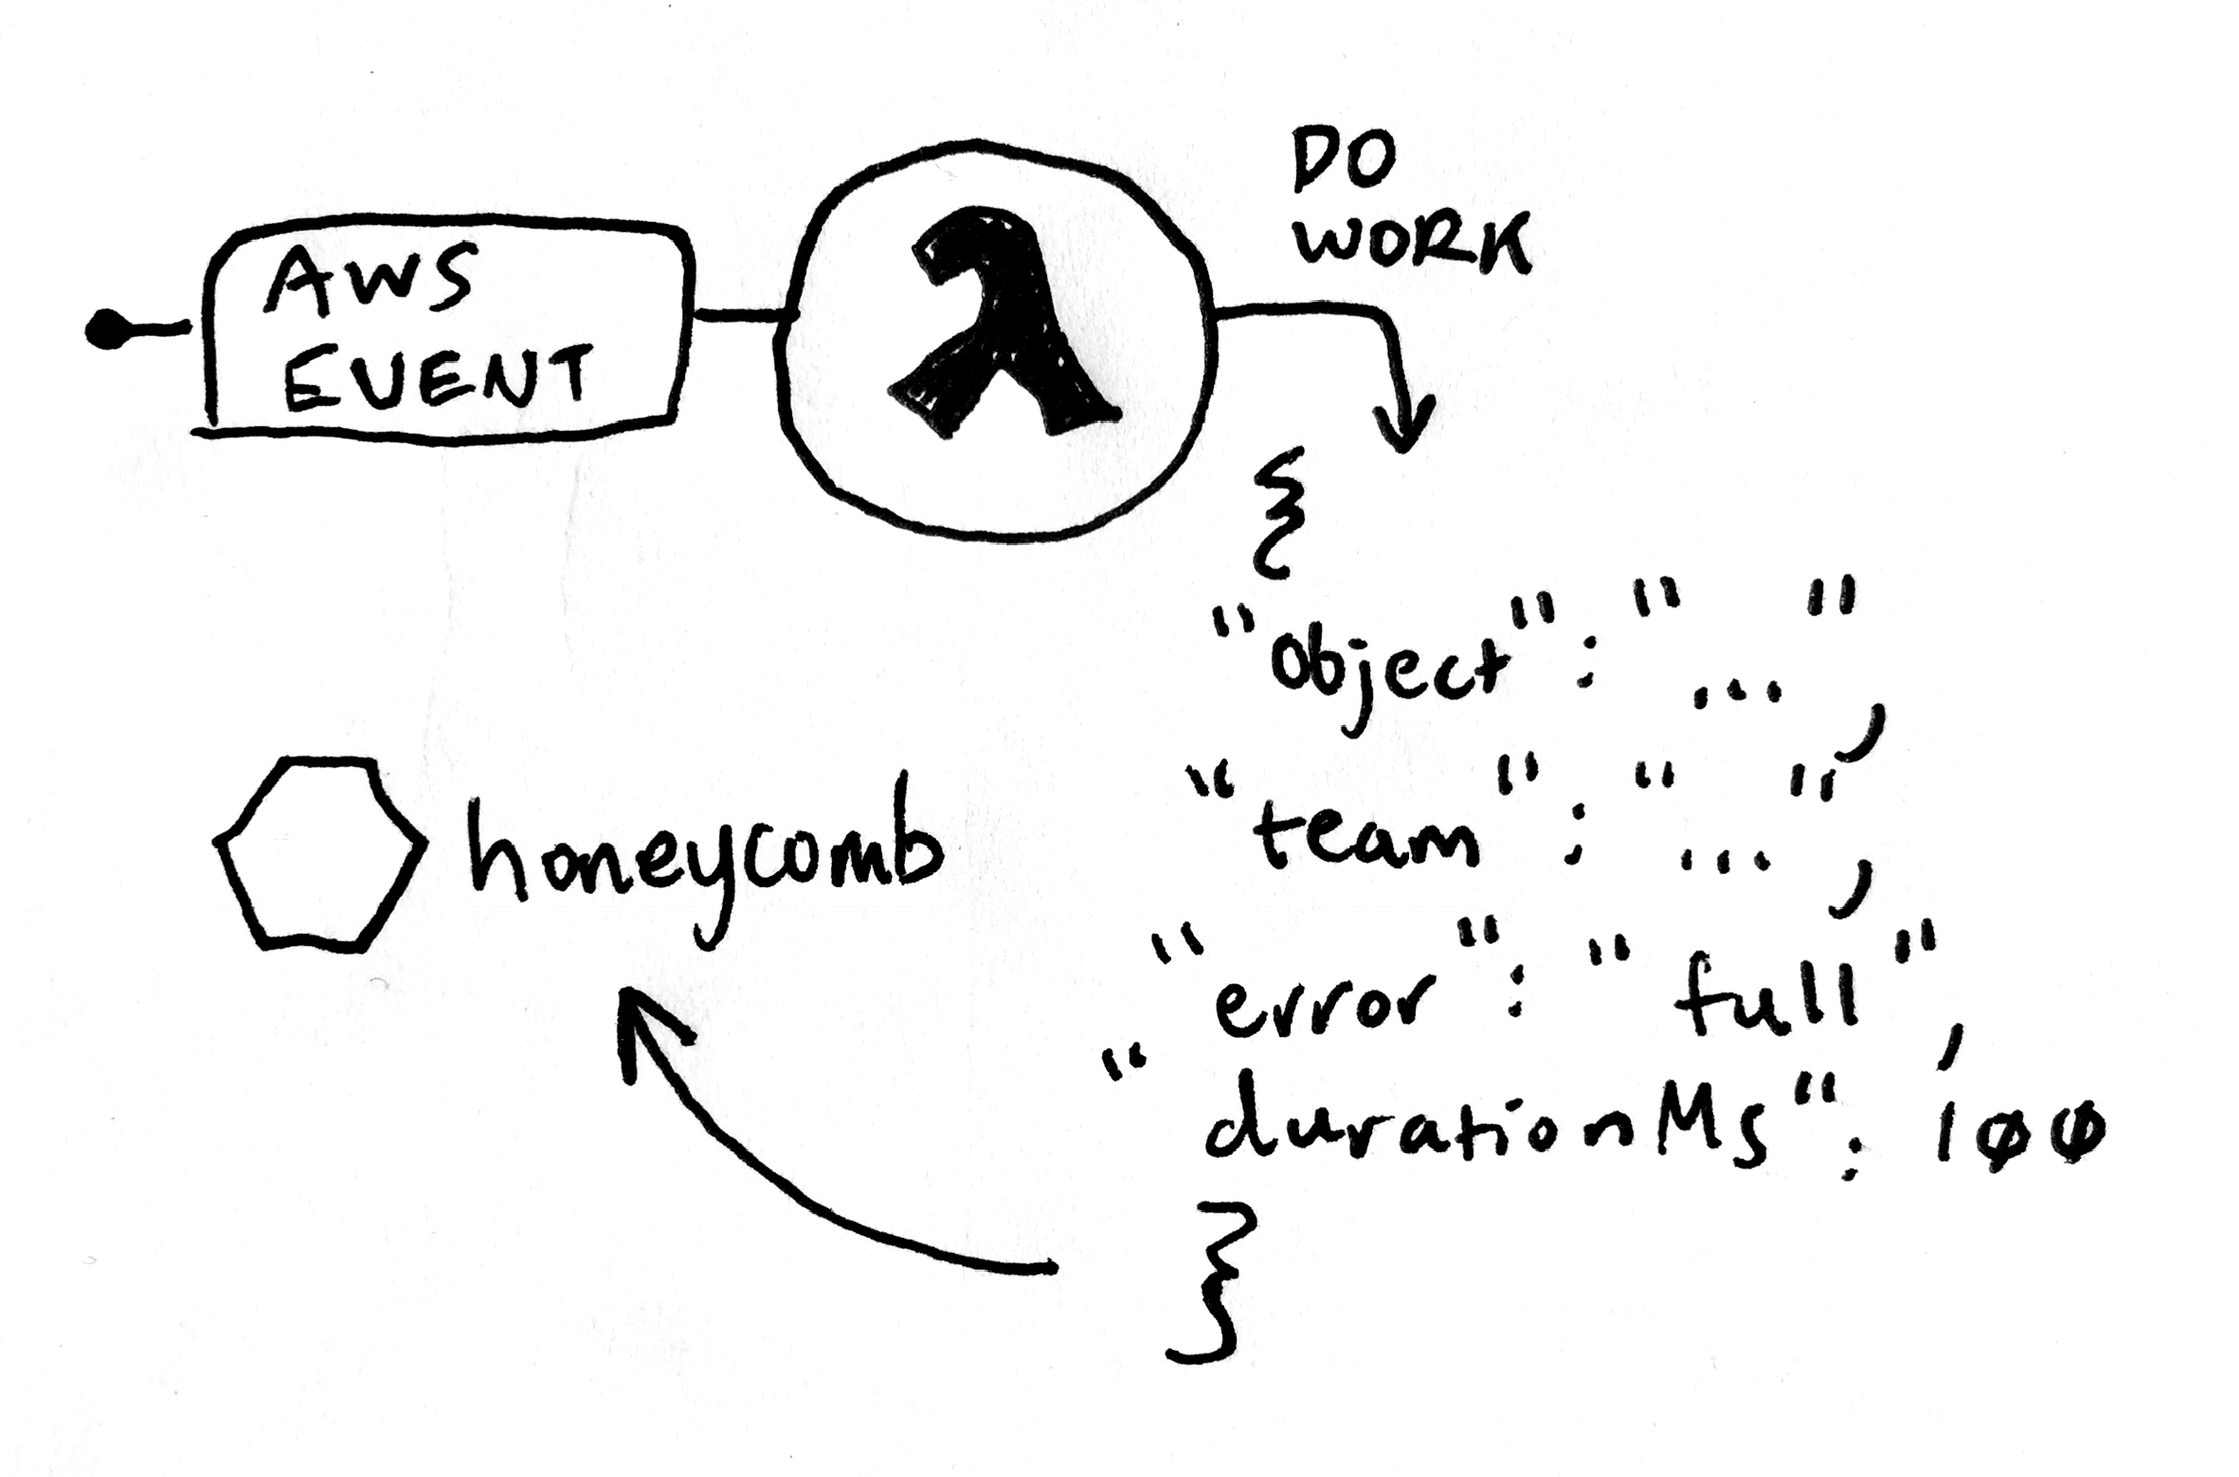
You can instrument background jobs to gain insight into how they operate. For example, you can send an event for every item that a processing job touches. Honeycomb provides abuildevents integration for common Continuous Integration (CI) systems, including Travis-CI, CircleCI, and Jenkins.
You can see which parts of your build are taking the most time, and streamline dependencies.


Kubernetes
Understanding the behavior of applications running on Kubernetes can be daunting. Honeycomb integrates with Kubernetes to collect your applications’ logs, cluster logs, and resource metrics. This data answers questions like:- How did response time change after a canary deployment?
- How does application performance vary with container resource limits?
- Are application errors happening on specific nodes, or across the fleet?