

What is a Trace?
A trace tells the story of a complete unit of work in your system. For example, when a user loads a web page, their request might go to an edge proxy. That proxy talks to a frontend service, which calls out to an authorization and a rate-limiting service. There could be multiple backend services, each with its own data store. Finally, the frontend service returns a result to the client. Each part of this story is told by a span. A span is a single piece of instrumentation from a single location in your code. It represents a single unit of work done by a service. Each tracing event, one per span, contains several key pieces of data:- A serviceName identifying the service the span is from
- A name identifying the role of the span (like function or method name)
- A timestamp that corresponds to the start of the span
- A duration that describes how long that unit of work took to complete
- An ID that uniquely identifies the span
- A traceID identifying which trace the span belongs to
- A parentID representing the parent span that called this span
- Any additional metadata that might be helpful
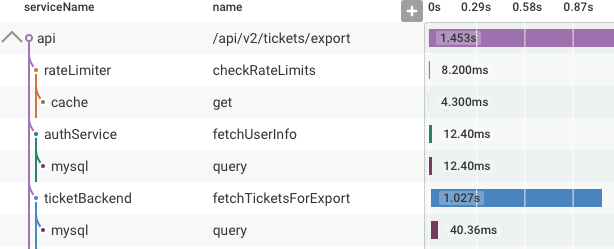
/api/v2/tickets/export endpoint first checks if the request is allowed by the rate limiter.
Then, it authenticates the requesting user, and finally, fetches the tickets requested.
Each of those calls also called a datastore.
In the trace diagram, you can see the order in which these operations were executed, which service called which other service, and how long each call took.
How do Honeycomb Events Relate to Traces?
Each span is one event to Honeycomb. That event has fields, likeparentID and traceID, which describe that span’s relationship to other spans.
A trace ties together a unit of work that occurs across multiple events (or spans) in a distributed service.
A trace is a group of spans that all share the same traceID.
When using OpenTelemetry, service.name in each span defines the current service context and creates Service Datasets.
Service scoping is supported only for Honeycomb datasets, not for Honeycomb Classic datasets.
Learn more about Honeycomb versus Honeycomb Classic datasets.
Next Steps
- Sending trace data to Honeycomb describes the different ways to generate tracing metadata and send it to Honeycomb
- Learn how to query traces and visualize a trace waterfall with exploring trace data