Honeycomb sees events as being very different from metric data and log data. We refer often to “structured events.” This page contrasts our way of thinking about events with structured (and unstructured) log and metric approaches.
An event is a collection of information about what it took to complete a unit of work. For example, an event might be the process of accepting an HTTP request, doing the required work, and then passing back a response. An event is structured because each field of its data is labelled. Fundamentally, any data that comes into Honeycomb enters as a structured event.
A structured event is a blob of JSON, sent over HTTP. This is an example from an internal Honeycomb dataset:
{
  "app.flag.golden-retrievers-bool": false,
  "app.group_bucket": 11,
  "app.query-source": "trigger-cron",
  "app.total_segments": 0,
  "cold_segment_count": 0,
  "columns_open_fraction": 0,
  "dataset_id": "46829",
  "duration_ms": 0.011668,
  "global.availability_zone": "us-east-1a",
  "global.build_depth": 10011,
  "global.build_id": 275663,
  "global.commit_hash": "9cb3de12faf709cdc9bca5c9900e8259c1719b02",
  "global.env": "production",
  "global.infra_type": "aws_instance",
  "global.instance_type": "m6gd.2xlarge",
  "global.memory_inuse": 671497992,
  "global.num_goroutines": 799,
  "global.os_version": "18.04\n",
  "global.pid": 7585,
  "global.process_uptime_seconds": 2298,
  "global.process_uptime_seconds_LOG10": 3.3613500243522663,
  "global.role": "",
  "ingest_latency_sec": 0.05720925331115723,
  "meta.beeline_version": "0.11.0",
  "meta.local_hostname": "retriever-0a8b688312e490d1c",
  "meta.span_type": "leaf",
  "name": "bucketRequest",
  "service.name": "retriever",
  "trace.parent_id": "ab0e166fbbea7dc6",
  "trace.span_id": "84c82b34145c22f9",
  "trace.trace_id": "845a4de7-8e3a-4605-8476-6aa1592c3134"
}
There are fields that refer to the context in which the request was processed, the data that was sent, and the way that this event was processed.
The trace fields help identify that this event is a part of a trace.
The event refers to a single unit of work and it attempts to describe what had to be done to service specifically this bucketRequest operation.
The user can now query on this data.
Group and query on any field, and Honeycomb will rapidly aggregate on it.
For example, you might be interested in knowing whether latency (duration_ms) is higher depending on app.group_buckets.
You might even want to identify outliers across all of the fields simultaneously with BubbleUp.
You create these events by instrumenting your code.
In this code snippet, we create a new event by calling libhoney.new_event, we add some data to it with add and add_field, and then we send it to Honeycomb with ev.send().
import libhoney
libhoney.init(
    writekey="YOUR_API_KEY",
    dataset="honeycomb-python-example",
    debug=True
)

...

# create a new event
ev = libhoney.new_event()
# add data up front
ev.add({
    "method": "get",
    "hostname": "appserver15",
    "payload_length": 27
})

# do some work, maybe take some measurements

# add another field
# you can send raw measurements when you query
# Honeycomb can help us compute averages, percentiles, etc

ev.add_field("duration_ms", 153.12)
ev.send()
Honeycomb Traces are made up of structured events; a trace event merely needs to have a few additional fields defined to place it within the trace structure. Learn more about sending trace data to Honeycomb.
A structured log is a message, or a collection of messages, with a group of fields in a fixed structure. Because of this framework, a structured log can easily turn into a structured event. The easiest way to think of a structured log is as what you might expect to see in an Excel table or a comma-separated-value list.
Here, for example, is a header and a line from a structured log:
host-ip   username  datetime             cmd URL            protocol status size
127.0.0.1 frank     10/Oct/2000:13:55:36 GET /apache_pb.gif HTTP/1.0 200    2326
This line can be instead read as a JSON blob, like the internal Honeycomb dataset example in the previous section. Honeytail is a tool that can read in structured logs and emit structured events.
Structured events and structured logs can help us build rich perspectives on how a system is operating. We contrast these with a few other perspectives.
Each event in Honeycomb is meant to be a standalone description of a single unit of work. For example, an event could be one user looked at one URL, it returned a particular status, and it took this long.
But there are other ways to bring data in. For example, you can bring in pre-aggregated data, sometimes called application metrics:
{
   time: 4:03 pm,
   duration_sec: 60,
   total_hits: 500,
   total_hits_home_page: 250,
   total_hits_user_page: 117,
   avg_duration: 113,
   avg_duration_home_page: 50,
   avg_duration_user_page: 255,
   p95_duration: 236,
   ... (and so on, for p99 and for other pages) ...
 }
In this case, the system has already computed the relevant values, and is sending those aggregated values to Honeycomb.
What if you want to zoom in on a particular piece of data? For example, you want to know how the system operates when the storage engine has a cache hit. Unfortunately, the storage engine’s state is not represented directly in the table.
We could, of course, add a row: avg_duration_cache_hit_true, and another row for _cache_hit_false.
But we would need to repeat that, too, for p95_duration...cache_hit_true, and all the other variants.
The list of pre-aggregated data is getting longer and longer.
This situation leads to “the curse of dimensionality” — the fact that if you decide you also want to track by cache hit, and also by page, and perhaps by user ID or build ID, each of those changes costs hundreds or thousands more aggregated rows.
By bringing in disaggregated data, Honeycomb is able to flexibly ask questions about any event.
A log is a message, or a collection of messages. They usually have a timestamp attached. Individual log messages may or may not be related to each other.
The log file we saw before was structured: every event roughly looks the same, and we can compare the events by their columns.
Let us contrast that example with an unstructured log.
When Honeycomb starts its retriever service, the console prints something like this:
Running serve cmd: cd cmd/retriever && go run main.go -debug  -reader
time="2021-01-06T17:44:13-08:00" level=info msg="I'm a reader, using RPC for dataset flushes"
DEBU[2021-01-06T17:44:13.368024402-08:00] starting *secrets.YamlSecrets
DEBU[2021-01-06T17:44:13.368461794-08:00] starting *retrieverclient.YamlConfig named retriever_config
DEBU[2021-01-06T17:44:13.368679356-08:00] starting *config.YamlConfig
DEBU[2021-01-06T17:44:13.369046236-08:00] starting *s3.DefaultService
DEBU[2021-01-06T17:44:13.369518352-08:00] starting *lambda.DefaultService
WARN[2021-01-06T17:44:13.369694698-08:00] debug http server error                       error="listen tcp 127.0.0.1:6060: bind: address already in use"
INFO[2021-01-06T17:44:13.369727168-08:00] Debug service listening on localhost:6061
DEBU[2021-01-06T17:44:13.369728616-08:00] starting *beelineinit.Beeline
WARN[2021-01-06T17:44:13.369839218-08:00] debug http server error                       error="listen tcp 127.0.0.1:6061: bind: address already in use"
INFO[2021-01-06T17:44:13.369933256-08:00] Debug service listening on localhost:6062
DEBU[2021-01-06T17:46:15.618320662-08:00] starting *app.ReadApp
INFO[2021-01-06T17:46:15.618436383-08:00] Serving at 0.0.0.0:8089...
INFO[2021-01-06T17:47:15.618821038-08:00] I'm alive. 2021-01-06 17:47:15.618683749 -0800 PST m=+60.893288862
This is a convenient form for a human reader as they can scan through the log easily. However, these events are not really standalone. To see what it was like to start the app, you need to read a whole sequence of the lines to figure out what happened (and whether something went wrong).
This aspect makes unstructured logs hard to query. To find out how long it took to start the app, we need to subtract different timestamps from each other. To find out whether it had an error during startup, we have to search for lines.
Imagine summarizing the same event like this:
{
  cmdline: "cd cmd/retriever && go run main.go -debug  -reader",
  startTime: "2021-01-06T17:44:13-08:00",
  mode: "reader",
  yamlSecrets_offset: "368024402",
  yamlConfig_offset: "13.368461794",
  debug_http_error: "listen tcp 127.0.0.1:6061: bind: address already in use"
  servicePort: 8089,
  duration_ms: 180262
  ...
}
In this format, we can query for questions like “Which services take the longest to start?” or “Do any slow startups correlate with particular error states?” and so on.
It might be natural to ask whether, compared to metrics, event code requires too much data. A pre-aggregated metric should compress to be far smaller than a rich event, right?
In our experience, that is not always the case. The curse of dimensionality means that in order to ask reasonable questions, users often need to create many metrics, losing many of those cost savings.
If event data is overwhelming event volumes, it is also possible to sample your data.
For example, you could send one in a hundred status:200s, but send every single status:500.
Honeycomb will automatically multiply out sampled events, so that query results remain accurate.
Read more about sampling in Honeycomb.
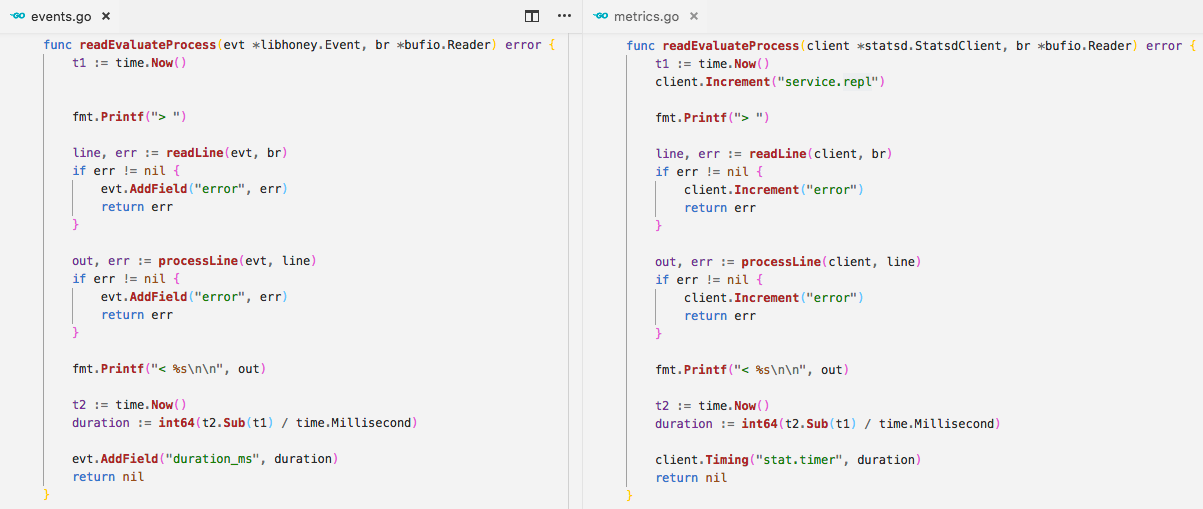
In this section, we show how the same piece of code can be instrumented for events and metrics, and for metrics and logs. We show that while the instrumentation code is very similar, the effects are very different: the events are more powerful and allow more flexible use.

The code for this example can be found in these github gists: events sample code and metrics sample code.
In this example, the left side is instrumented with events, the right, with metrics. Both capture the duration, but the output is quite different. Events are built up over time, gaining context as they go, whereas metrics are updated individually, and do not carry that same context.
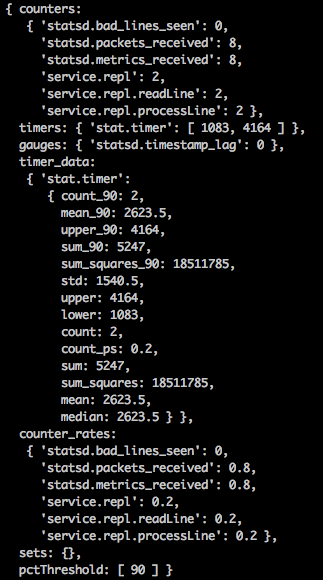
The output from this example is quite different when looking at events versus metrics.
In this example, Honeycomb was used for events. Although a graph was rendered, we are showing the raw data for a more equal comparison.

In this example, StatsD was used for metrics.

Both of these examples capture the duration in milliseconds as well as how many times the example app was run. At first glance, the metrics output appears to have more data, but all of those can be calculated from the data output from events. Metrics tools need to do this calculation before write time. We can calculate all of the same metrics in Honeycomb, but we also gain further context. Events let us add the richer information of input and output and the timestamp when they occurred.
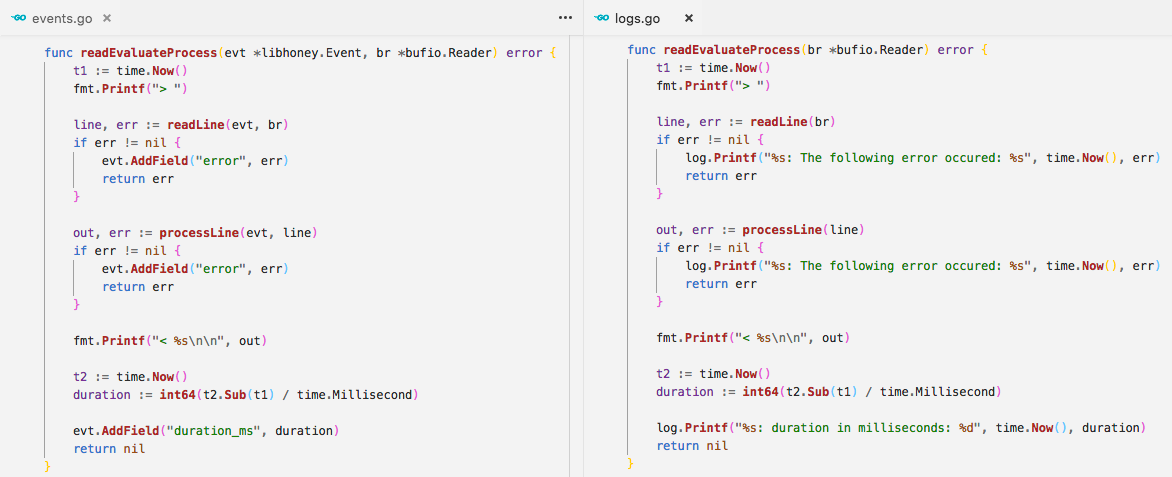
 The code for this example can be found in these github gists: events example code and logs example code.
The example on the left is instrumented with events, the one on the right is instrumented with logs. Both events and logs capture the duration in milliseconds. Using events, we simply add it as a field to the event that will eventually be returned. With logs, we can log it. In this example, we included the timestamp for each log statement, which can be parsed out with regex. The log then includes a string describing the data, and then finally the data itself (in this case, the duration in milliseconds).
In this example, Honeycomb was used for events. Although a graph was rendered, we are showing the raw data for a more equal comparison.

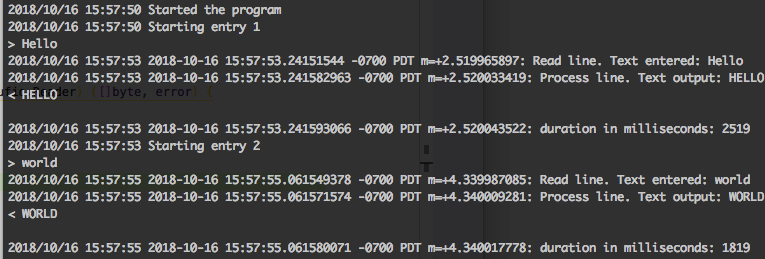
In this example, we logged the output to the terminal:

All the information is included in both outputs, but events allow you to see patterns in your data much faster. For example, we can see that one event was much slower than the other in both cases. We can see this indicated at a glance with the events output. When using logs, we have to read through the entire output to find the two duration lines, and which input and output is tied to which.
All three of these implementations take about the same amount of time, effort and lines of code. The events and metrics were a little more effort to get set up initially, because they required some configuration to an outside service. Though if you are doing more than outputting logs to the terminal, logs will require the same amount of setup.