This feature is available as an add-on for the Honeycomb Enterprise plan.
Please contact your Honeycomb account team for details.
Supported Platforms
Configuration Table
Relabel Configs
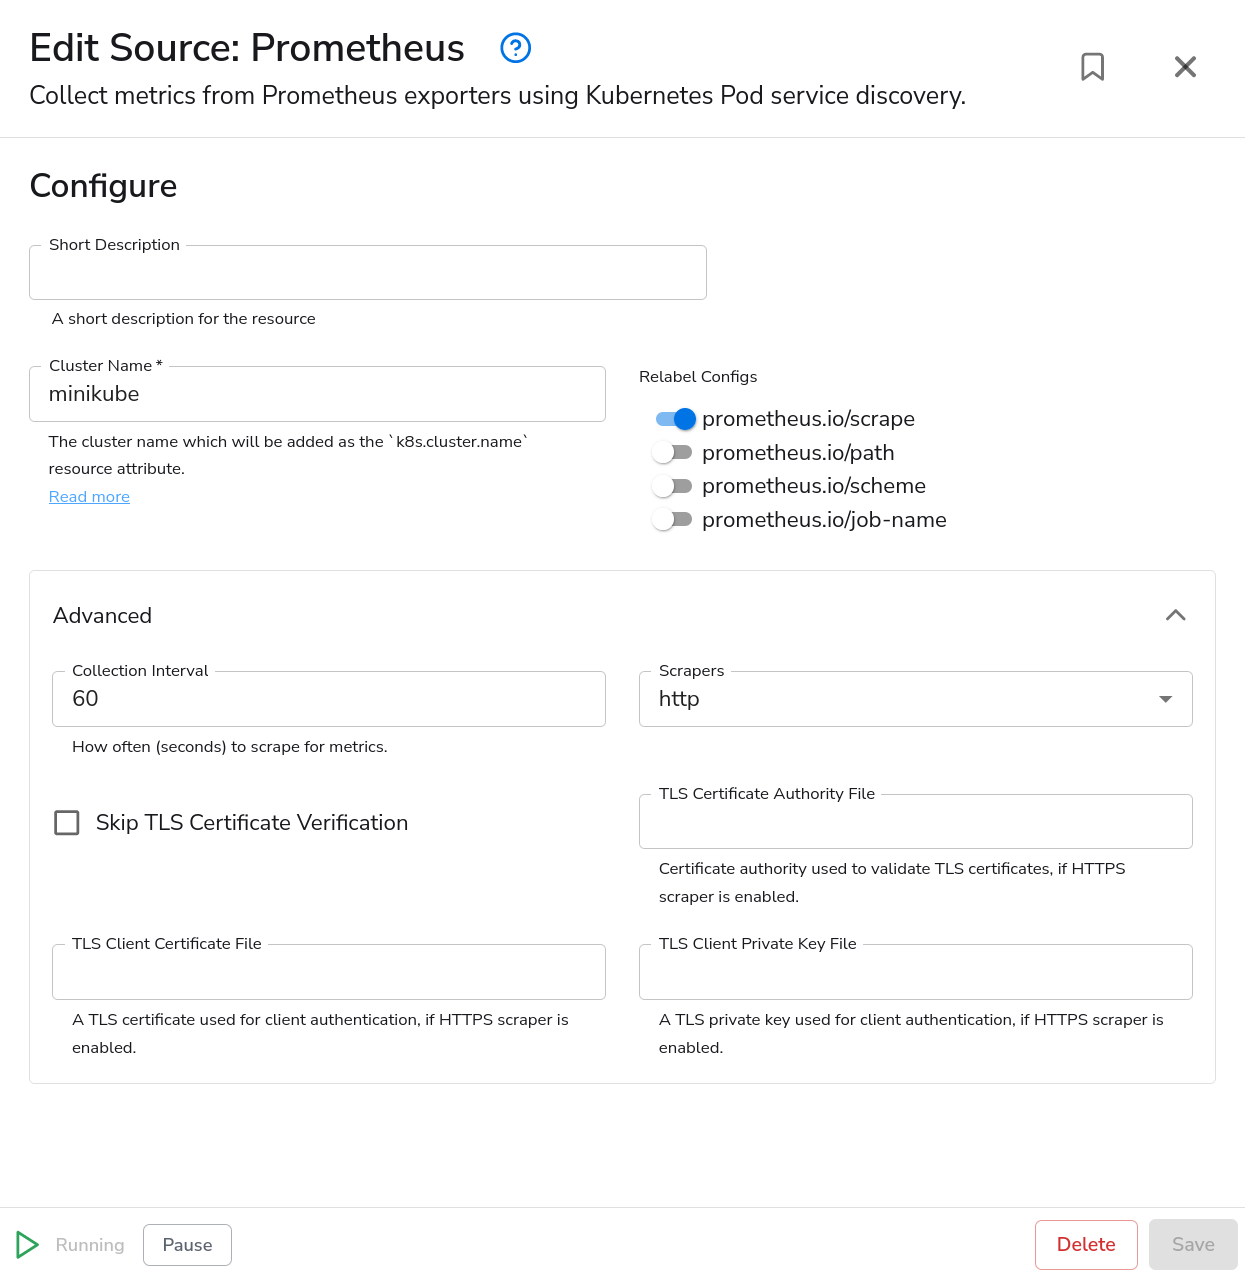
Relabel configs are used to control how detected pods are scraped. There are four options.prometheus.io/scrape
When enabled, only pods with theprometheus.io/scrape: "true" annotation will be considered for scraping.
This option is enabled by default, to prevent the receiver from scraping all pods.
prometheus.io/path
The default HTTP path is/metrics. The path can be overridden by enabling this option and configuring
the prometheus.io/path annotation.
prometheus.io/scheme
When this option is enabled, the HTTP scraper (configured with the “Scrapers” option) will only scrape pods that have theprometheus.io/scheme: "http" annotation set. Similarly, the HTTPS scraper will only
scrape pods that have the prometheus.io/scheme: "https" annotation set.
This option is recommended when using both HTTP and HTTPS scrapers.
prometheus.io/job-name
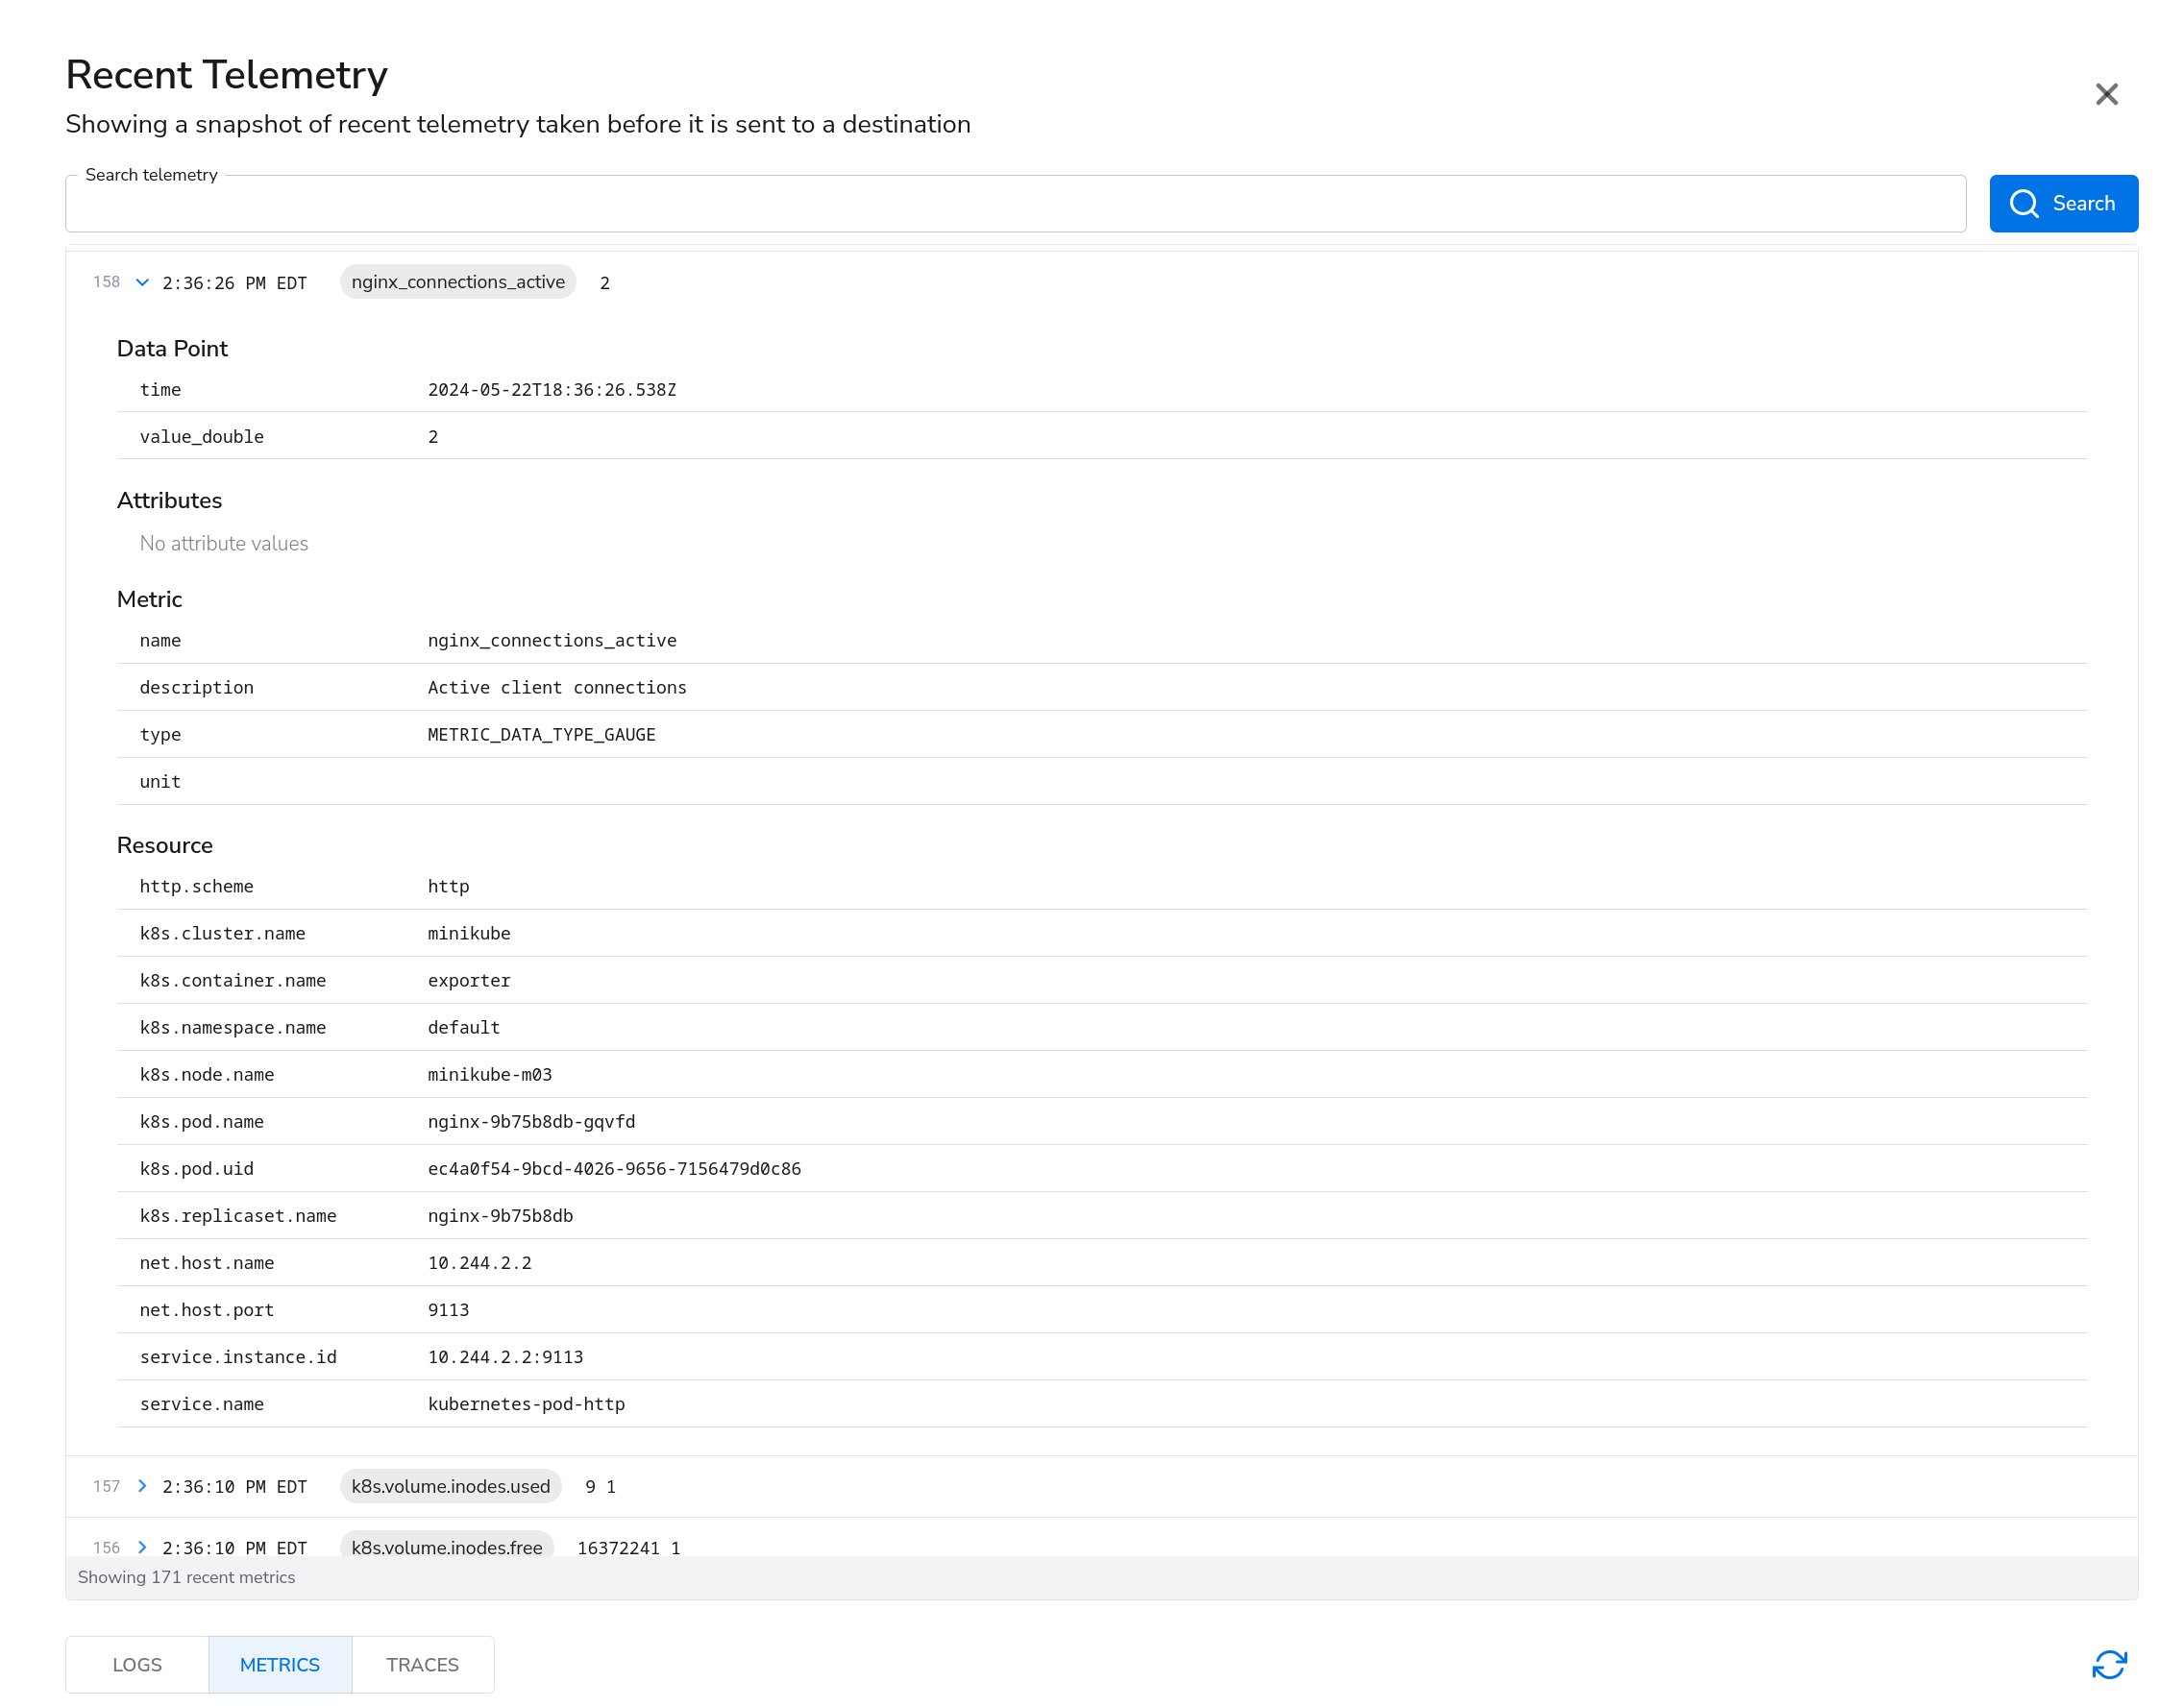
When this option is enabled, theservice.name resource attribute will be set to the value of the
pod annotation prometheus.io/job-name. This allows you to dynamically set service.name, which defaults
to kubernetes-pod-http and kubernetes-pod-https, depending on which scraper is in use.
Example Configuration
When using Relabel configs, make sure to annotate your pods. Pod annotations are set atspec.template.metadata.annotations, not to be confused with metadata.annotations.
Updating pod annotations will cause your pods to be re-deployed.
Transport Layer Security
When using TLS, if you need to configure a TLS certificate authority or a client key pair, update your Telemetry Pipeline Agent YAML manifest to include avolumeMount that will mount your TLS files
into the container.
You can find documentation for mounting secrets into a container here.
Example Configuration
By default, the Prometheus source is configured to use the HTTP scraper and theprometheus.io/scrape
relabel config is enabled. This means the receiver will only scrape pods that have prometheus.io/scrape: "true"
set in their annotations.
A cluster name is required, and will be set as k8s.cluster.name. You can use a placeholder value if you
intend to use Resource Detection or Add Fields
processors.
- k8s.cluster.name
- k8s.node.name
- k8s.container.name
- k8s.pod.name
- service.name: The name Prometheus job name