This processor has been deprecated and replaced with a new Extract Metric processor that supports additional functionality. While it will continue to function, it will no longer receive any enhancements and you should migrate to the new processor. For more information about the new processor, see here.
The Extract Metric Processor creates new metrics based on log telemetry. For logs matching a filter, the processor will extract a numerical value from a field and then create a metric with that value. The name, unit, and type of the created metric can be configured. Additionally, fields from matching logs can be preserved as metric attributes.
Metrics | Logs | Traces |
---|---|---|
✓ |
v1.14.0
+
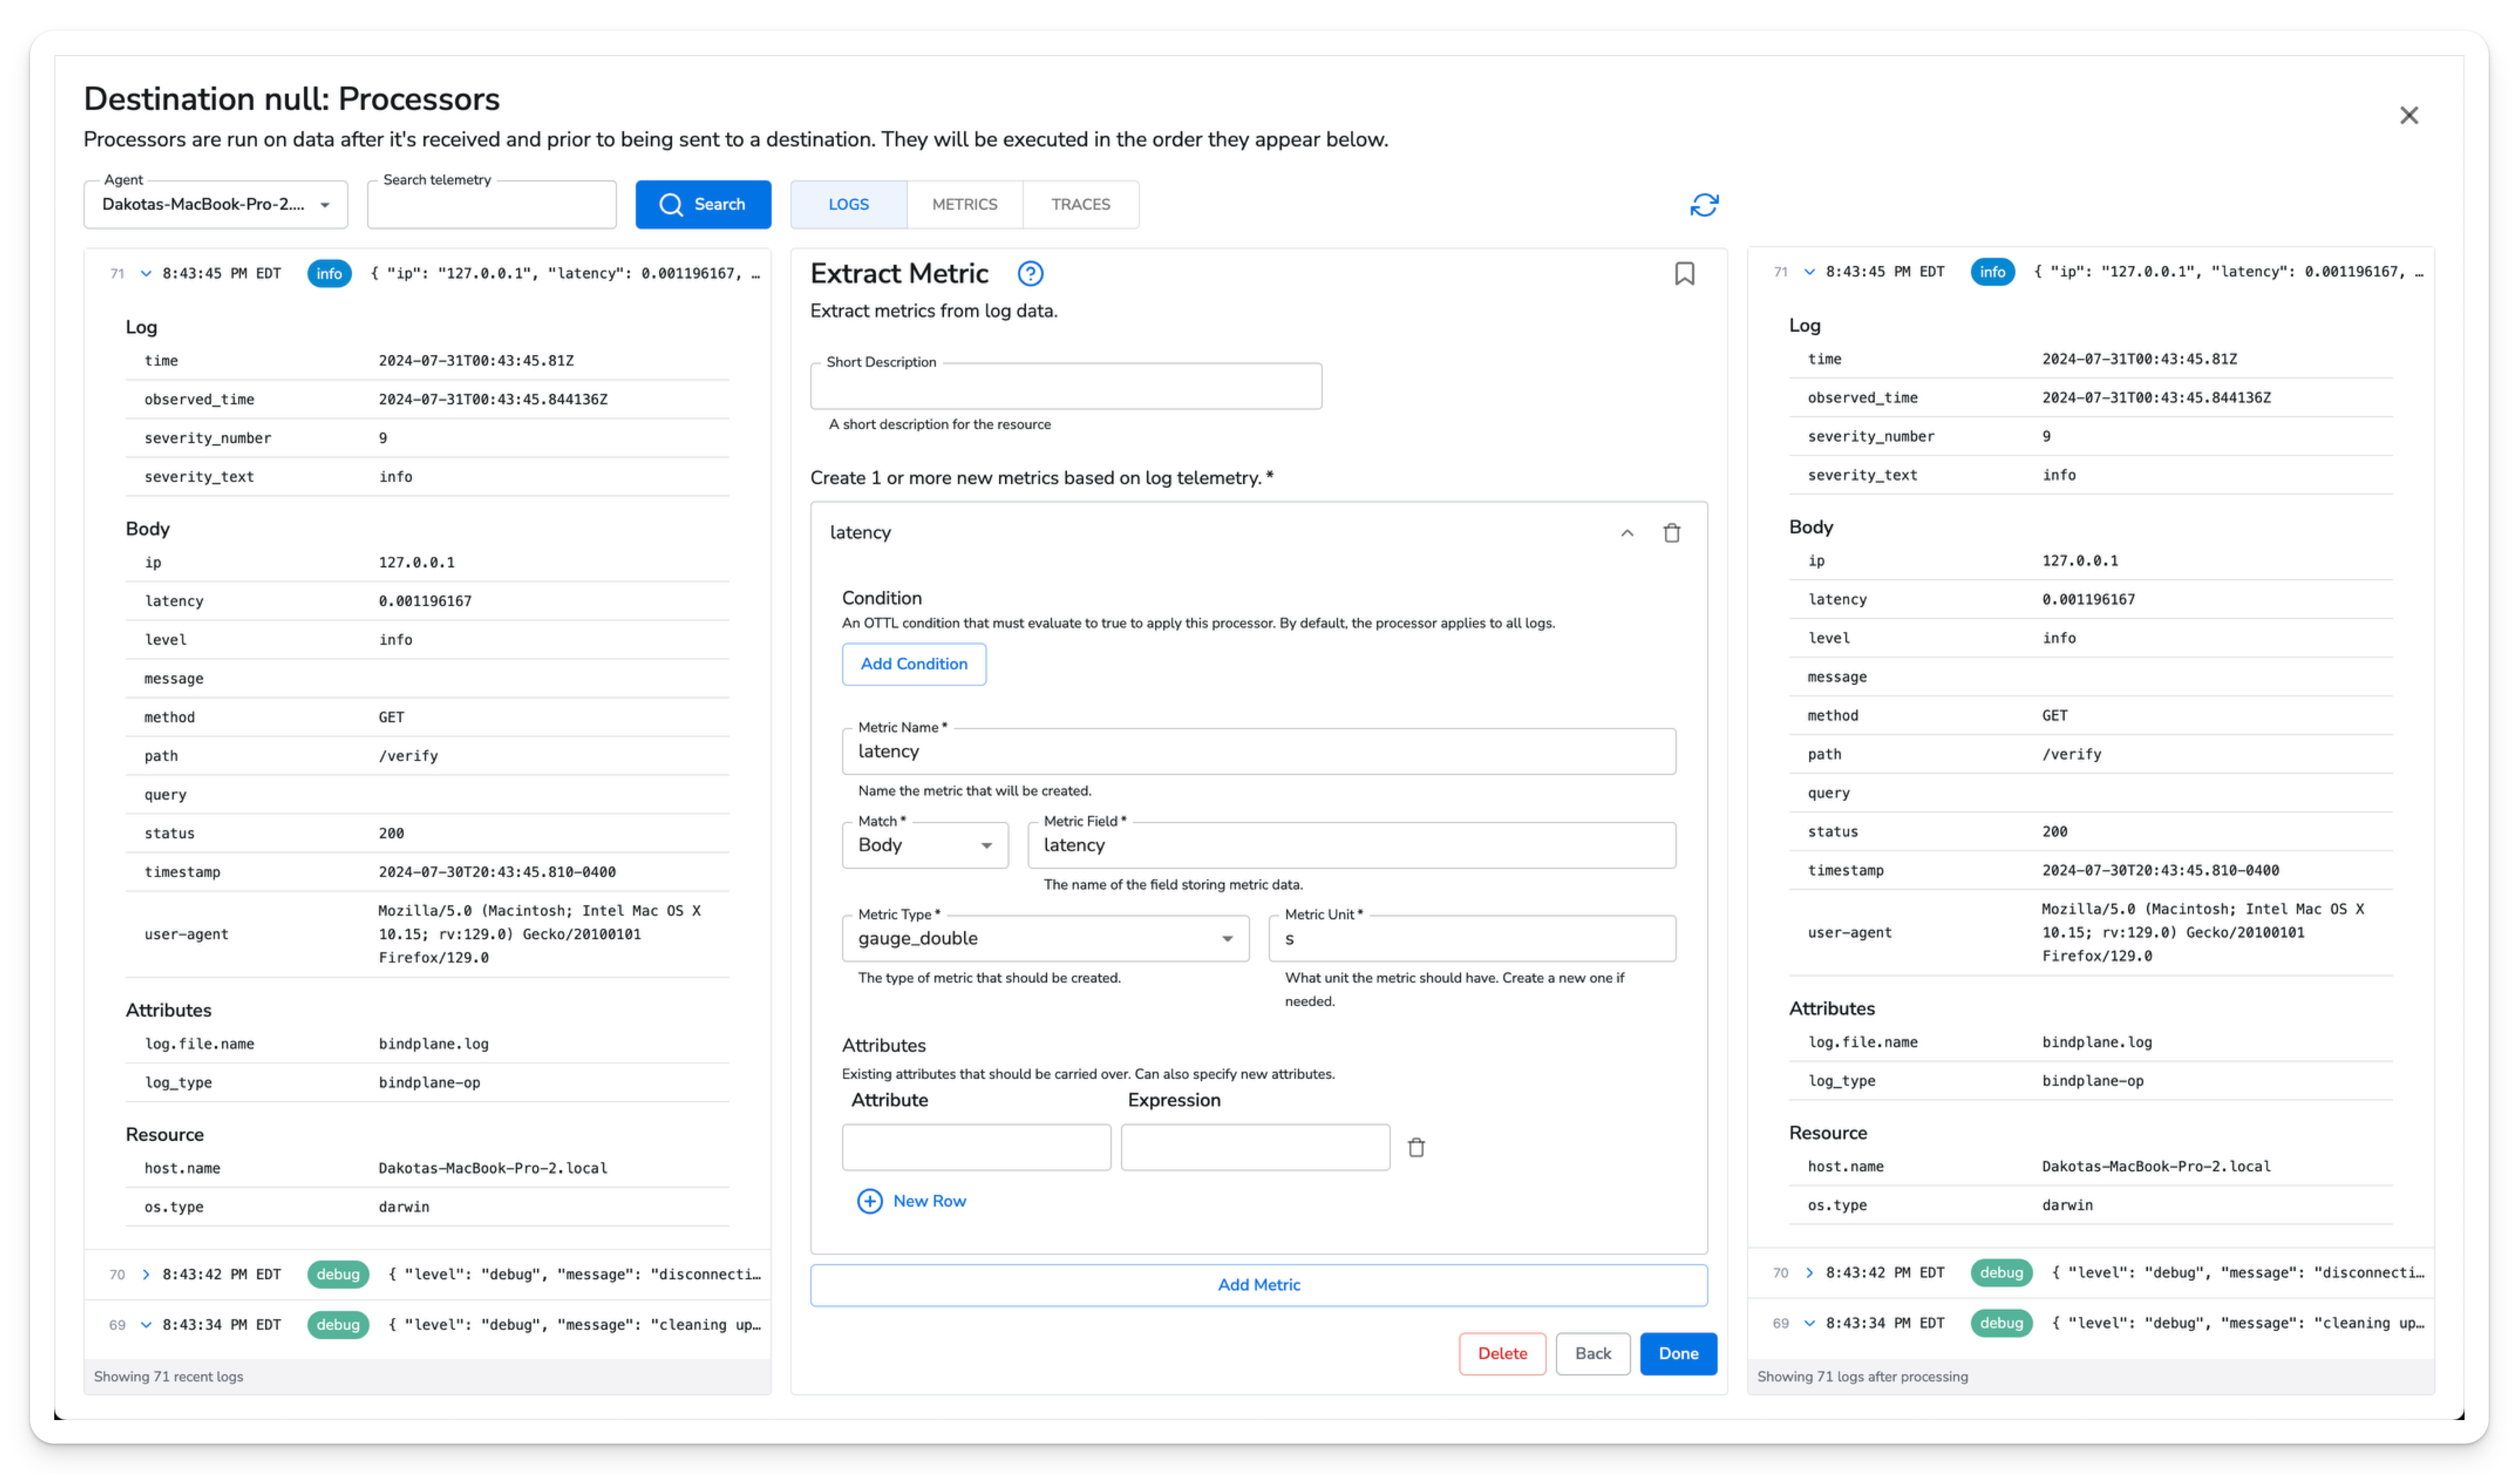
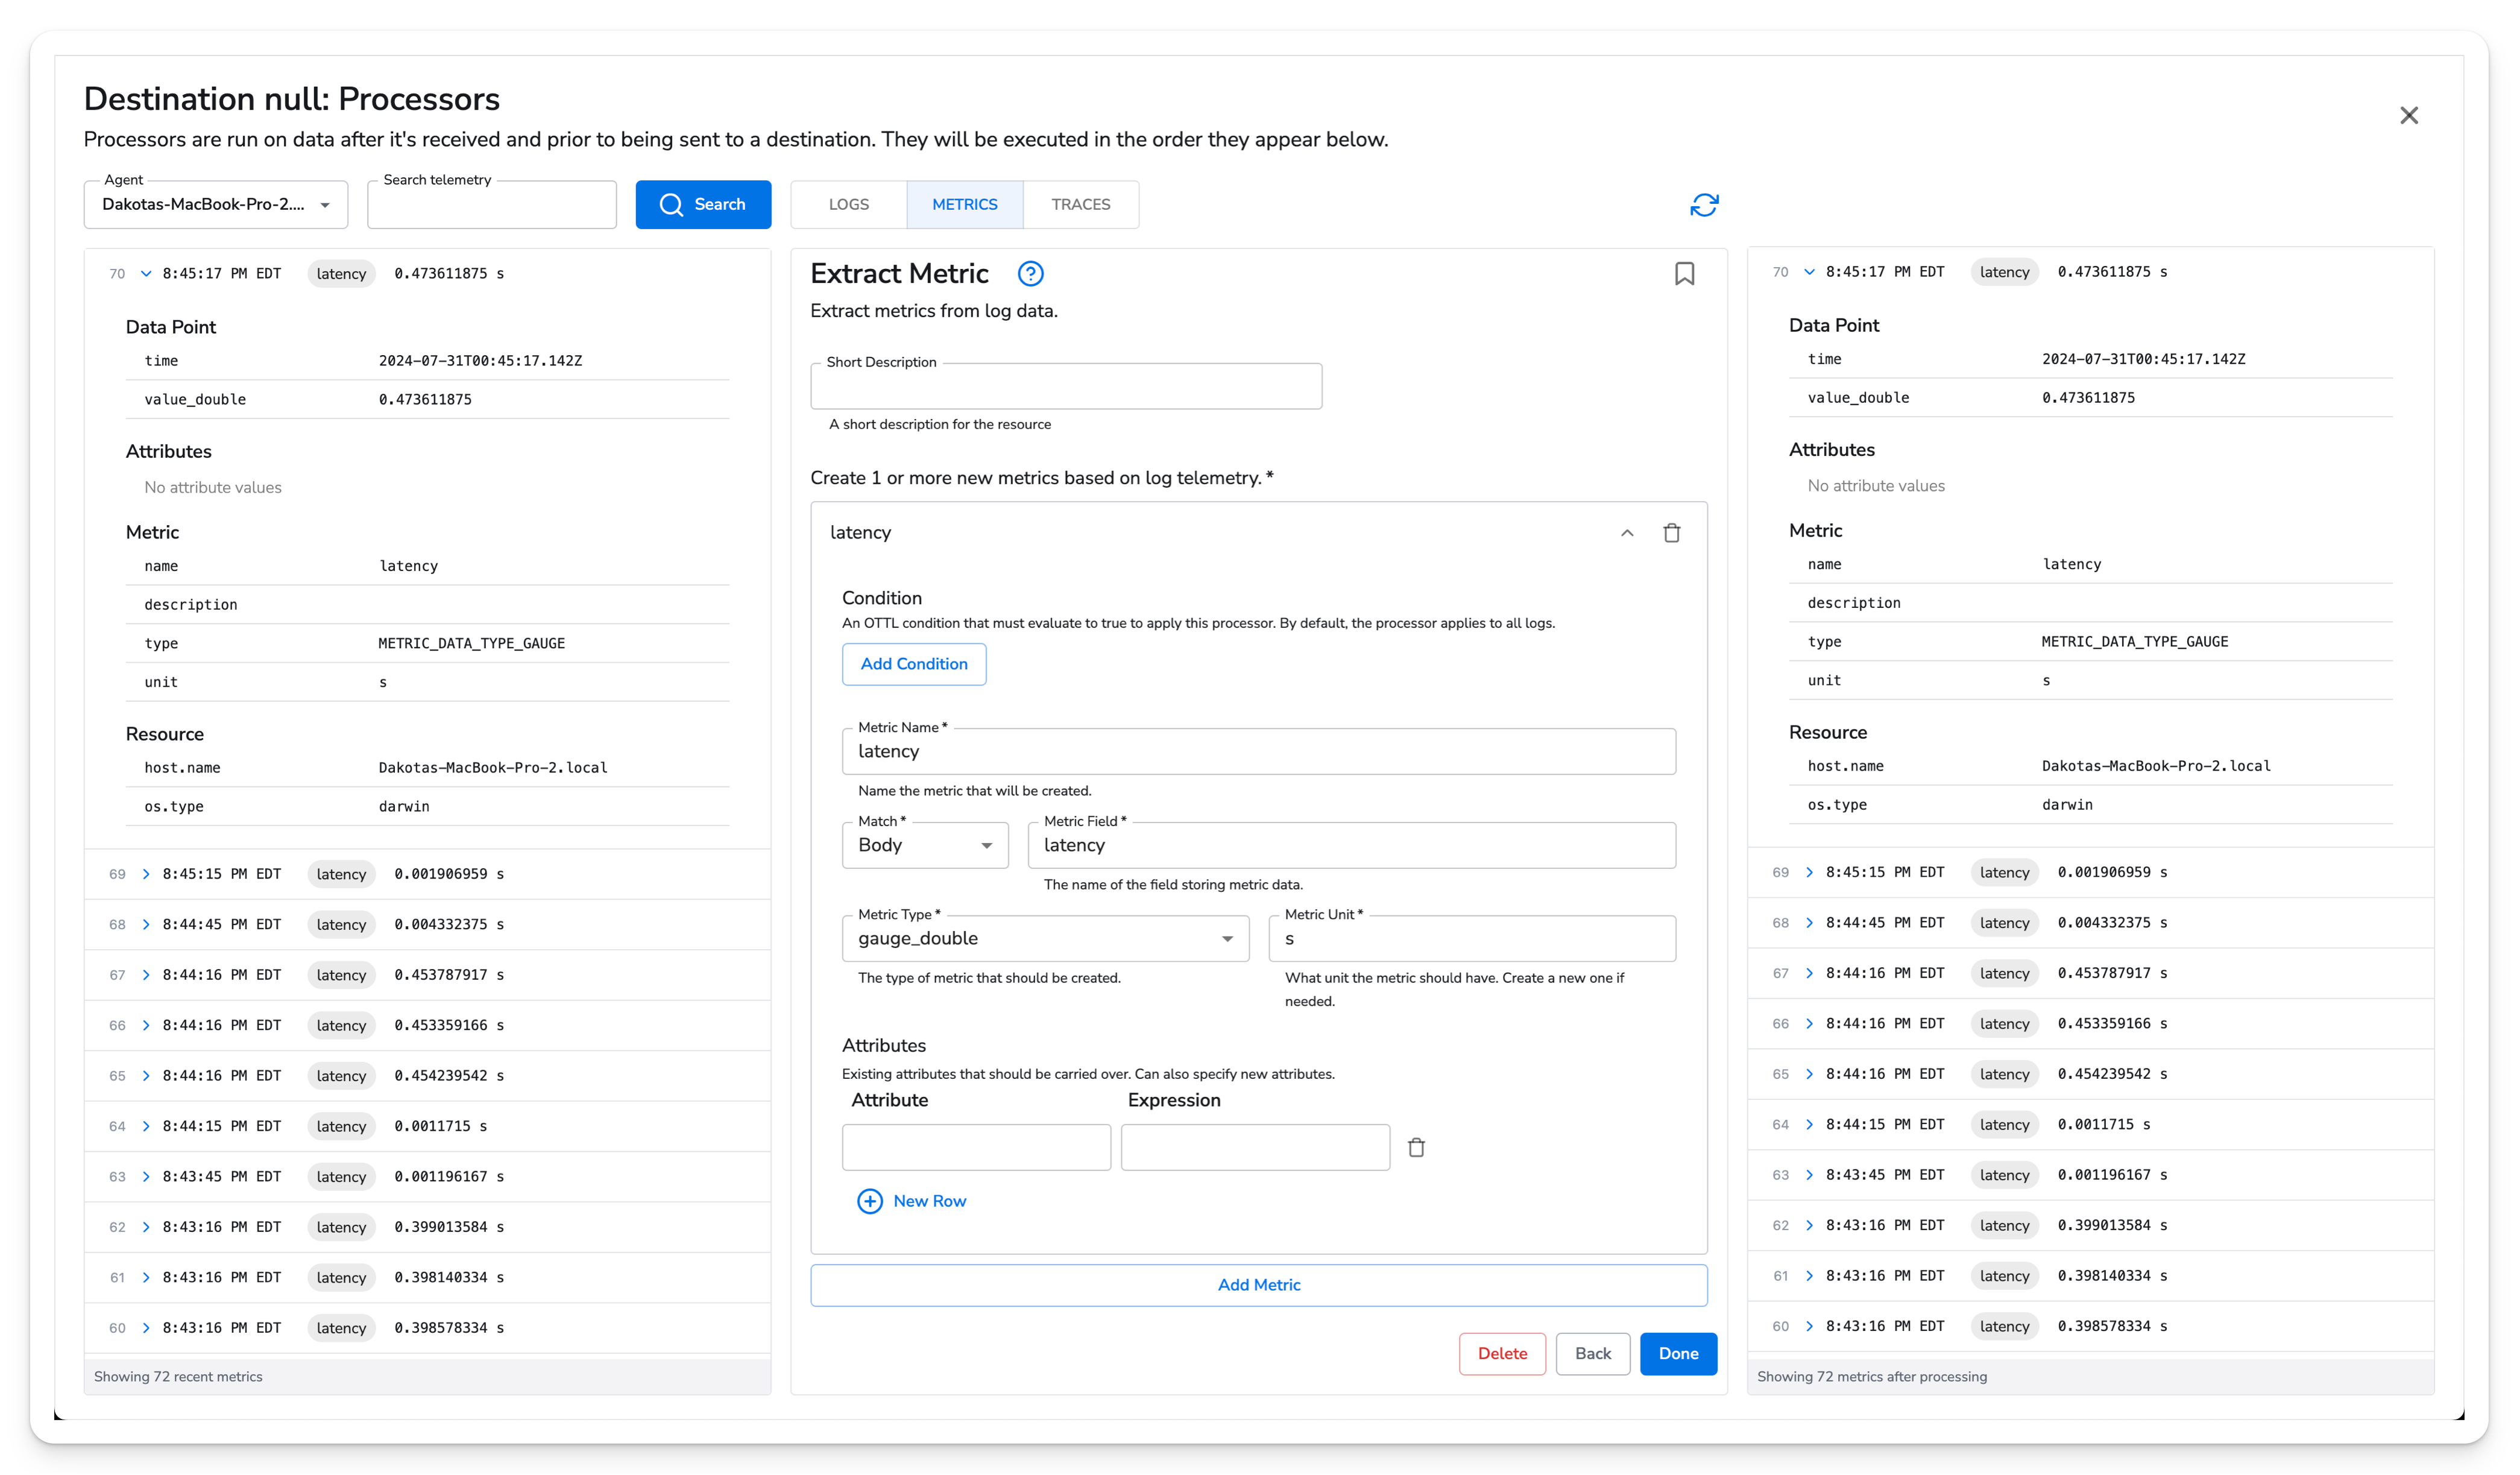
The configuration of an Extract Metric processor consists of a number of sub-metrics that are defined using fields described below.
Field | Description |
---|---|
Metric Name | The name of the metric that will be created. |
Match | The log context the source field is located in. Options are Body , Attributes , and Resource . |
Metric Field | The name of the source field containing a numeric value that will become the new metric value. |
Metric Type | The type of metric that will be created. Options are gauge_double , gauge_int , counter_double , and counter_int . |
Metric Unit | The unit of the created metric. Some default choices provided with the ability to create a custom unit. |
Attributes | Existing attributes on the source log that should be carried over. Can also specify new metric attributes. Each value is an OTTL path expression that extracts data from the log. |
In this configuration we are creating a new latency metric based on a field in the log body.
Here is the new latency
metric created as a gauge_double
with seconds set as the unit.
Now we can see the new metric in the snapshot view.