

This feature is in beta, and we would love your feedback!To opt in, join our Pollinators Community Slack and ping us in the
#discuss-metrics channel.
Pro and Enterprise users can also contact Honeycomb Support or email support@honeycomb.io.Introduction
Query Math adds support for multi-step queries in Honeycomb. You can now define multiple query steps, perform math between them, and visualize the final result—all inline in the Query Builder. This feature helps you express richer queries without creating temporary calculated fields. Instead of building complex calculated field expressions, you can break down your analysis into logical steps and combine them using simple mathematical formulas. Use Query Math to:- Calculate ratios and percentages directly in your query
- Combine multiple aggregates (for example, error counts and request totals)
- Perform time-series math with functions like
RATE()andINCREASE() - Simplify complex calculated fields into inline formulas
- Compare conditional aggregations side by side
How It Works
Query Math lets you create multiple query steps, such as Step A and Step B—each with its own SELECT, WHERE, and GROUP BY clauses. You can then define a formula that references these steps using variables like$A, $B, and so on.
When you run the query, Honeycomb:
- Executes each step independently.
- Evaluates your formula using the results from each step.
- Visualizes the final result.
Using Query Math
To build a query with Query Math:- Select Query () from the navigation menu.
- Select the
Metricsdataset. - Define your first step (Step A):
- Select fields in the SELECT clause.
- Add filters in the WHERE clause.
- Optionally, add groupings in the GROUP BY clause.
- Select Add Query to create additional steps (for example, Step B).
- Select Add Formula to define the mathematical relationship between your query steps.
- In the formula editor, reference your steps using
$A,$B, and so on, and combine them using mathematical operators. - Select Run Query to see the result.
All query steps must use the same GROUP BY dimensions.
For example, if Step A groups by
k8s.pod.name, then Step B must also group by k8s.pod.name.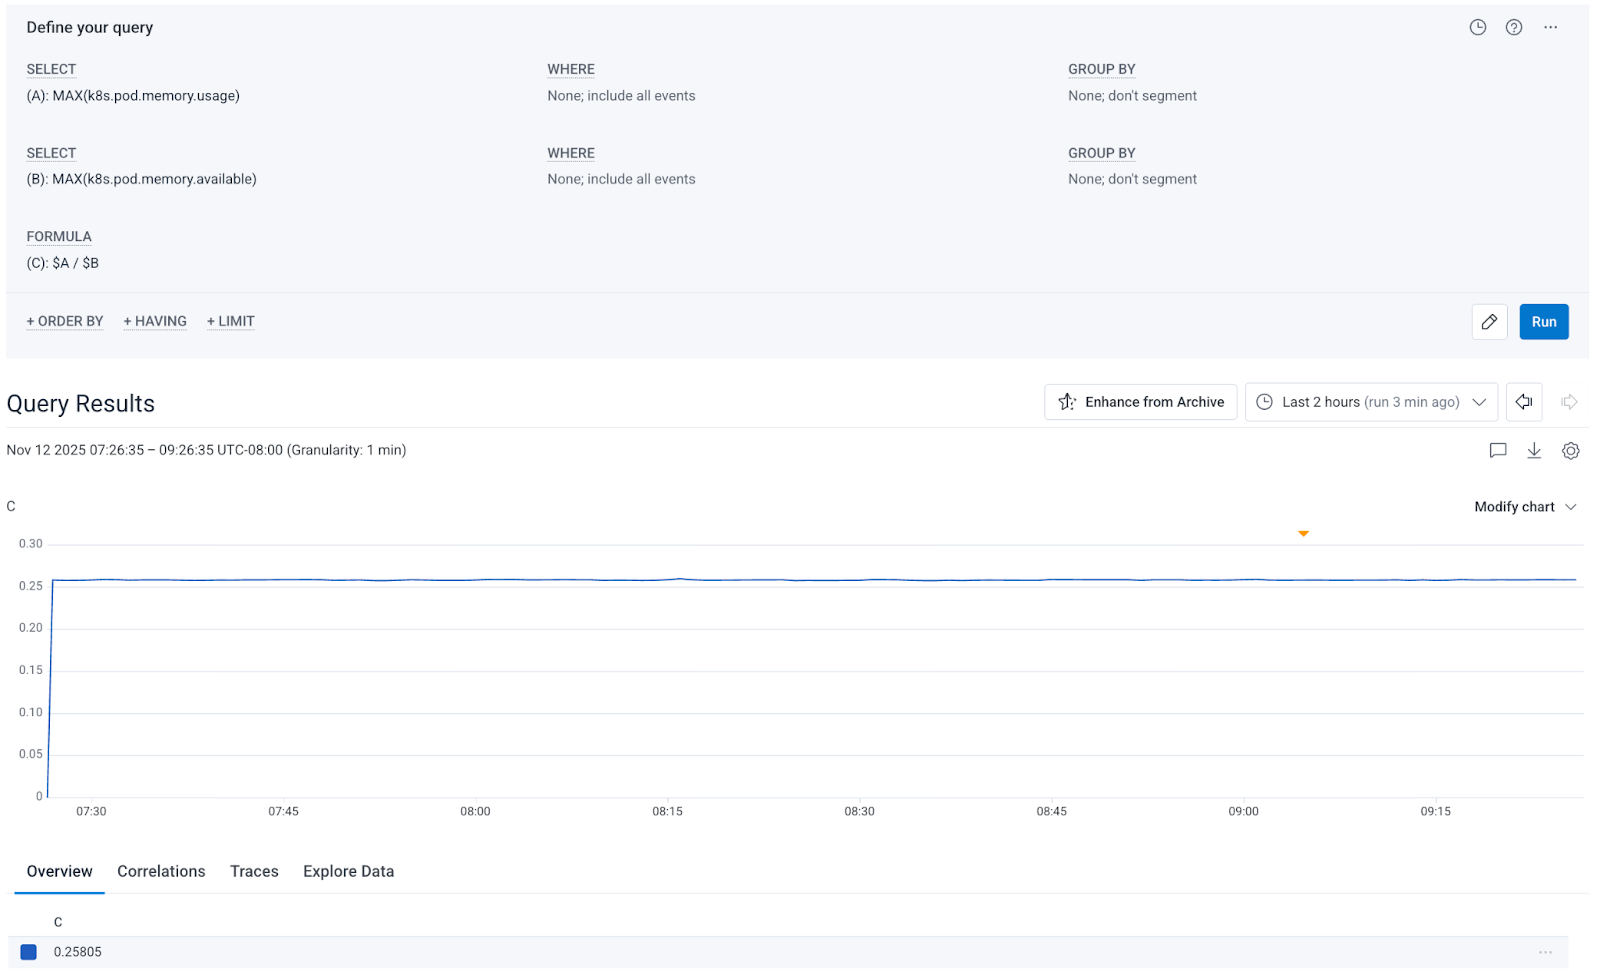
Supported Operators
Query Math supports standard mathematical operators in intuitive infix notation:| Operator | Description | Example |
|---|---|---|
+ | Addition | $A + $B |
- | Subtraction | $A - $B |
* | Multiplication | $A * $B |
/ | Division | $A / $B |
() | Parentheses for grouping | ($A + $B) / $C |
MULTIPLY(DIVIDE($A, $B), 100)) and easier to read at a glance.
Examples
These examples demonstrate common use cases for Query Math. Each shows how to structure your query stages and combine them with formulas.Error Rate
Compute the percentage of all requests that resulted in500 errors.
Step A:
SELECT COUNTWHERE status = 500
SELECT COUNT
Success Rate
Calculate the percentage of successful requests (non-error status codes). Step A:SELECT COUNTWHERE status < 400
SELECT COUNT
Memory Utilization Percentage
Calculate the percentage of available memory that is currently in use, which makes it easier to identify which pods are approaching capacity. Step A:SELECT MAX(k8s.pod.memory.usage)
SELECT MAX(k8s.pod.memory.available)
Request Rate Difference
Compare the request rate between two services, which can help you identify load imbalances. Step A:SELECT AVG(request_rate)(create query-scoped calculated fieldrequest_ratewith definitionRATE($http.server.requests))WHERE service.name = "api"
SELECT AVG(request_rate)WHERE service.name = "frontend"
CPU Usage Patterns
Combine different temporal aggregation functions to analyze metric behavior. This query compares the current CPU utilization snapshot against the rate of change, helping you understand CPU usage patterns. Step A:SELECT AVG(last_cpu)(create query-scoped calculated fieldlast_cpuwith definitionLAST($k8s.pod.cpu.utilization))
SELECT AVG(rate_cpu)(create query-scoped calculated fieldrate_cpuwith definitionRATE($k8s.pod.cpu.time))
Working with Groupings
When using GROUP BY in Query Math, all query steps must group by the same dimensions. This ensures that Honeycomb can align the results correctly when evaluating the formula. For example, if you want to calculate error rates per route: Step A:SELECT COUNTWHERE status >= 400GROUP BY http.route
SELECT COUNTGROUP BY http.route
http.route, producing a separate result for each route.
If your query steps have different GROUP BY clauses, the query will fail.
Ensure all steps use the same grouping dimensions before adding a formula.
Combining with Temporal Aggregation
Query Math works seamlessly with temporal aggregation functions. You can useRATE(), INCREASE(), SUMMARIZE(), and LAST() in your query steps, then perform math across the results.
For example, to calculate your error rate as a percentage of total throughput:
Step A:
SELECT SUM(error_rate)(create query-scoped calculated fielderror_ratewith definitionRATE($http.server.errors))
SELECT SUM(request_rate)(create query-scoped calculated fieldrequest_ratewith definitionRATE($http.server.requests))
Visualizing Results
When you add a formula to your query, only the formula result appears in the visualization. This keeps your charts focused on the final calculated value. If you want to see the individual step results alongside the formula:- Remove the formula temporarily.
- Run the query to see each step’s results independently.
- Add the formula back when ready.
Tips for Building Queries
Use these strategies to build effective Query Math queries:- Start simple: Build and test each query step individually before adding a formula.
- Use descriptive calculated field names: Names like
error_rateormemory_utilmake steps easier to understand. - Validate groupings: Ensure all steps use identical GROUP BY clauses to avoid query errors.
- Test incrementally: Add one formula operation at a time to isolate any issues.
- Use parentheses: Explicitly group operations to control evaluation order, especially in complex formulas.
Limitations
Keep the following constraints in mind when working with Query Math:- Query Math is available only for Metrics datasets. Support for Events datasets is coming in Q1 2026.
- All query steps must use the same GROUP BY dimensions. Re-aggregations across different groupings are not supported.
- When a formula is present, only the formula result is visualized. Remove the formula to see individual step results.
- Query Math is available only in the Query Builder UI. API and Trigger support is coming in Q1 2026.
- You cannot use the result of one step as input to another step.
What’s Next
Query Math is actively evolving based on user feedback. Upcoming improvements include:- Support for Events datasets (Q1 2026)
- API integration for programmatic queries (Q1 2026)
- Trigger support for alerting on formula results (Q1 2026)
- Enhanced visualization options for viewing individual query steps alongside formulas
Feedback Welcome
Query Math is in active beta, and your feedback shapes its development. We’d love to hear about:- Use cases where Query Math simplifies your workflow
- Limitations that block your analysis
- Formula patterns you find yourself using repeatedly
- Visualization improvements that would help your team
#discuss-metrics channel, or reach out to Honeycomb Support.