This feature is available as an add-on for the Honeycomb Enterprise plan.
This feature is in beta.
Please contact your Honeycomb account team for details.
What is Pipeline Health?
Pipeline Health is a monitoring tool that provides visibility into your telemetry pipelines. It tracks data flow through each pipeline stage, monitors component health, and displays configuration status, helping you verify that your pipelines work correctly and troubleshoot issues when they arise. From the Pipeline Health page, you can see incoming and outgoing telemetry data, inspect runtime details for each pipeline component, and review your pipeline’s active configuration.How It Works
Pipeline Health monitors your telemetry pipelines through automated data collection and a dedicated analysis environment.Data Collection
Pipeline Health collects telemetry data from your pipeline artifacts (Collectors, Refinery nodes, and the Beekeeper controller) and stores it in a dedicated Pipeline Telemetry Environment. This telemetry tracks data flow across each pipeline stage, component health, and configuration state.Pipeline Telemetry Environment
The Pipeline Telemetry Environment is a full-featured Honeycomb Environment that does not count against your event quotas. Because it is a full Honeycomb Environment, you can:- Create custom queries and Boards to analyze pipeline telemetry.
- Select any chart title to explore the underlying query.
- Set up SLOs to monitor pipeline performance.
- Configure Triggers to alert on pipeline issues.
- Use Canvas to ask questions about your pipeline data.
Accessing Pipeline Health
To access the Pipeline Health page for a specific pipeline:- Select Manage Data () from the navigation menu, and choose Pipelines.
- Select the pipeline you want to monitor.
- Select the Health view.
Monitoring Data Flow
Your pipeline processes telemetry data through multiple stages. Pipeline Health gives you visibility into each stage, so you can understand data volume changes and quickly identify issues.Receiving Data
The Incoming Data section shows the volume of telemetry entering your pipeline at the Receive () stage of your pipeline configuration, before any processing occurs.
Processing Data
The Data Exiting Processing section shows the volume of telemetry leaving the Process () stage of your pipeline, after it has passed through any configured processors, such as filters or deduplication rules.
Sampling Data
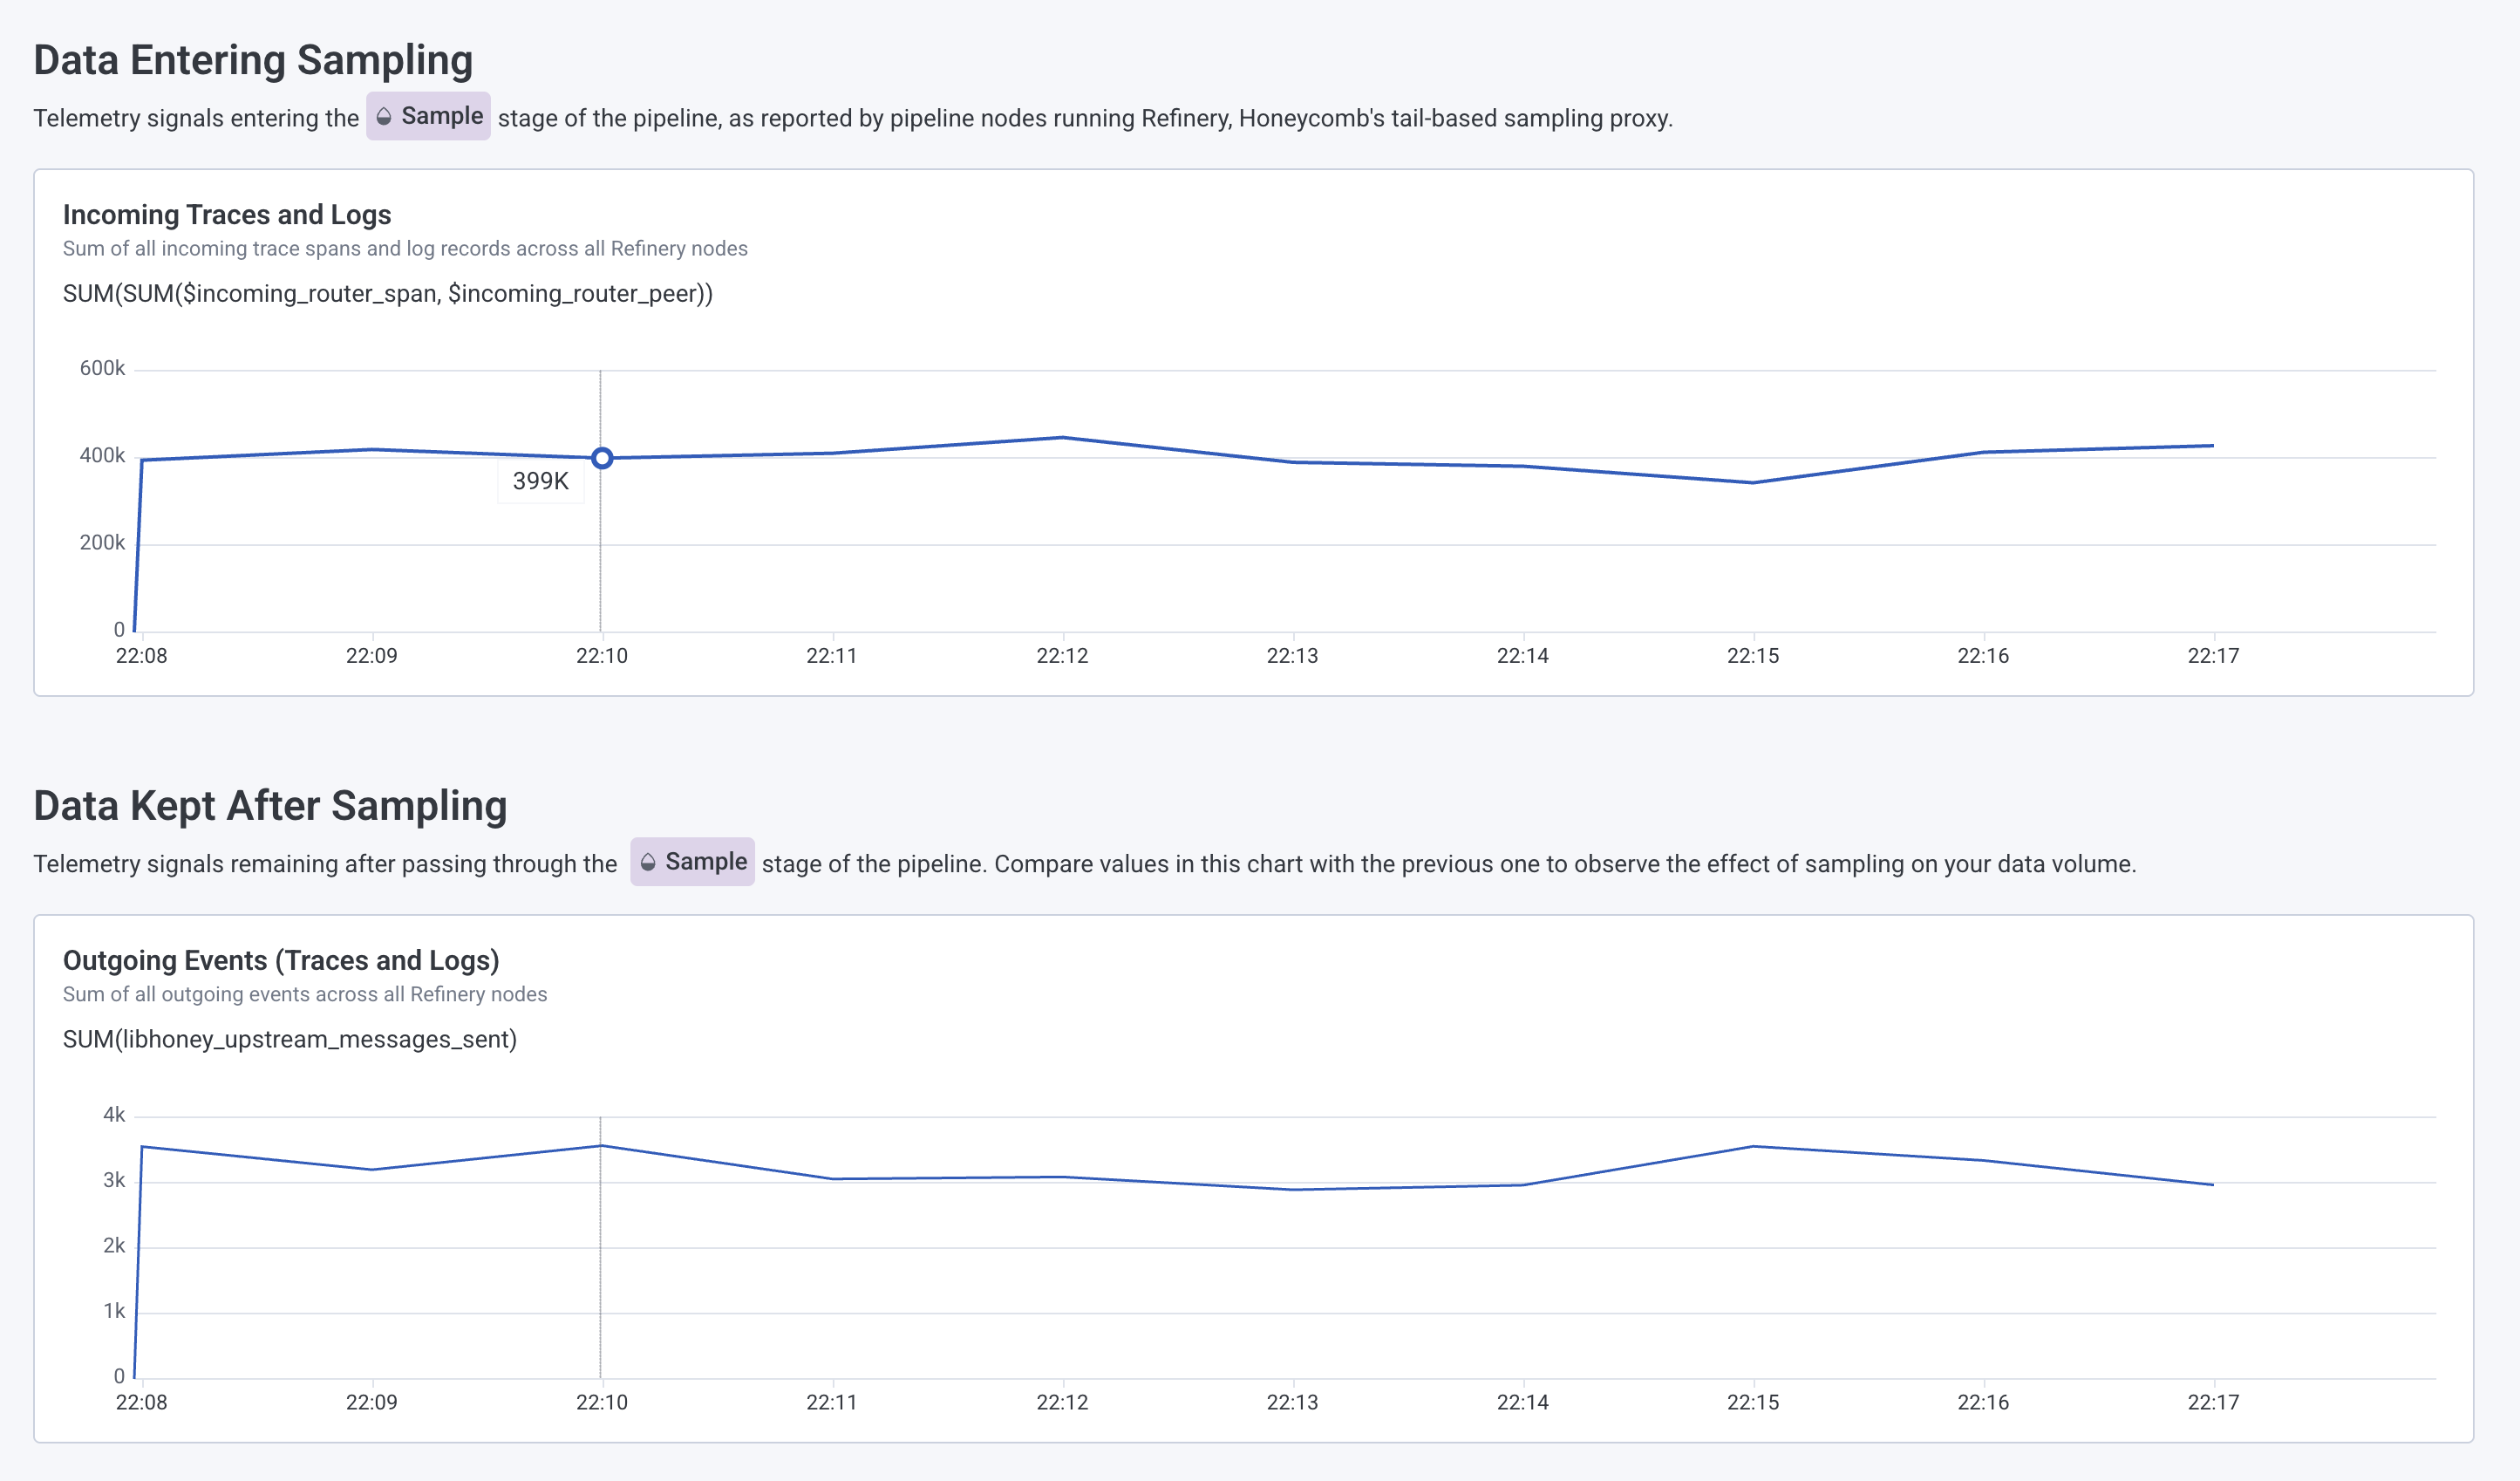
The Data Entering Sampling and Data Kept After Sampling sections show the volume of telemetry entering and remaining after the sampling process completes in the Sample () stage in your pipeline configuration.
Sending Data to Destinations
The Outgoing Data by Destination section shows where your telemetry is sent after leaving your pipeline, which corresponds to the Send () stage in your pipeline configuration.
Monitoring Pipeline Components
Track the health of your pipeline infrastructure to verify deployments, diagnose issues, and monitor resource usage.Configuration Status
The Reported Configuration section displays the configuration currently running on each of your pipeline artifacts, including Collectors and Refinery nodes.
Agent Deployment Status
The Deployed Agents section shows the number of Collectors and Refinery nodes running in your pipeline, grouped by configuration version. During a configuration rollout, you may briefly see multiple versions running simultaneously as updates gradually propagate.
Agent Health
The Agent Health Reporting section displays health check information from your pipeline agents. Each agent reports its health status to the Beekeeper controller.
Artifact Details
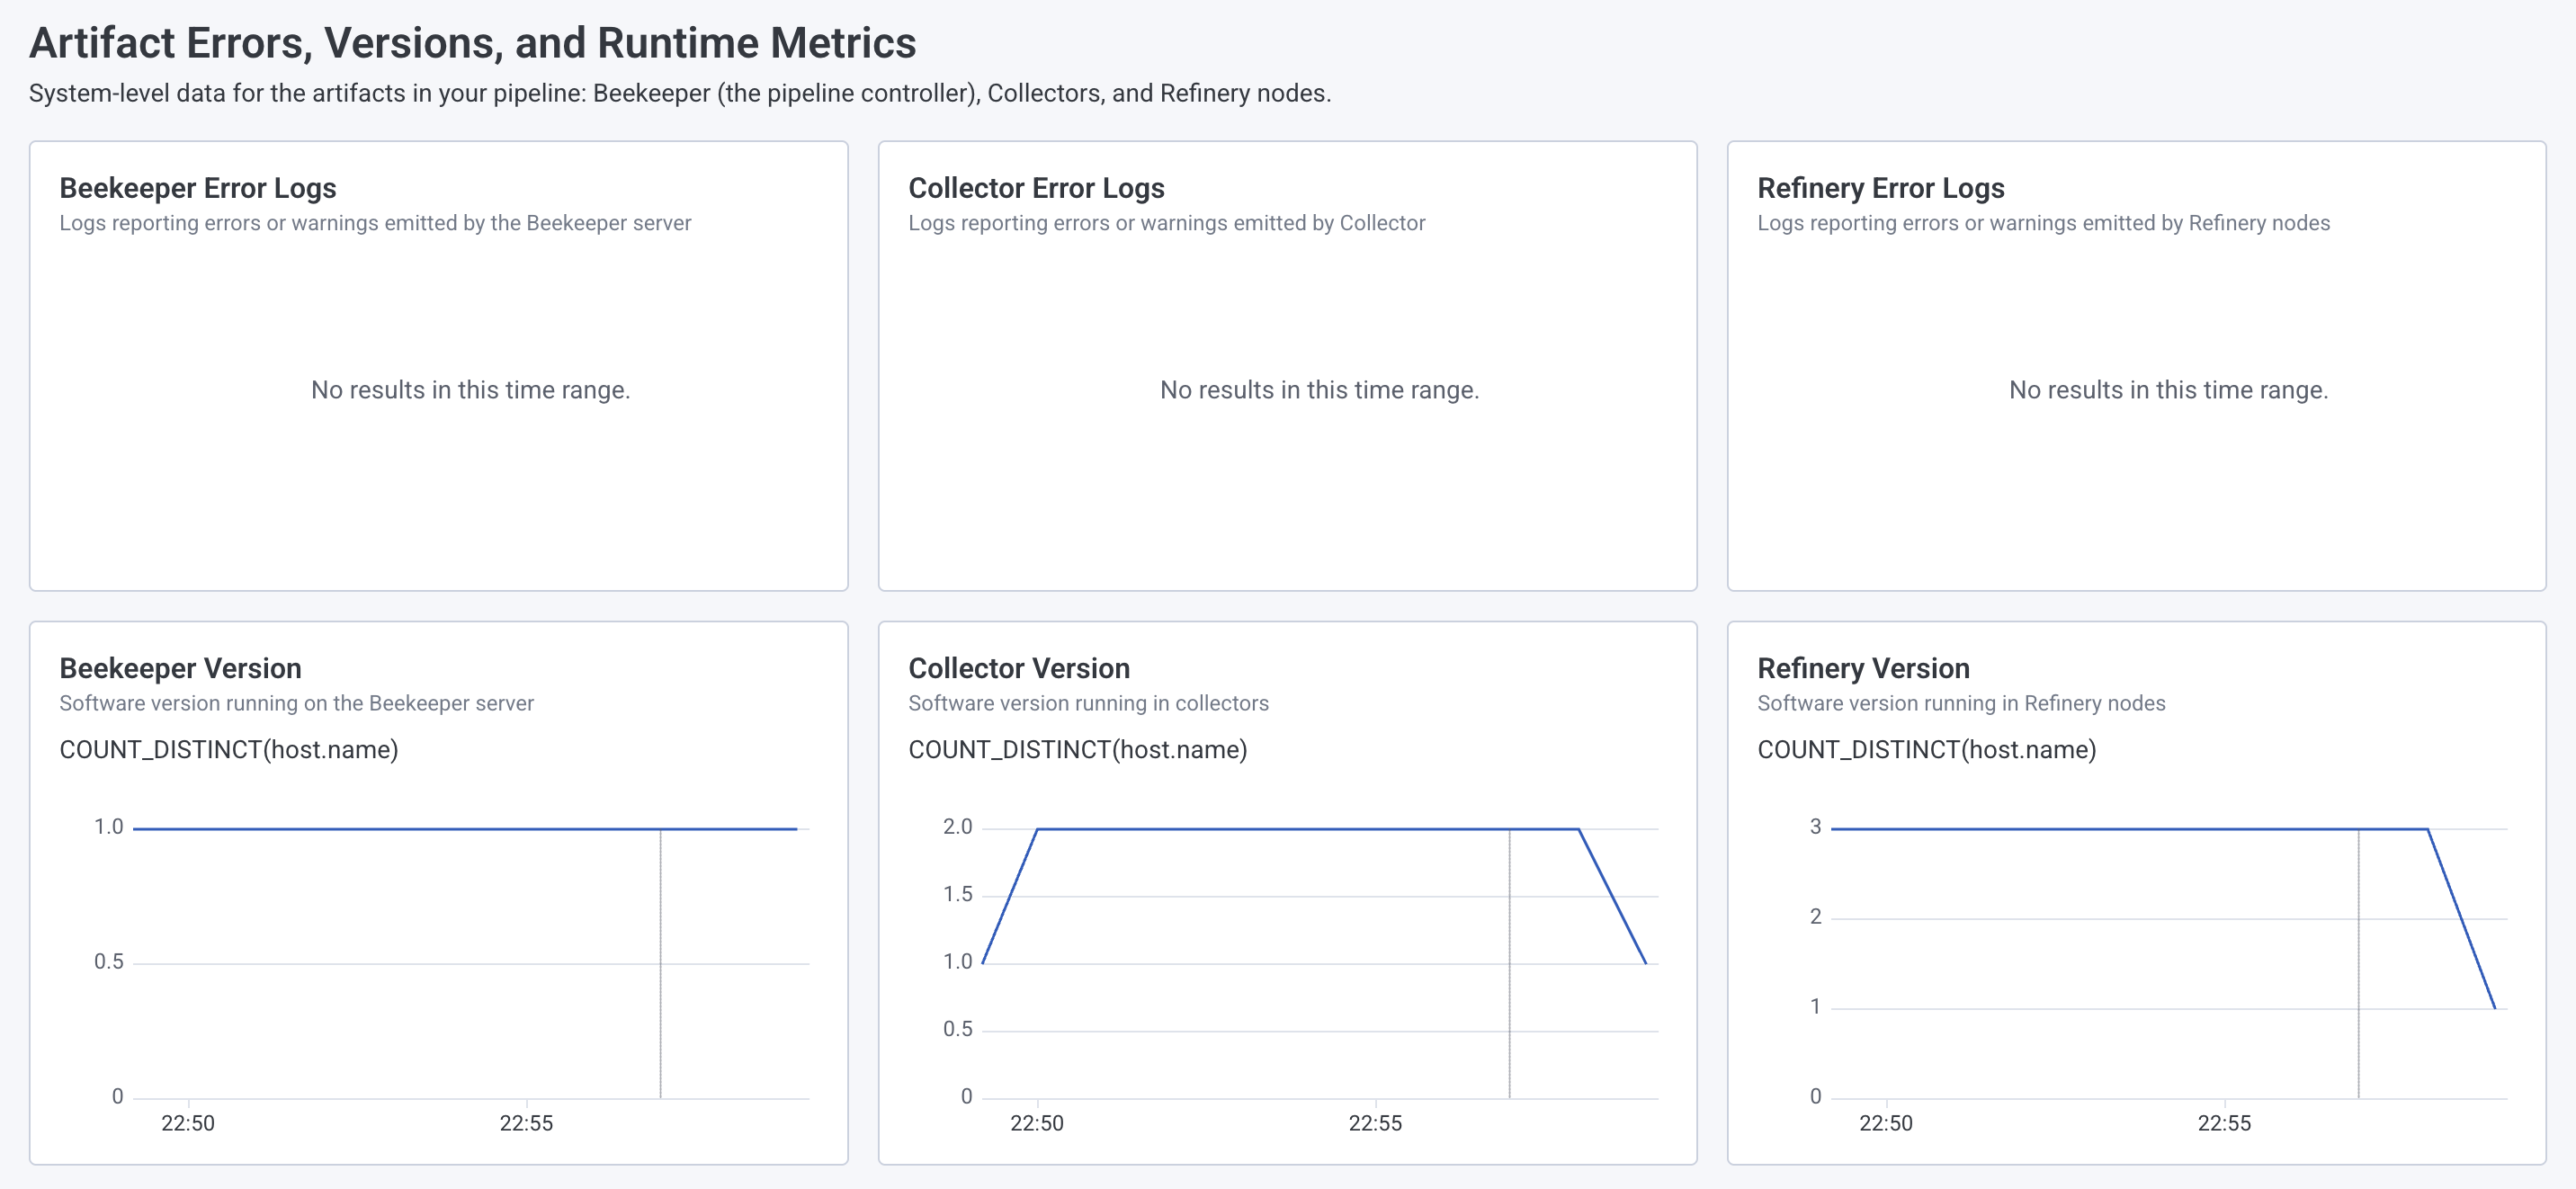
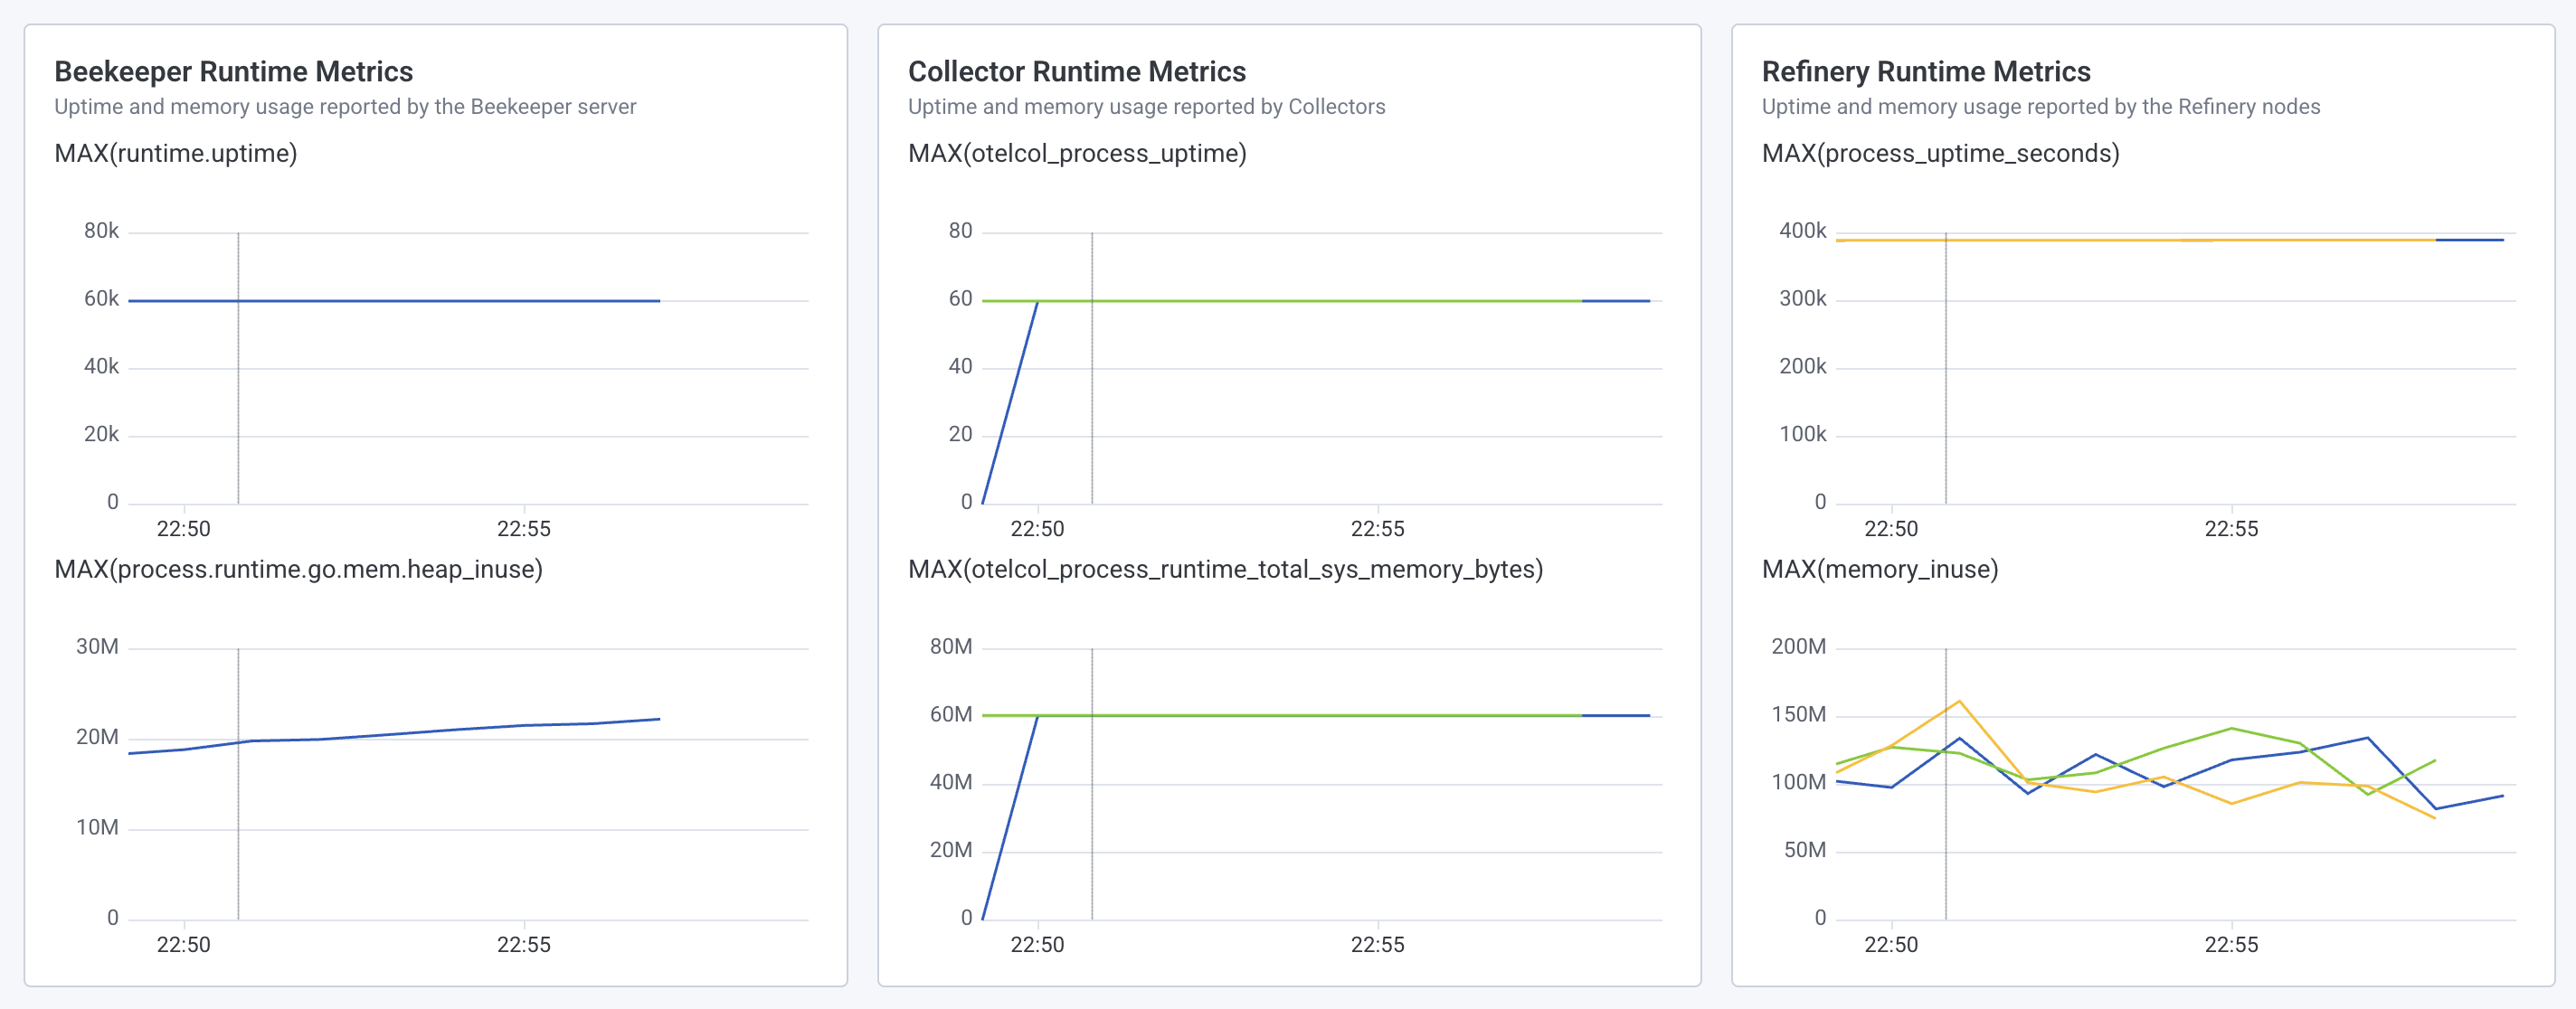
The Artifact Errors, Versions, and Runtime Metrics section provides detailed information for each type of artifact in your pipeline: the Beekeeper controller, Collectors, and Refinery nodes. For each artifact type, you can view:- Error Logs: Any errors reported by the artifact.
- Version: The version of the underlying technology (for example, the OpenTelemetry Collector version or Refinery version).
- Runtime Metrics: Uptime and memory usage trends.

