Use the Trigger examples below when creating a trigger. The specific attributes in each example may or may not exist in your data and environment.
Each example contains:
The example Trigger Queries use the three VISUALIZE, WHERE, and GROUP BY clauses, located at the top of the Query Builder display.
VISUALIZE - Performs a calculation and displays a corresponding graph over time. Most VISUALIZE queries return a line graph while the HEATMAP visualization shows the distribution of data over timeWHERE - Filters based on attribute parameter(s)GROUP BY - Groups fields by attribute parameter(s)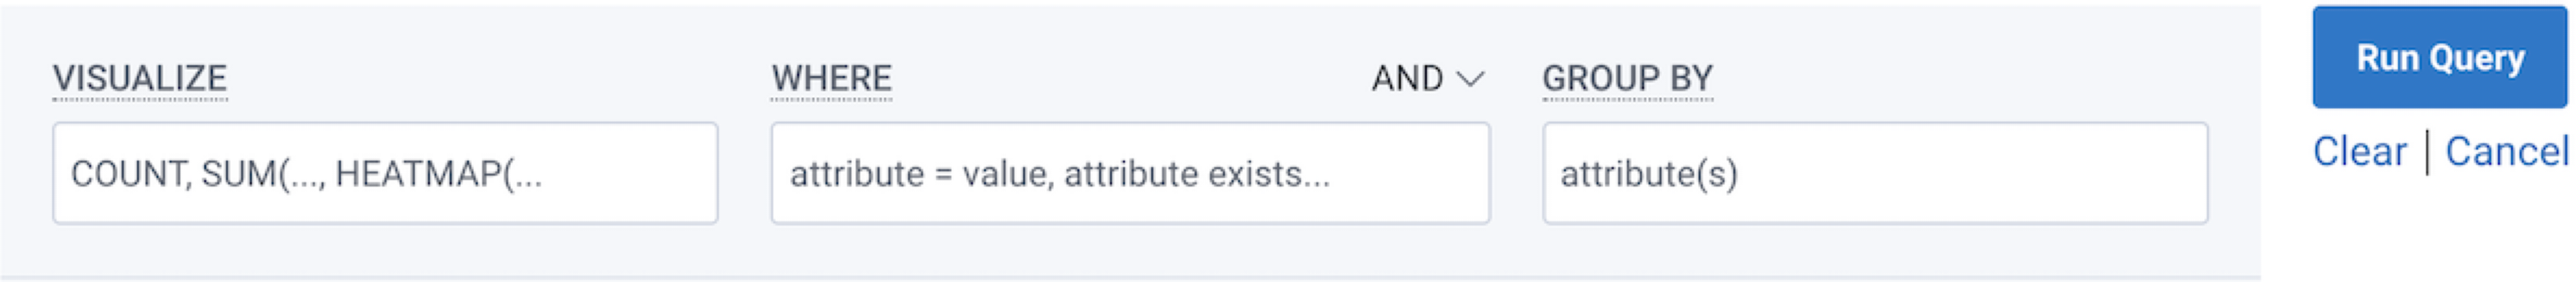
Slow response times can be frustrating and also indicate potential problems with your service. Use these trigger examples to alert your team if response times exceed a certain threshold.
The query calculates the 95th percentile of the total duration of the traces in your application, in seconds, and checks if it is greater than 550 ms. Use to alert if a significant number of the traces in the application are taking longer than the highest expected range to complete.
| VISUALIZE | WHERE | GROUP BY |
|---|---|---|
| P95(duration_ms) | is_root | name |
| THRESHOLD |
|---|
| > 550ms |
The threshold for your alert for p90 database calls should be based on the expected performance of your database, and the requirements of your application.
If the expected performance of the database is known, set the alert threshold to a value that is slightly higher than the expected performance, and also give some margin for error or variability.
| VISUALIZE | WHERE |
|---|---|
| P90(duration_ms) | db.statement exists |
| THRESHOLD |
|---|
| > 550ms |
High error rates can be an indication of underlying issues that are affecting the performance and stability of your service, and can help identify areas for improvement. Monitoring specific errors can also provide valuable insights into the types of issues that are occurring, and can help you understand the root causes of those errors.
Adjust the threshold of exceptions (higher or lower than 500 occurences) to fit the specific needs of your application, and to ensure that the alert is effective at identifying potential issues.
| VISUALIZE | WHERE | GROUP BY |
|---|---|---|
| COUNT | exception.type exists | exception.type |
| THRESHOLD |
|---|
| > 500 |
Or, for specific exceptions:
| VISUALIZE | WHERE | GROUP BY |
|---|---|---|
| COUNT | exception.type = {push-notification-send-failure} | user.id |
| THRESHOLD |
|---|
| > 0 |
This type of alert can be set up to trigger when a certain number of errors are generated by a specific tenant on a particular endpoint.
For example, you could set up an alert to trigger when the number of errors generated by tenant “XYZ” on endpoint “/api/users” exceeds a certain threshold, such as 500 errors in an hour.
Use this trigger example to identify potential issues that are affecting a specific tenant, and take action to address those issues.
| VISUALIZE | WHERE | GROUP BY |
|---|---|---|
| COUNT | error exists | app.tenant_id |
| THRESHOLD |
|---|
| > 0 |