Hands-On Lab: Build a Telemetry Pipeline for Testing

Clone the Repository 

  1. Before you begin, clone the Refinery Hands-On Lab GitHub repository and switch to the main branch. Run the following commands in the terminal.
git clone https://github.com/honeycombio/academy-intro-refinery.git
cd academy-intro-refinery

Add Your Honeycomb Ingest Key 

  1. Open the 
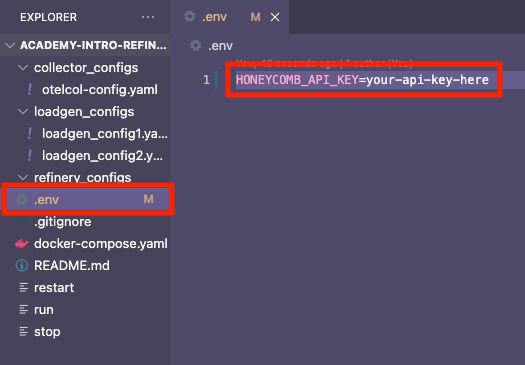
.env file in the root of the repository.
  2. Paste your Honeycomb Ingest API Key where indicated:
HONEYCOMB_API_KEY=your-api-key-here
Screenshot of `.env` file

What Does loadgen Do? 

  1. loadgen is a small Go binary that generates synthetic telemetry.
  2. As long as the configuration stays the same, it produces very similar traffic each time you run it.
  3. This consistency makes it ideal for comparing unsampled vs. sampled data in Honeycomb.

Docker Compose Setup 

  1. Open the docker-compose.yaml file.
  2. The setup includes:
    • Two loadgen containers
    • An OpenTelemetry Collector
    • A Honeycomb destination
  3. Traffic is sent using the OpenTelemetry Protocol (OTLP) over gRPC.

loadgen Configurations 

  1. Open the loadgen configuration files.
  2. Each config defines:
    • Dataset name
    • Service name
    • Span depth
    • Spans per trace
    • Trace duration
    • Trace rate (e.g., 1,000 traces per second for 2 minutes)
Tip
loadgen2 includes three app functions. The third function will have less traffic—this becomes important when analyzing sampling behavior later.

OpenTelemetry Collector Config 

  1. Open the collector_configs/otelcol-config.yaml file.
  2. This configuration is simple, but includes one helpful enhancement:
    • It extracts app.function and app.endpoint fields from the generated URL.
    • This makes it easier to query and define sampling rules in Honeycomb and Refinery.

Run the Environment 

Use the run script to launch all services:

./run

This starts both loadgen instances, the OTel collector, and routes traffic to Honeycomb.

Explore the Data in Honeycomb 

  1. Open the Honeycomb UI.

  2. Set the time range to the last 10 minutes.

  3. Run a query with the following conditions:

    • WHERE clause: app.function exists
    • GROUP BY: app.function, app.endpoint
  4. Expected results:

    • You will see three distinct app.function values
    • You will see many more app.endpoint values
    Screenshot of a query filtered by `app.function exists` and grouped by `app.function` and `app.endpoint`
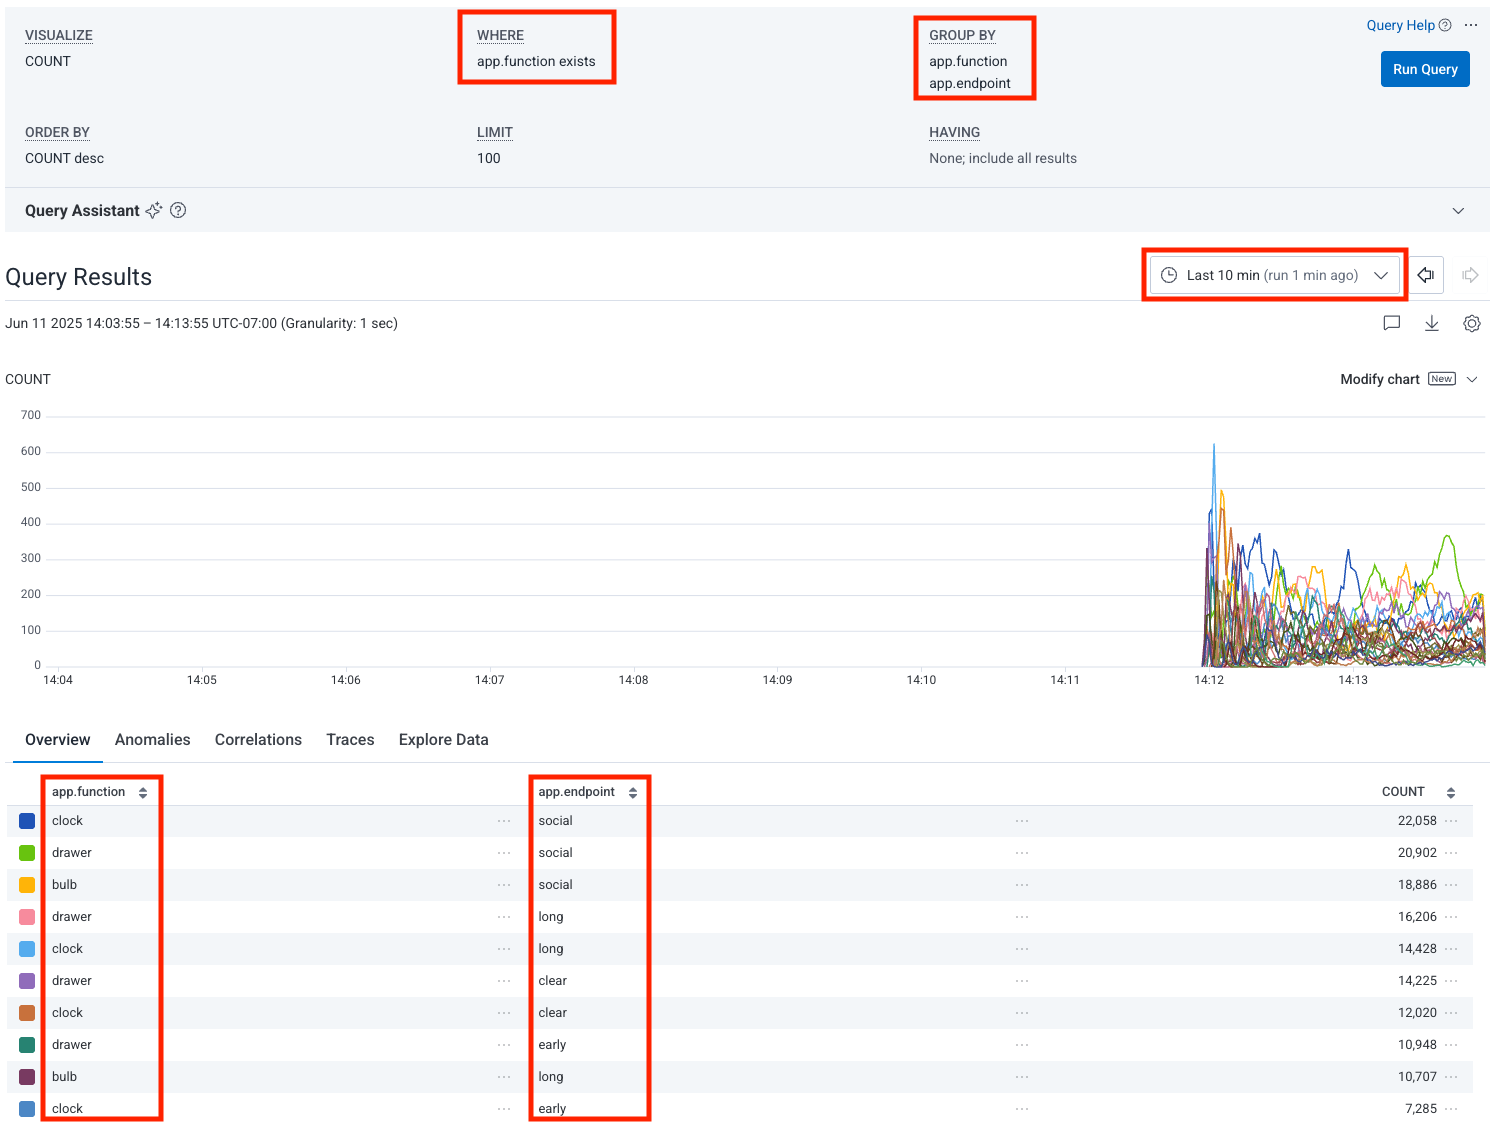
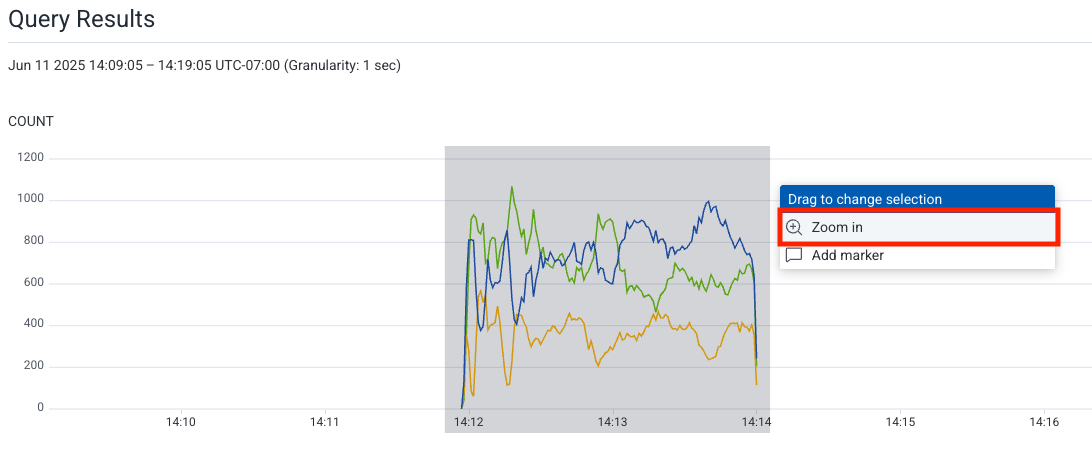
  5. Now simplify the query:

    • Remove app.endpoint
    • Group only by app.function

Observe Traffic Patterns 

  1. Keep the time range within the same 10-minute period. Select the area on the graph where you see activity. Then select Zoom in.

    • Notice that you are now viewing a custom time range with an absolute time.
    Screenshot of selecting and zooming into a specific time period
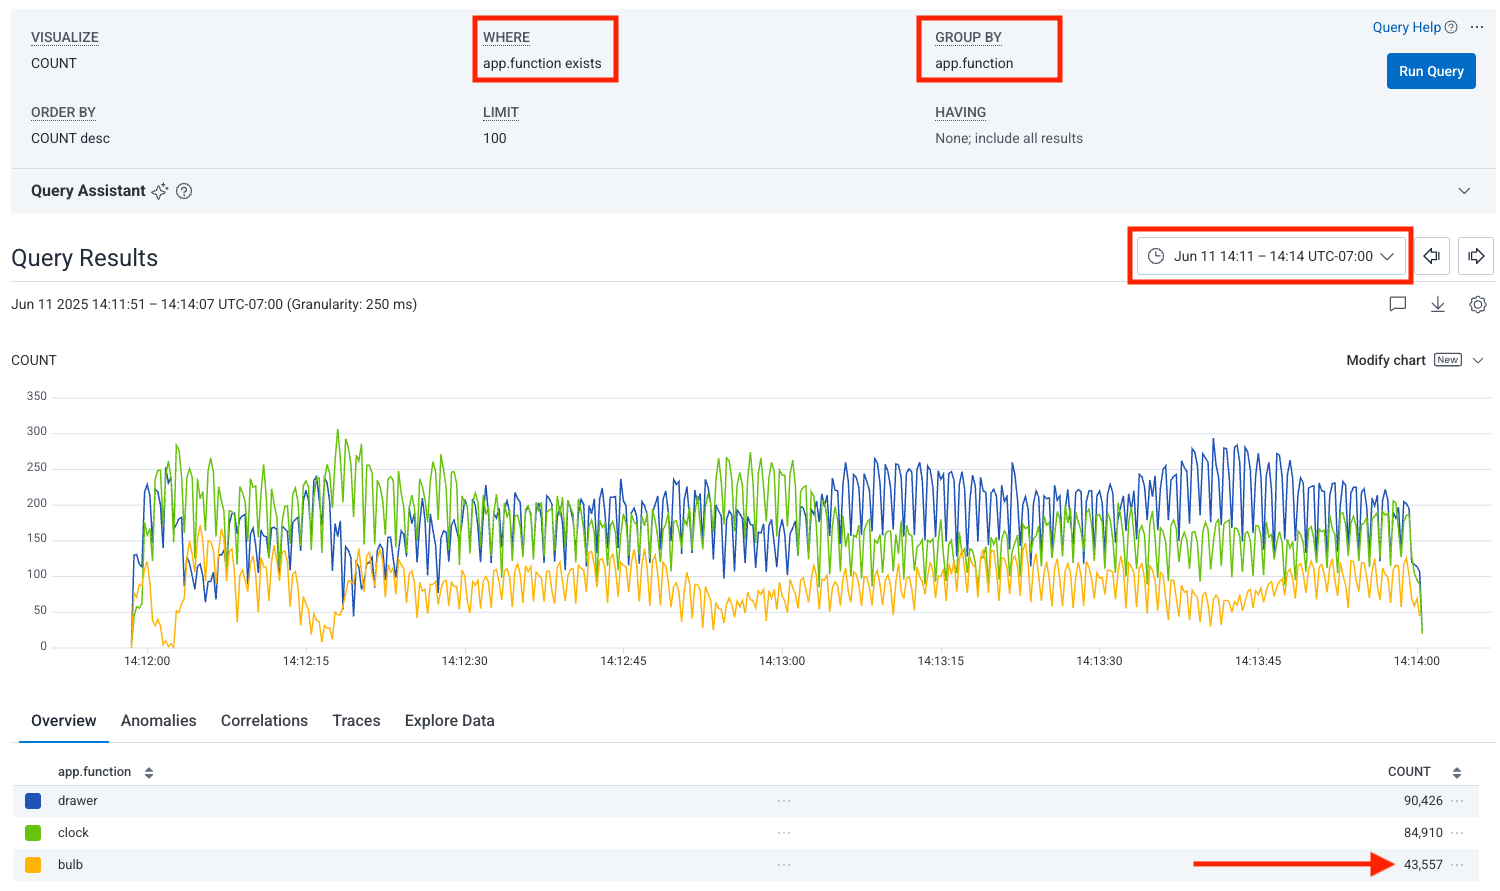
  2. The third function (from loadgen2) will show less volume.

  3. This creates a controlled baseline to help you observe how sampling changes the shape of your data.

    Screenshot of a query filtered by `app.function exists` and grouped by `app.function`

Shut Down the Environment 

  1. Once the loadgen containers finish (after 2 minutes), stop the environment.
./stop

Recap 

  • You generated consistent trace traffic using loadgen, explored that data in Honeycomb, and prepared your environment to test Refinery’s sampling behavior.