

Basic Configuration
The Collector consists of three components: receivers, processors, and exporters, which are then used to construct telemetry pipelines. To configure the components for the Collector, create a file calledotel-collector-config.yaml.
Receivers
Add receivers for OTLP trace output from applications instrumented with OpenTelemetry:Processors
Include a batch processor to batch telemetry before sending to Honeycomb:Exporters
Configure an OTLP exporter with the Honeycomb API Key as a header:Service Pipelines
Finally, configure a service pipeline for traces:Full Configuration File For Basic Usage
The final result of adding receivers, processors, exporters, and pipelines will look like this:If you are a Honeycomb Classic user, the Dataset also must be specified using the
x-honeycomb-dataset header in the exporters section, in the line below the x-honeycomb-team.
A Dataset is a bucket where data gets stored in Honeycomb.Metrics and Logs Signals
The Collector can handle OTLP metrics and logs signals in addition to traces. Metrics require a dataset in the exporter. Logs will use theservice.name associated with the trace from which it originated, or a dataset if provided.
It is possible to send these to the same or to multiple places in Honeycomb.
To set a different pipeline with the same type of exporter, append the exporter with /my-pipeline.
The following example exports OTLP application metrics to a specified dataset, and exports logs to the same place as traces.
Browser Telemetry
To receive browser telemetry, the Collector requires an enabled OTLP/HTTP receiver. Theallowed_origins property is required to enable Cross-Origin Resource Sharing (CORS) from the browser to the collector.
The Collector will need to be accessible by the browser.
It is recommended to put an external load balancer in front of the collector, which will also need to be configured to accept requests from the browser origin.
You can also configure the Collector to symbolicate your JavaScript stack traces. This translates obfuscated or minified names from your stack traces into human-readable formats.
In the example below, the configuration allows for the OpenTelemetry Collector to accept browser OpenTelemetry tracing, and is required to get data from the browser to Honeycomb.
If you are a Honeycomb Classic user, the Dataset also must be specified using the
x-honeycomb-dataset header in the exporters section, in the line below the x-honeycomb-team.
A Dataset is a bucket where data gets stored in Honeycomb.Symbolicate Web, iOS, Android, and React Native stack traces
Honeycomb provides several Collector processors for symbolicating stack traces from your browser, iOS, Android, and React Native applications. This gives you human-readable errors and stack traces in your frontend launchpad’s Errors UI. For tutorials on setting up these processors, check out:- Symbolicate Android Stack Traces with the OpenTelemetry Collector
- Symbolicate iOS Stack Traces with the OpenTelemetry Collector
- Symbolicate JavaScript Stack Traces with the OpenTelemetry Collector
Advanced Configuration
The Collector can receive telemetry from different applications in different formats, and also export to multiple backends.
Using HTTP/protobuf Instead of gRPC
Theotlp exporter uses the gRPC protocol to send telemetry data.
To use HTTP/protobuf instead of gRPC, use the otlphttp exporter, update the endpoint, and update the pipeline:
Running the Collector
You can run the Collector in Docker to try it out locally. This is needed when adding instrumentation in development to send events to Honeycomb. For instance, if your configuration file is calledotel_collector_config.yaml in the current working directory, the following command will run the Collector with open ports for sending OTLP protocol:
Collector Deployment Patterns
There are various deployment patterns that can be considered for different use cases. We cover the two most common deployment patterns here.Gateway Mode
A Collector running in Gateway mode is a Collector instance running as a standalone service (for example, container or deployment), typically per cluster, data center, or region. You can then export telemetry data from this collector instance to one or more backends like Honeycomb.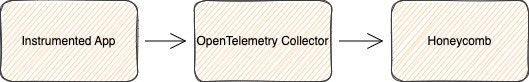
When to deploy the Collector in Gateway Mode
Deploy the Collector in Gateway Mode when:- You want to run a standalone collector deployment with configuration enforced by a central team, such as attribute redaction
- You need to provide an API key or authentication for your exporters while also limiting egress points
- You want to use the
clustermetricsreceiver to collect cluster-level metrics
Agent Mode
A Collector instance running in agent mode runs alongside the application or on the same host as the application. For example, binary, sidecar, or daemonset. Telemetry data from the collector instance (or multiple instances) can then be sent to a central collector to export to Honeycomb or directly to Honeycomb.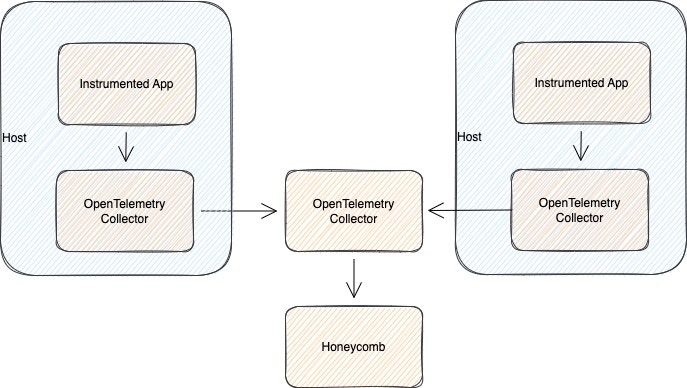
When to deploy the Collector in Agent Mode
Deploy the Collector in Agent Mode when:- You need to run the collector close to the application. When sending data to Honeycomb, this offloads the work of batching, retrying, and queuing from your application.
- You need to reduce inter-node traffic within your cluster.
- Different applications need different collector configurations. For example, you may want to use the
k8sattributesprocessor, which adds metadata attributes to spans, metrics, and logs. These attributes can make it easier to correlate data in Honeycomb - You want to use the
hostmetricsscraper to collect host metrics
Filtering Span Events and Other Data
If using version v0.66.0 (or higher) of the OpenTelemetry Collector-Contrib distribution, use thefilterprocessor to filter Span Events or any other data before sending it to Honeycomb.
The filterprocessor component can be especially helpful if using instrumentations that create a lot of noisy, unneeded data.
To use, add the filterprocessor component as a processor in your OpenTelemetry Collector configuration file, such as otel-collector-config.yaml.
Configure your OpenTelemetry Collector to filter Span Events, similar to:
spanevent list is a separate filter.
If any of the filters match, the span event will be filtered out.
In other words, each line is an OR condition.
Additionally, Honeycomb currently translates all fields with the instrumentation_scope.name field into library.name.
To filter based on the value of an instrumentation scope, use instrumentation_scope.name instead of library.name.
To require multiple conditions to be true, write a single filter that combines them, similar to:
Scrubbing Sensitive Information
Sometimes you want to make sure that certain information does not escape your application or service. This could be for regulatory reasons regarding personally identifiable information, or you want to ensure that certain information does not end being stored with a vendor. Scrubbing attributes from a span is possible with the built-in Attributes Span Processor. Span processors in OpenTelemetry allow you to hook into the lifecycle of a span and modify the span contents before sending to a backend. The Attributes Span Processor can be configured with actions, and specifically thedelete action can be used to remove span attributes.
There are other actions that could be used, such as upsert to replace the value or hash to encrypt the value with a SHA1 hash.
Handling Large Requests
If request sizes are too large, there will be an error when trying to send to Honeycomb. The request size limit is 15MB. To help mitigate errors for requests being too large, it is recommended to set a limit on the batch size and use compression when exporting to Honeycomb.Configuring Max Batch Size
A Batch Processor has a configuration option forsend_batch_size and send_batch_max_size.
These options specify the number of data points, regardless of size, to include in a batch to be sent.
A one-size-fits-all value does not exist for each of these, since different requests will vary in size.
However, these are worth tuning to find the right limit to ensure data is being sent reliably.
Enabling Compression
Collector exporters have configuration options to enable compression, including for both gRPC and HTTP. Current supported compression types includegzip, snappy, and zstd.
Replacing the Old Honeycomb-Specific Exporter
Because Honeycomb supports OTLP, the old Honeycomb-specific exporter is no longer required and is no longer available in current versions of the Collector. The built-in OTLP exporter should be used instead to send trace data to Honeycomb.Choosing between gRPC and HTTP
Most OpenTelemetry SDKs have an option to export telemetry as OTLP either over gRPC or HTTP/protobuf, with some also offering HTTP/JSON. If you are trying to choose between gRPC and HTTP, keep in mind:- Some SDKs default to using gRPC, and it may be easiest to start with the default option.
- Some firewall policies are not set up to handle gRPC and require using HTTP.
- gRPC may improve performance, but its long-lived connections may cause problems with load balancing, especially when using Refinery.