

- Set up instrumentation on your web site or web app
- Send data to Honeycomb
- Start exploring your data in Honeycomb
- Have a rich set of default instrumentation available to help you debug your web service
- Know how to access your data in Honeycomb and find items of interest to investigate
- Be able to start improving your (and your team’s) Observability practices
Before You Begin
Before you run the code, you’ll need to do a few things.Sign up for Honeycomb
If you don’t already have a Honeycomb account, you can sign up for one. Signup is free. Honeycomb stores your data in either a US-based or EU-based location, depending on your account region:Get an API Key
For this guide, you’ll need a Honeycomb Ingest API Key with the Can create services/datasets permission. This lets your application send telemetry to Honeycomb and create a dataset for your service. Make note of your API key; for security reasons, you will not be able to see the key again, and you will need it later.Install the Honeycomb Web Instrumentation Package
We make our Honeycomb Web Instrumentation package available as an NPM package, so you can include it in your web bundle. Navigate to the root directory of your service’s repo, and then install the package:package.json file and checking that the Dependencies list now contains @honeycomb/opentelemetry-web.
Send Data to Honeycomb
Once you have your Honeycomb Ingest API key and have installed Honeycomb’s Web Instrumentation package, it’s time to send telemetry data to Honeycomb!Instantiate Your Instrumentation
To get a comprehensive set of data about your application, you need to instantiate your instrumentation as early as possible in your application’s lifecycle. You can set up your web instrumentation using a popular JavaScript framework, using inline JavaScript, or using a JavaScript helper file. To get started the most quickly, add your package configuration inline in the root instantiation file of your application:Be sure to replace
[YOUR API KEY HERE] and [YOUR APPLICATION NAME HERE] with the value of your Honeycomb API Ingest Key and the name of your service, respectively.
We use the serviceName variable to name your dataset in Honeycomb, so replace it with a name that you will find useful.Tips for Common JavaScript Frameworks
In this section, we show you how to set up your web instrumentation in popular JS frameworks. Depending on the framework your application uses, instantiation may be handled differently. If you run into trouble, please ask for help in our Pollinators Community.- React/Next.js
- Vue
- Angular
- Ember
If you are using React (such as with
create-react-app or via Next.js), you will need to wrap the Honeycomb code snippet in a component to instantiate it.-
Create a file called
observability.jsx|tsxin yourcomponentsdirectory, and insert the code: -
In your
Layout.jsx|tsxfile, import the component, and add it to your layout code:
Confirm Data is Sent
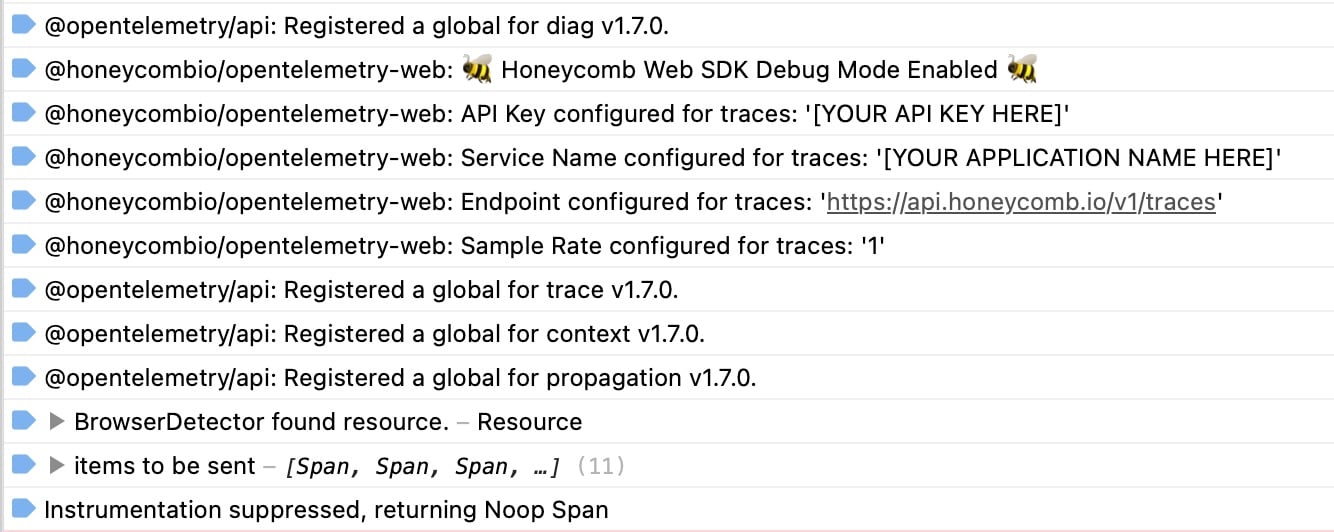
Start up your application and look in the browser console to see debug information. Once you see traces being sent in the console, you’re ready to start using Honeycomb to explore your data. If you encounter an error, visit Troubleshooting to explore solutions to common issues.Refine Your Implementation
Once data flows into Honeycomb, you can add custom data about your application to help with investigations.Add Application-Specific Resource Attributes
To optimize your data collection, we recommend that you add custom attributes that are specific to your application to every span. You can specify extra attributes through theresourceAttributes configuration option.
This data will be available on every span your instrumentation emits, making it easier to correlate your data to the business information you care about.
Connect Browser Traces with Backend Traces
To trace a request all the way from your browser through your distributed system, connect your frontend request traces to your backend traces. If your application’s backend and frontend are served from the same domain, you can connect traces automatically by using eitherinstrumentation-fetch or instrumentation-xml-http-request automatic instrumentation.
If your browser application calls a separate API endpoint, then you must specify the requests to which you want the trace context header added in order to connect the traces.
To do this with the Honeycomb web instrumentation and send traces, uncomment the propagateTraceHeaderCorsUrls array and add regex to include all target domains.
This method allows you to propagate to your backend services without leaking trace IDs to third-party services.
Send Data to an OpenTelemetry Collector
In production, we recommend that you run an OpenTelemetry Collector and send traces to it from your browser application, which will allow you to control your Honeycomb API key and any data transformation. Your OpenTelemetry Collector can then send the traces on to Honeycomb using your API key that you store in the Collector’s configuration. This example configuration of the Honeycomb Web Instrumentation package sends traces to your Collector:Troubleshooting
Running into issues? Here are some common problems and ways to fix them.Dataset Not Appearing in Honeycomb
We use theapiKey variable to send your data to Honeycomb.
Be sure you have replaced the placeholder value for it with your Honeycomb Ingest API Key and that your API key permissions include “Can create datasets”.
If Honeycomb is successfully instantiating, but your API key is not included, you should see output similar to the following in your browser console:
Dataset in Honeycomb has Unexpected Name
We use theserviceName variable to name your dataset in Honeycomb.
Be sure you have replaced the placeholder value for it with a name that you will find useful.
”Navigator is undefined” Error in Next.js Application
If a “navigator is undefined” error appears when you attempt to start your local server while following Next.js instructions, it means the instrumentation is being run in a server-side rendering path. To fix, try the first suggested solution before implementing the second solution:- Add “use client” directive: At the top of the file where you instantiate Honeycomb’s web instrumentation, you can add the “use client” directive, which tells React to only execute the file in a client environment. If that solution does not resolve the error, try step 2.
-
Wrap the function in a try/catch block: If you’re using the client directive and still seeing an error, you can catch the error and avoid instantiation in server-side environments.
By adding this, you ensure your app starts up even if the code is executed in a server-side environment.
Refer to the example below: