

This feature is available as part of the Honeycomb Enterprise plan.
- API Keys: create, update, delete, enable, and disable
- Boards: create, update, and delete
- Burn Alerts: create, update, delete, and state changes to/from
Triggered - Calculated Fields, otherwise known as Derived Columns: create, update, and delete
- OAuth Sessions: create, update, and revoke
- Query Results: completed query runs
- SLOs: create, update, delete, budget resets, and Service Level Indicator (SLI) expression updates
- Telemetry Stats: aggregated statistics about the telemetry you send to Honeycomb, including rejections
- Triggers: create, update, delete, and state changes to/from
Triggered - Users: logins
Report on All Team Activity
You can interact with activity logs through reports.Access Activity Log Reports
To access Activity Log reports, you must be a Team Owner.
- Log in to the Honeycomb UI.
- From the navigation bar, select Account, then select Team settings.
- Select the Activity Log view.
Export Activity Log Reports
You can download all available team activity as a CSV file with a standard retention window of the last 60 days. Each entry in the CSV file includes:- Who performed the action
- What time the action was performed
- What kind of action was performed
- Whether or not the action succeeded or failed
- Log in to the Honeycomb UI.
- From the navigation bar, select Account, then select Team settings.
- Select the Activity Log view.
- Select Download CSV.
File Schema
The downloaded Activity Log CSV file uses the following schema and definitions. Not all attributes are relevant; only some may apply to each entry.- timestamp: Timestamp when the action was recorded by the system.
- resource.type: Type of resource the log relates to.
- resource.action: Create, Update, or Delete. In the case of certain resources, can be a system event.
- resource.id: Unique identifier associated with the resource being modified, if applicable.
- environment.slug: Slug (unique name) of the specific Honeycomb Environment associated with the entry, if applicable.
- dataset.slug: Slug (unique name) of the specific Honeycomb Dataset associated with the entry, if applicable.
- changed_fields: For Create, Update, or Delete logs, attributes of the resource that changed.
- user.id: User’s ID if the log is the result of a user action.
Systemif the log is the result of an automated action. - user.email: User’s email address if a log is the result of a user action.
- user.ip_address: IP address that generated the log (only available on User Login entries).
- metadata: Other information about the event or change, if available.
Export Activity Log Data for a Specific Resource
Each Dataset within your Activity Log Environment contains a stream of activity related to one resource. To investigate activity for a specific resource, you can export Activity Log data for the dataset that corresponds to the target resource. To download your Activity Logs for a particular dataset:- Log in to the Honeycomb UI.
- In the left navigation menu, select Manage Data.
- In the list, locate and select Datasets.
- Select the Activity Log view.
- Select Download CSV.
Investigate Team Activity Using Activity Log Datasets
The Activity Log Environment contains various datasets housing streams of activity related to each supported resource. Within this Environment, team members can observe and investigate team activity with all of Honeycomb’s features, including querying, visualizations, Boards, Triggers, and more. The standard retention period for this Environment is one year.Explore your Activity Log Environment
Using Honeycomb to monitor your team activity opens up a wide range of possibilities to explore.All users on your team can access the Activity Log Environment and query its datasets in the Honeycomb UI, regardless of role.
Only the downloadable reports in Team settings (described above) are limited to Team Owners.
Through the Honeycomb MCP server, the Activity Log Environment is available only to Team Owners.
- Log in to the Honeycomb UI.
- Select the Environments label on the top-left, then select Activity Log.
-
Begin querying the environment and its datasets.
Available datasets include api_keys, boards, burn_alerts, derived_columns, oauth_sessions, query_results, slos, telemetry_stats, triggers, and users.
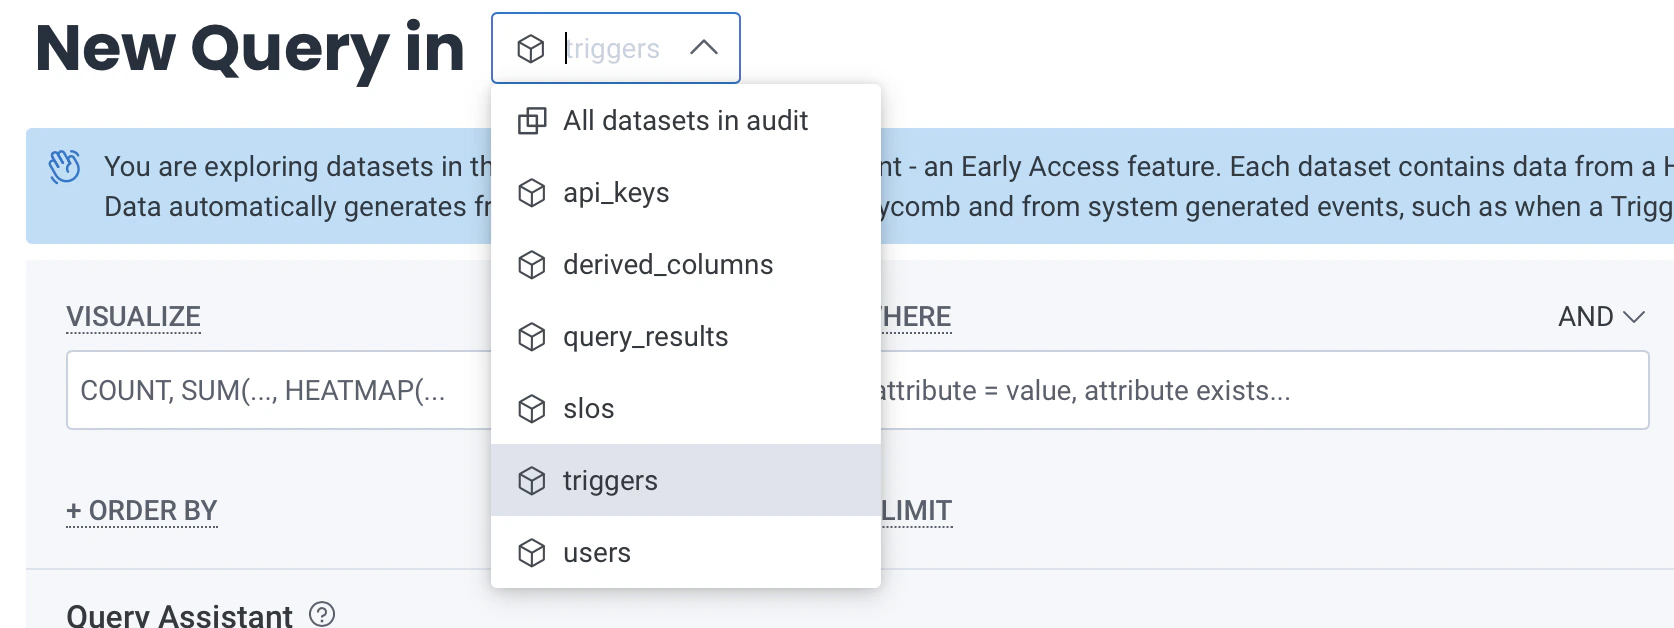
Find Environment-wide Data
To find the types of data available in your Activity Log Environment, run a query for All datasets in activity log with: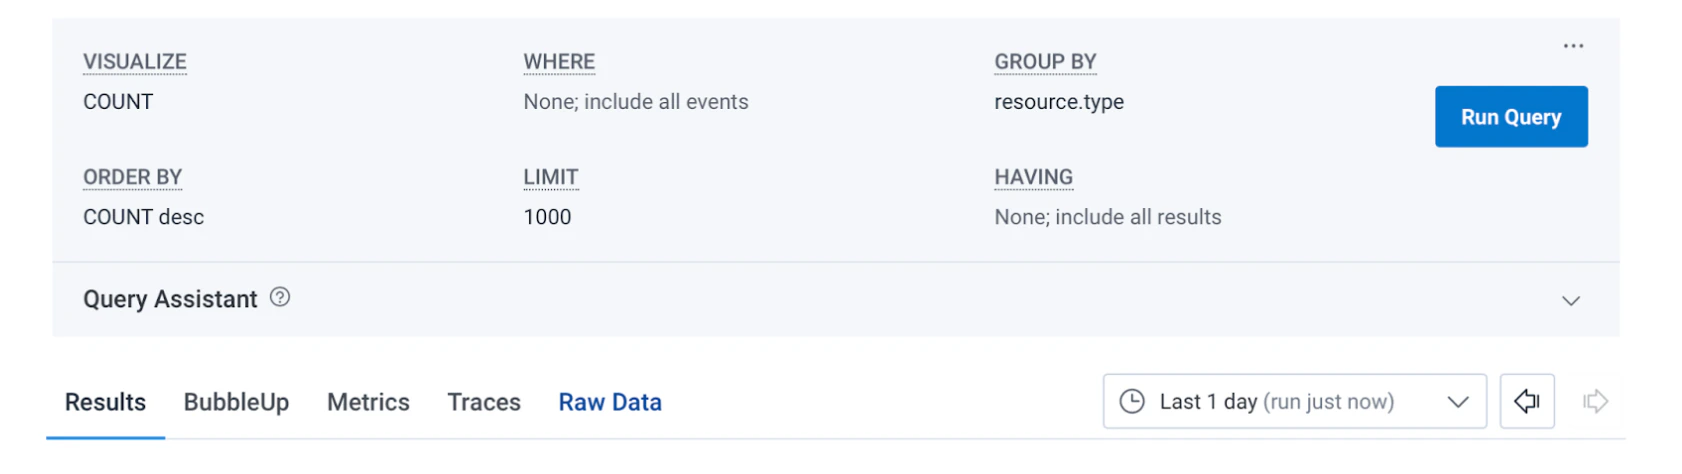
Explore Available Fields on Specific Datasets
To learn about the fields available within a dataset:- Run an empty query on the target Dataset.
- In Query Builder, use the Events view to view the contents of each event. In this display, each event is a row and each field is a column.
- Use this information to construct and try different queries.
Activity Log Datasets
Each dataset in the Activity Log Environment contains a stream of activity for one resource type. Except fortelemetry_stats, all datasets share a set of common fields:
resource.type,resource.action, andresource.id: the affected resource and what happened to ituser.idanduser.email: who performed the action.user.idissystemif the event is the result of an automated action, such as a Trigger firing.environment.sluganddataset.slug: the Environment and Dataset the resource belongs to, if applicableresource.changed_fieldsandbefore.<field>: on updates, which fields changed and each field’s prior value
API Keys
Theapi_keys dataset records API key lifecycle events: created, updated, deleted, enabled, and disabled.
Every event includes the key’s name, its key_type (legacy, ingest, or management), and whether the key is currently enabled.
Additional fields depend on the key type:
- Ingest keys include
access.eventsandaccess.create_datasets. - Management keys include their API
scopes. - Legacy keys include the full set of
access.*permission fields, andvisible_to_members, which indicates whether non-admin team members can see the key.
Boards
Theboards dataset records Board creation, updates, and deletion.
Events include the Board’s name, description, and style, its default filters and time range (default.filters_json, default.start_time, default.end_time, default.granularity), and source: the surface that created the Board, such as the UI, the API, or Slack.
For private Boards, the name and description are redacted as [private board], and default filters are omitted.
Burn Alerts
Theburn_alerts dataset records Burn Alert configuration changes (created, updated, deleted) and state changes (triggered, resolved), which are attributed to system.
Events include:
alert_type:exhaustion_timeorbudget_rateexhaustion_minutes: the minutes-to-exhaustion threshold, on exhaustion-time alertsbudget_rate_window_minutesandbudget_rate_decrease_threshold_per_million: the sliding window and threshold, on budget-rate alertsslo.id,slo.name, andsli.alias: the parent SLO and its SLI
Calculated Fields
Thederived_columns dataset records Calculated Field (Derived Column) creation, updates, and deletion.
Events include the field’s alias, description, and expression.
When a changed expression belongs to a Calculated Field used as an SLI, a corresponding update event also appears in the slos dataset.
Example: Find Calculated Field Experts
Using Calculated Fields indicates advanced Honeycomb knowledge. Find your advanced Honeycomb users. Query thederived_columns dataset for created and updated actions to find out who develops Calculated Fields and uses them to explore data.
To see who creates and updates Calculated Fields, run a query with:
OAuth Sessions
Theoauth_sessions dataset records sessions for integrations that authenticate with Honeycomb through OAuth: session creation, updates, and revocation.
Events include the client_id of the OAuth client, the requested and granted scopes (scopes and oauth_session.granted_scopes), and session timing fields such as expires_at and invalidated_at.
Unlike most Activity Log datasets, OAuth session events are not scoped to an Environment or Dataset.
Query Results
Thequery_results dataset records one event for each completed query run from a user-facing surface, such as the UI, the public API, MCP, Slack, or a template link.
Internal system queries are not recorded.
The resource.action is always created.
Each event describes the query itself, including query.visualize, query.where, query.group_by, query.order_by, query.having, query.limit, and query.time_range.sec, along with the source surface and the user.email of the person who ran it.
Example: Find All Queries Run During Incidents
Thequery_results dataset shows how many queries users run and their query patterns.
To learn which datasets users interact with most, run a query with:
To see what types of queries, or questions, that users ask during an incident, use the above query and select the time duration that maps to an incident window.
Example: Find All Queries Run Using Specific Fields
Ready to retire some data? Or are you curious about which parts of the datasets are used most? Query thequery_results dataset to see which fields are most queried or if specific fields are queried.
To see patterns of fields being used in queries, run a query with:
Alternatively, use a different field for GROUP BY with this query, such as GROUP BY
query.group_by or GROUP BY query.havings.
SLOs
Theslos dataset records SLO creation, updates, and deletion, plus error budget resets (resource.action of budget_reset) and changes to the SLI expression.
Events include the SLO’s name and description, sli.alias (the Calculated Field that defines the SLI), time_period_days, and target_per_million.
SLI expression changes include the new expression as sli.expression and the prior expression as before.sli.expression.
Telemetry Stats
Thetelemetry_stats dataset contains aggregated statistics about the events your team sends to Honeycomb, including rejections.
Unlike the other Activity Log datasets, it records ingest telemetry rather than resource changes, so it does not include the common resource.* and user.* fields.
Each record aggregates up to 10 minutes of ingest activity for one combination of destination dataset, outcome, API key, and event type.
A record’s sample rate is set to the number of events it represents, so a sample-rate-weighted COUNT reflects your true event volume.
Interesting fields include:
outcome:accepted,rejected, orerrorevent.type: the kind of telemetry, such astraces,logs, ormetricserror: a normalized rejection or error message; when present on accepted events, indicates a data quality problem. Note the specialoverflowerror indicates too many distinct field combinations to record, so only per-outcometotals are preserved.http.status: the HTTP status Honeycomb returnedapi_key.name: the name of the ingest key useddataset.slugandenvironment.slug: where the events were sentevent.field_count.avg: the mean number of fields per eventevent.latency_seconds.avgandevent.latency_seconds.max: difference between the event’s timestamp and time of receipt by Honeycomb; negative values indicate future-dated eventsdataset.field_count: the number of columns in the destination dataset, a signal of schema size
Example: Find Out Why Events Are Rejected
To find out why events are being rejected, run a query with:Triggers
Thetriggers dataset records Trigger creation, updates, and deletion, as well as triggered and resolved state changes, which are attributed to system.

nameanddescriptionquery.id: the query the Trigger evaluatesfrequency: how often the Trigger runs, in secondsthreshold.valueandthreshold.operator: the alert conditiondisabledandtriggered: the Trigger’s current state
Example: Find Sensitive Triggers
Find sensitive triggers, or triggers that seem to fire more than expected or tend to auto-resolve. Once you find these triggers, consider improving their configuration to give more actionable alerts. Use thetriggers dataset to identify how many times a trigger has fired in a given time period.
To see which triggers fire often, run a query with:
Users
Theusers dataset records user logins.
Each successful authentication generates one event in the Activity Log of every team the user belongs to.
The resource.action is always authenticated.
Events include the user.email and user.ip_address of the person logging in, and the authentication_method used, such as password, SSO, or Google.