

This feature is available as part of the Honeycomb Enterprise and Pro plans.
Define Your SLO
When creating an SLO, you must define a service level indicator (SLI) that your SLO will use to evaluate your level of success. In the process of determining a suitable SLI, you should identify qualified events, which are events that contain information about the SLI. Keeping these qualified events in mind, ask yourself: “Over what period of time do I expect what percentage of qualified events to pass my SLO?” For example, “I expect that 99% of qualified events will succeed over every 30 days”. In this example,99% is the target percentage of success and 30 days is the time period being measured.
Your SLO will use your SLI alongside your identified target percentage and time period to evaluate status.
As you select a level, base it off your current state, which you can find out by doing a count query grouped by your SLI calculated field after it has been created.
Create Your SLO
To create an SLO:- From the left sidebar, select SLOs.
- Select New SLO.
-
Enter details for your SLO:
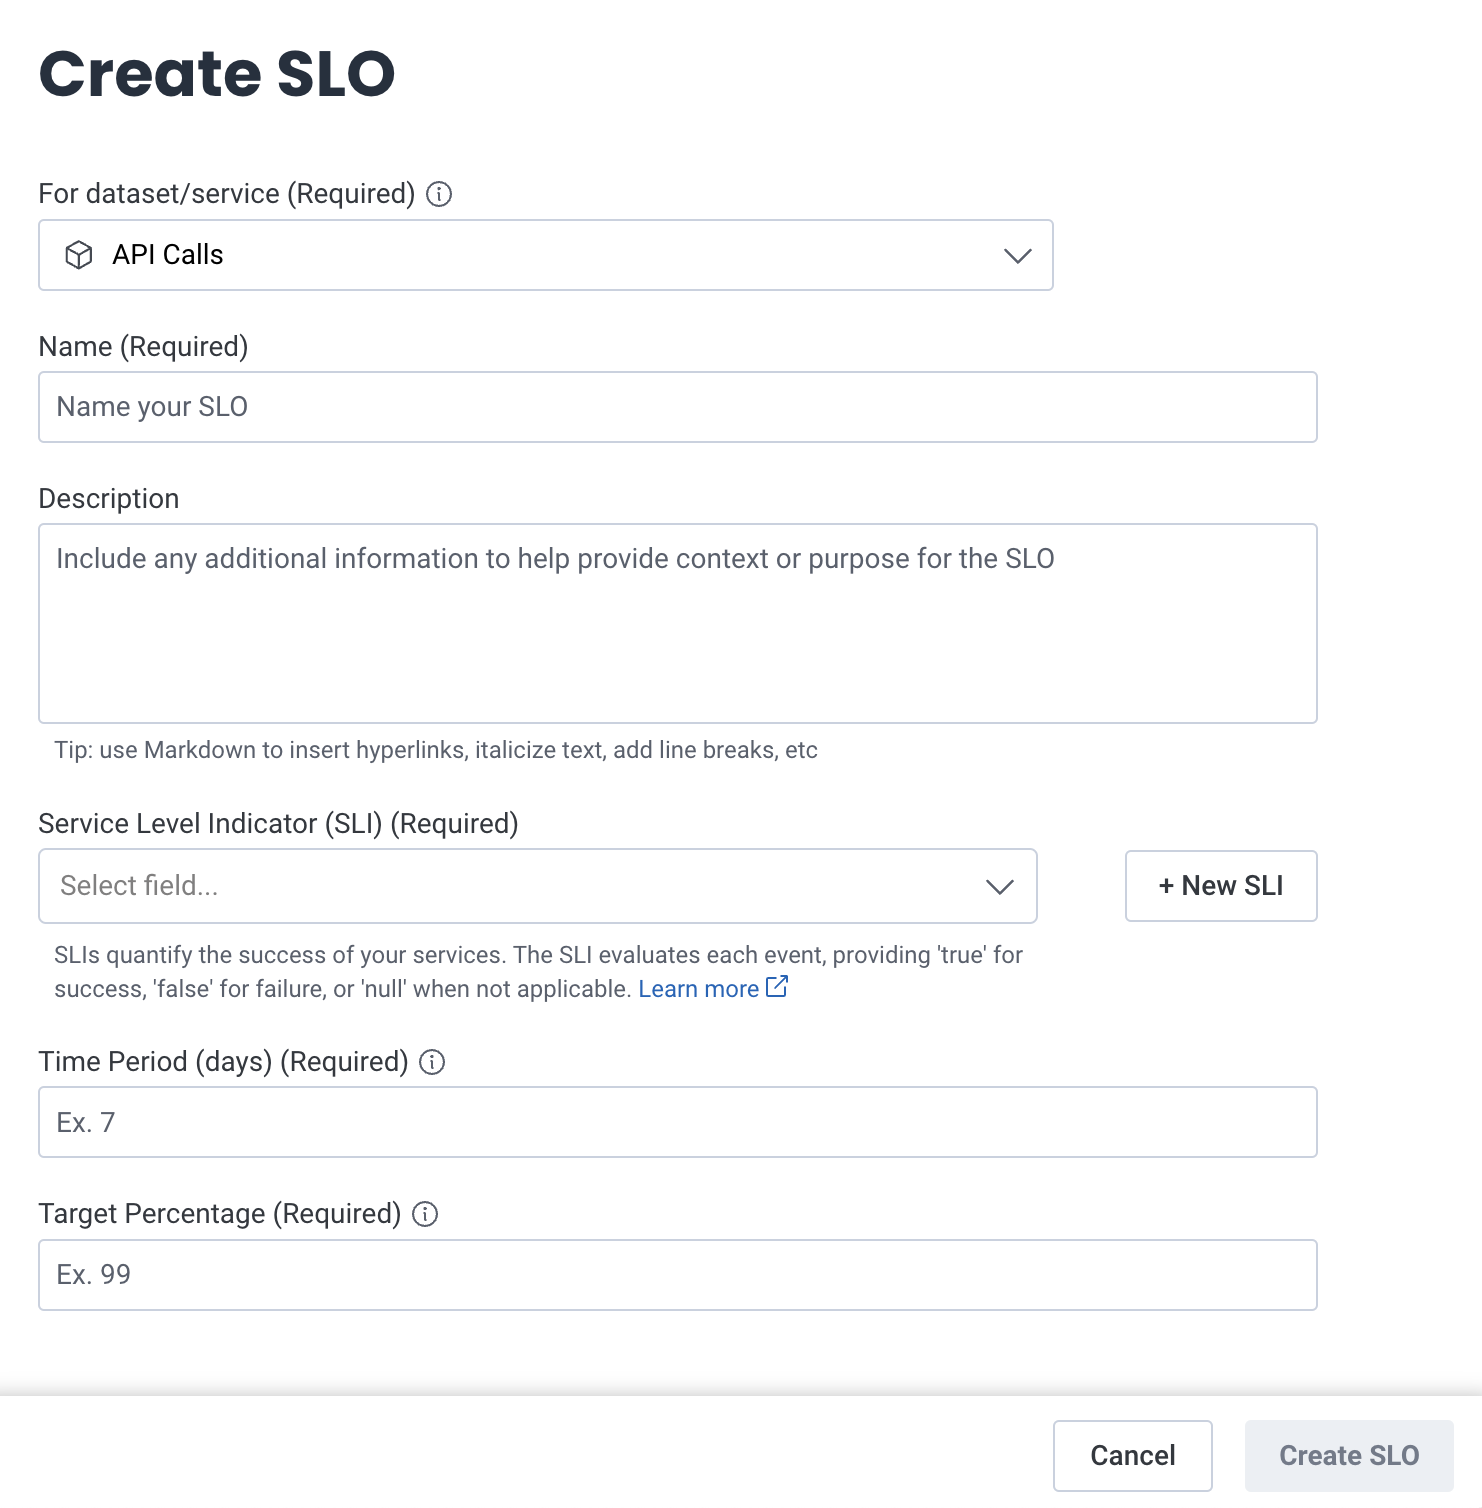
- Select Create SLO.
Create Your SLO from a Template
You can create an SLO from a template. Use SLO templates to create a pre-configured SLO based on your target datasets. If no previous SLOs exist, the SLO displays the available SLO Templates and an option to create an SLO from scratch. Otherwise, the Templates section in the List view displays SLO Templates available to you. To create an SLO from a Template:- Navigate to SLOs using the left navigation menu.
- Select from the available Template options. A creation modal appears.
- Select the text box to view a list of available datasets.
- Select up to 24 datasets to apply this SLO.
- Select Next to finish. An SLO Detailed View of the created SLO appears.
Available SLO Templates
Next Steps
Now that you have an SLO, you can:- Monitor the SLOs for your team
- Set up Burn Alerts, which provide notifications related to your SLO budget
- Monitor sets of related SLOs alongside your queries by adding SLOs to a Board