> ## Documentation Index
> Fetch the complete documentation index at: https://docs.honeycomb.io/llms.txt
> Use this file to discover all available pages before exploring further.
# Honeycomb Kubernetes Agent Reference
> Reference documentation for the Honeycomb Kubernetes Agent, currently in maintenance. For new Kubernetes integrations, use the recommended OpenTelemetry-based paths instead.
The Honeycomb Kubernetes Agent is in maintenance, and we will notify customers when a deprecation date is set.
For new integrations with Kubernetes, we recommend choosing a path from our [Kubernetes overview](/send-data/kubernetes/).
To add tracing to your Kubernetes cluster, refer to the [OpenTelemetry Operator for Kubernetes](https://opentelemetry.io/docs/kubernetes/operator/).
Honeycomb integrates with Kubernetes to collect your applications' logs, cluster logs, and resource metrics so that you can answer all the questions you have.
The [Honeycomb Kubernetes agent](https://github.com/honeycombio/honeycomb-kubernetes-agent) provides a flexible way to aggregate, structure, and enrich events from applications running on Kubernetes.
The Honeycomb Kubernetes agent can also collect resource and status metrics from nodes, pods, containers, and volumes.
## Requirements
To use the Helm package, you will need Helm version 3 or better.
You can still install the agent using `kubectl` though configuration may be more involved.
You wil also need your Honeycomb API key.
Install using either Helm, or `kubectl` directly.
## Getting Started Using Helm
To add tracing to your Kubernetes cluster, refer to the [OpenTelemetry Operator for Kubernetes](https://opentelemetry.io/docs/kubernetes/operator/).
By default, this Helm chart will collect metrics from all nodes and pods, and watchers configuration to capture logs from the following system components:
* kube-controller-manager
* kube-scheduler
To install the agent using the Helm package manager:
1. Add the Honeycomb Helm repository.
```shell theme={}
helm repo add honeycomb https://honeycombio.github.io/helm-charts
```
2. Install the agent.
```shell theme={}
helm install honeycomb honeycomb/honeycomb --set honeycomb.apiKey=YOUR_API_KEY
```
For more details about advanced configuration options, refer to the [Helm chart](https://github.com/honeycombio/helm-charts/tree/main/charts/honeycomb).
## Getting Started Using Kubectl
To add tracing to your Kubernetes cluster, refer to the [OpenTelemetry Operator for Kubernetes](https://opentelemetry.io/docs/kubernetes/operator/).
To install the agent using kubectl:
1. Create a `honeycomb` namespace.
```shell theme={}
kubectl create namespace honeycomb
```
2. Store your Honeycomb API Key as a Kubernetes secret.
```shell theme={}
kubectl create secret generic honeycomb --namespace honeycomb \
--from-literal=api-key=YOUR_API_KEY
```
3. Add the agent to your cluster.
```shell theme={}
kubectl apply -f https://raw.githubusercontent.com/honeycombio/honeycomb-kubernetes-agent/main/examples/quickstart.yaml
```
## Logs Collection
The agent will collect logs based on configured `watchers`.
These `watchers` will match pods based on the configured selection and parse the logs for the pod using the specified parser.
The Helm chart exposes a `watchers` property that you can use.
If installed using kubectl, you will need to modify the `watchers` section of the ConfigMap.
### Using modified log watchers configuration
A configuration to collect and parse logs from the Kubernetes controller manager and scheduler would look like this:
```yaml theme={}
watchers:
- dataset: kubernetes-logs
labelSelector: component=kube-controller-manager
namespace: kube-system
parser: glog
-
You will want to configure the agent to parse logs from **your** applications, but that depends a lot on your applications!
[Read more](#modifying-configuration) about customizing the agent.
## Metrics Collection
The agent collects metrics from nodes, pods, containers, and volumes.
For each collection interval, an event for each resource will be sent to Honeycomb that contains all collected metrics as fields to the event.
Kubernetes labels for the resources will be added as fields to the event with a `label.` prefix.
Pods and containers also get additional status and restart metrics.
The default collection interval is every 10 seconds, for nodes and pods resources only.
### Metrics List
Metrics collected depend on the Kubernetes resource type.
You can filter metrics on the `k8s.resource.type` field.
| Metric | Node | Pod | Container | Volume |
| ---------------------------------- | ---- | --- | --------- | ------ |
| `metrics.cpu.usage` | x | x | x | |
| `metrics.cpu.utilization` | x | x | x | |
| `metrics.filesystem.available` | x | x | x | |
| `metrics.filesystem.capacity` | x | x | x | |
| `metrics.filesystem.usage` | x | x | x | |
| `metrics.memory.available` | x | x | x | |
| `metrics.memory.major_page_faults` | x | x | x | |
| `metrics.memory.page_faults` | x | x | x | |
| `metrics.memory.rss` | x | x | x | |
| `metrics.memory.usage` | x | x | x | |
| `metrics.memory.utilization` | x | x | x | |
| `metrics.memory.working_set` | x | x | x | |
| `metrics.network.bytes.receive` | x | x | | |
| `metrics.network.bytes.send` | x | x | | |
| `metrics.network.errors.receive` | x | x | | |
| `metrics.network.errors.send` | x | x | | |
| `metrics.uptime` | x | x | x | |
| `metrics.volume.available` | | | | x |
| `metrics.volume.capacity` | | | | x |
| `metrics.volume.inodes.free` | | | | x |
| `metrics.volume.inodes.total` | | | | x |
| `metrics.volume.inodes.used` | | | | x |
| `metrics.volume.used` | | | | x |
| `status.exitcode` | | | x | |
| `status.message` | | x | x | |
| `status.phase` | | x | | |
| `status.ready` | | | x | |
| `status.reason` | | x | x | |
| `status.restart` | | x | x | |
| `status.restart_count` | | x | x | |
| `status.restart_delta` | | x | x | |
| `status.state` | | | x | |
## How the Honeycomb Kubernetes Agent Works
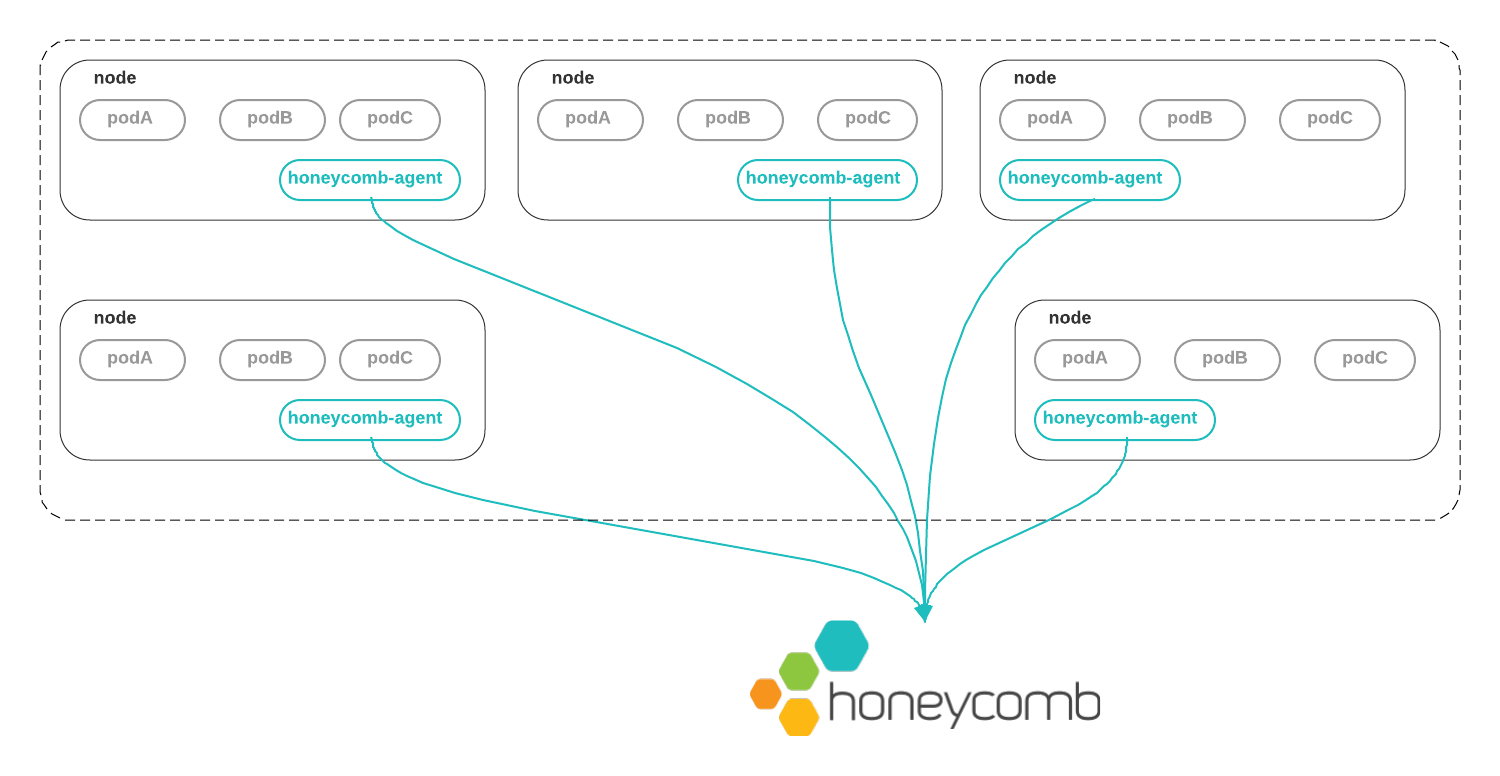
The Honeycomb Kubernetes Agent runs as a [DaemonSet](https://kubernetes.io/docs/concepts/workloads/controllers/daemonset/).
That is, one copy of the agent runs on each node in the cluster.
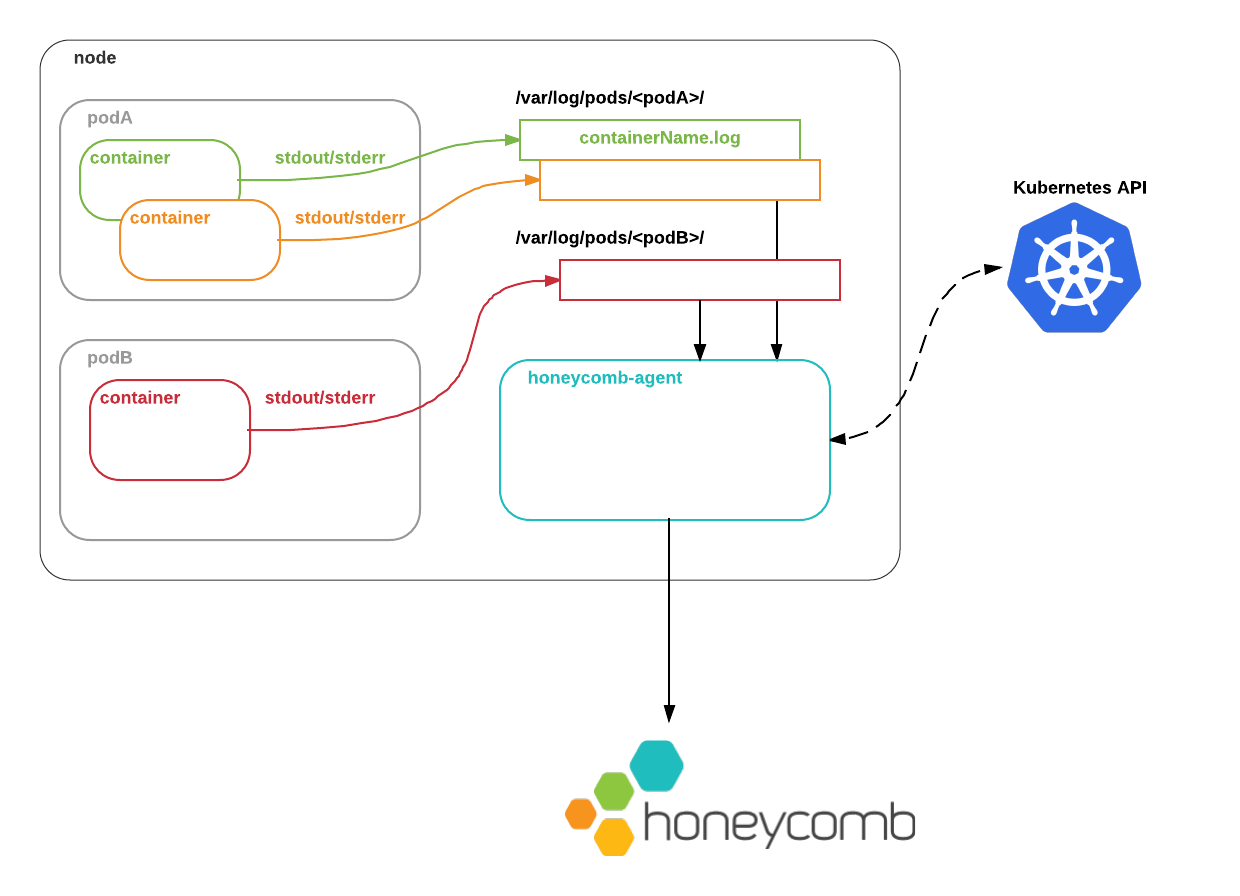
 Metrics for resources running on the node are collected by communicating with the local node's kubelet directly.
Logs from containers' `stdout` and `stderr` are written by the Docker daemon to the local node filesystem.
The Honeycomb Kubernetes Agent reads these logs, augments them with [metadata](#metadata) from the Kubernetes API, and ships them to Honeycomb so that you can observe what is going on.
Metrics for resources running on the node are collected by communicating with the local node's kubelet directly.
Logs from containers' `stdout` and `stderr` are written by the Docker daemon to the local node filesystem.
The Honeycomb Kubernetes Agent reads these logs, augments them with [metadata](#metadata) from the Kubernetes API, and ships them to Honeycomb so that you can observe what is going on.
 The Honeycomb Kubernetes Agent's configuration file describes **which** pods' logs to process, and **how** to handle them, as well as which resource types to collect metrics from.
### Metadata
What metadata does the agent add to these logs?
* `pod.labels`
* `pod.name`
* `pod.namespace`
* `pod.resourceVersion`
* `pod.UID`
* `pod.nodeName`
* `pod.nodeSelector`
* `pod.serviceAccountName`
* `pod.subdomain`
* `pod.annotations`
* `container.args`
* `container.command`
* `container.name`
* `container.env`
* `container.image`
* `container.ports`
* `container.VolumeMounts`
* `container.workingDir`
* `container.resources`
The above metadata is added by default.
Node metadata can be added by specifying `includeNodeLabels: true` within the agent's metrics configuration.
## Modifying Configuration
You can modify the agent's configuration via the `ConfigMap` deployed.
By default, Kubernetes resource metrics and logs from the controller and scheduler will be collected.
Applications in Kubernetes tend to use different logging formats.
In our opinion, your own applications should use a structured, self-describing log format such as JSON.
But Kubernetes system components use the [glog](https://github.com/google/glog) format, reverse proxies and ingress controllers may use a [combined log format](https://docs.nginx.com/nginx/admin-guide/monitoring/logging/), and so on.
You might also want to aggregate events only from specific services, rather than from **everything** that might be running in a cluster.
Or you might want to send logs from different services to different datasets.
To accommodate these real-world use cases, you can customize the [Honeycomb Kubernetes Agent](https://github.com/honeycombio/honeycomb-kubernetes-agent)'s behavior with a YAML configuration file.
Ordinarily, you will create this file as a Kubernetes `ConfigMap` that will be mounted inside the agent container.
### Metrics Collection Configuration
Metrics collection can be configured using the `metrics` configuration property.
```yaml theme={}
metrics:
enabled: true
dataset: kubernetes-metrics
clusterName: MyCluster
metricGroups:
- node
- pod
```
A `clusterName` must be specified for each cluster.
By default, only node and pod metrics will be collected.
The following table describes all properties for metrics configuration:
| Key | Required? | Type | Description |
| ------------------- | --------- | -------- | ---------------------------------------------------------------------------------------------------------------------------------------------------------------------- |
| `enabled` | yes | `bool` | Enables metrics to be collected and sent to Honeycomb. default: `false` |
| `dataset` | yes | `string` | Name of dataset to sent events to. default: `kubernetes-metrics` |
| `clusterName` | yes | `string` | Name of Kubernetes cluster. Will be emitted as a field to Honeycomb. default: `k8s-cluster` |
| `interval` | no | `string` | Collection interval in time duration format, which is specified with a duration suffix. Valid time units are `ns`, `us` (or `µs`), `ms`, `s`, `m`, `h`. default: `10s` |
| `metricGroups` | no | `list` | Resource groups to collected metrics from. Valid values are: `node`, `pod`, `container`, `volume`. default: `node`, `pod` |
| `omitLabels` | no | `list` | Labels in this list will not be collected and sent as fields to Honeycomb. default: `nil` |
| `additionalFields` | no | `map` | A map of fields name and values to apply to each metric event. default: `nil` |
| `includeNodeLabels` | no | `bool` | If enabled, attaches node metadata to metric events. Node labels will respect the `omitLabels` list. |
#### Example Metrics Configuration
This configuration will collect metrics from the node, pods, containers, and volumes, every 10 seconds.
The auto generated `controller-revision-hash` label will be omitted, and additional fields for region and az will be added.
```yaml theme={}
metrics:
enabled: true
dataset: kubernetes-metrics
clusterName: k8s-cluster
interval: 10s
metricGroups:
- node
- pod
- container
- volume
omitLabels:
- controller-revision-hash
additionalFields:
region: us-east
az: us-east-1a
```
### Log Watchers Configuration
Logs parsing and collection can be configured using the `watchers` configuration property.
```yaml theme={}
watchers:
- labelSelector: "app=nginx"
parser: nginx
dataset: kubernetes-nginx
- labelSelector: "app=frontend"
parser: json
dataset: kubernetes-frontend
```
Each block in the `watchers` list describes a set of pods whose logs you want to handle in a specific way, and has the following keys:
| Key | Required? | Type | Description |
| --------------- | --------- | -------------- | --------------------------------------------------------------------------------------------------------------------------------------------------------------- |
| `labelSelector` | yes\* | `string` | A Kubernetes [label selector](https://kubernetes.io/docs/concepts/overview/working-with-objects/labels/#label-selectors) identifying the set of pods to watch. |
| `parser` | yes | `string` | Describes how this watcher should parse events. |
| `dataset` | yes | `string` | The dataset that this watcher should send events to. |
| `containerName` | no | `string` | If you only want to consume logs from one container in a multi-container pod, the name of the container to watch. |
| `processors` | no | `list` | A list of [processors](#processors) to apply to events after they are parsed. |
| `namespace` | no | `string` | The Kubernetes namespace the pods are located in. If not supplied, default namespace is used. |
| `paths` | no | `string array` | Glob-style\* paths to the log files. If not supplied, the default Kubernetes log paths and filenames are used. |
| `exclude` | no | `string array` | Glob-style\* paths for files to exclude from consideration. If a given file matches an exclude, it will not be watched. If not supplied, no files are excluded. |
"Glob-style" means:
* `*` matches any sequence of non-path-separators.
* `/**/` matches zero or more directories.
* `?` matches any single non-path-separator character.
### Validating a Configuration File
To check a configuration file without needing to deploy it into the cluster, you can run the Honeycomb Kubernetes Agent container locally with the `--validate` flag:
```shell theme={}
docker run -v /FULL/PATH/TO/YOUR/config.yaml:/etc/honeycomb/config.yaml honeycombio/honeycomb-kubernetes-agent:head --validate
```
### Uploading a Configuration File to a Cluster
To make a configuration file visible to the Honeycomb Kubernetes Agent inside a Kubernetes cluster, you will need to create a Kubernetes [`ConfigMap`](https://kubernetes.io/docs/tasks/configure-pod-container/configure-pod-configmap/) from it.
To create a brand-new `ConfigMap` from a local file `config.yaml`, run:
```shell theme={}
kubectl create configmap honeycomb-agent-config --from-file=config.yaml
```
To replace an existing `ConfigMap`, you can run:
```shell theme={}
kubectl create configmap honeycomb-agent-config \
--from-file=config.yaml --output=yaml \
--dry-run | kubectl replace --filename=-
```
Then restart running agent pods:
```shell theme={}
kubectl delete pod --selector k8s-app=honeycomb-agent
```
## Parsers
Currently, the following parsers are supported:
### Nop
Does no parsing on logs, and submits an event with the entire contents of the log line in a `"log"` field, plus the aforementioned [kubernetes metadata](#metadata).
Use this if you just want the "raw" log line, or if your log line structure does not match one of the parsers below.
You can still query datasets with raw log lines to some degree using string filters and calculated fields, but structuring your logs is strongly encouraged.
### JSON
JSON is a great format for structured logs.
With the JSON parser, we map JSON key/value pairs to event fields.
### NGINX
Parses NGINX access logs.
If you are using a custom NGINX log format, you can specify the format using the following configuration:
```yaml theme={}
watchers:
- labelSelector: "io.kompose.service=nginx"
parser:
name: nginx
dataset: nginx-inner
options:
log_format: '$remote_addr - $remote_user [$time_local] $host "$request" $status $bytes_sent $body_bytes_sent $request_time "$http_referer" "$http_user_agent" $request_length "$http_authorization" "$http_x_forwarded_proto" "$http_x_forwarded_for" $server_name'
```
This uses the enhanced additional log fields from our [using NGINX with Honeytail](/send-data/logs/structured/nginx/#missing-default-options) guide.
You may need to modify the log format in the watcher YAML, or your NGINX config file / ConfigMap, to match.
### Glog
Parses logs produced by [glog](https://github.com/golang/glog), which look like this:
```log theme={}
I0719 23:09:54.422170 1 kube.go:118] Node controller sync successful
```
This format is commonly used by Kubernetes system components, such as the API server.
### Redis
Parses logs produced by [redis](https://redis.io) 3.0+, which look like this:
```log theme={}
1:M 08 Aug 22:59:58.739 * Background saving started by pid 43
```
**Thanks to MacRae Linton for contributing the Redis parser.**
### Keyval
Parses logs in `key=value` format, such as:
```log theme={}
time=2022-05-15T05:43:19Z msg="server response - time 12ms code: 401 - request: GET /hello ..."
```
Key-value formatted logs often have a special prefix, such as a log level.
```log theme={}
INFO: time=2022-05-15T05:43:19Z msg="server response - time 12ms code: 401 - request: GET /hello ..."
```
For parsing lines that have additional fields without an equal sign, and to ensure fields are extracted properly into fields in the Honeycomb UI, specify a regular expression to parse that prefix in the configuration.
```yaml theme={}
watchers:
- labelSelector: "com.myco.logging.keyvalformat=true"
parser:
name: keyval
options:
prefixRegex: "(?P[A-Z]+): (?Ptime=[0-9]{4}-[0-9]{2}-[0-9]{2}T[0-9]{2}:[0-9]{2}:[0-9]{2}Z )"
```
If whitespace-separated text is found that does not contain `=`, then it will be interpreted as a key without a value.
For example, if a log contains text:
```log theme={}
This is a test
```
Then the `keyval` parser will create an event that looks similar to:
```json theme={}
{
"This": true,
"is": true,
"a": true,
"test": true
}
```
This will cause an explosion of columns in Honeycomb.
As this is a deliberate choice by the `keyval` parser, extra care should be taken when using it.
## Processors
Processors transform events after they are parsed.
Currently, the following processors are supported:
### additional\_fields
The `additional_fields` processor accepts a static map of field names and values and appends those to every event it processes.
These values will overwrite existing fields of the same name, if they exist.
For example, with the following configuration:
```yaml theme={}
processors:
- additional_fields:
environment: production
owner: me@example.com
```
The field's environment and owner will be added to the event.
### sample
The `sample` processor will only send a subset of events to Honeycomb.
Honeycomb natively supports sampled event streams, allowing you to send a representative subset of events while still getting high-fidelity query results.
**Options:**
| Key | Type | Description |
| ----------------- | ------------------------- | ----------------------------------------------------------------------------------------------------------------------------------------------------------------------------------------------------------------------------------------------------------------------------- |
| `type` | `"static"` or `"dynamic"` | How events should be sampled. |
| `rate` | `integer` | The rate at which to sample events. Specifying a sample rate of 20 will cause one in 20 events to be sent. |
| `keys` | list of `string`s | The list of field keys to use when doing dynamic sampling. |
| `windowsize` | `integer` | How often to refresh estimated sample rates during dynamic sampling, in seconds. Default: `30s`. |
| `minEventsPerSec` | `integer` | Whenever the number of events per second being processed falls below this value for a time window (see `windowSize`), sampling will be disabled for the next time window (all events will be sent with a sample rate of 1). Default: `50`. The minimum possible value is `1`. |
### drop\_field
The `drop_field` processor will remove the specified field from all events before sending them to Honeycomb.
This is useful for removing sensitive information from events.
**Options:**
| Key | Value | Description |
| ------- | -------- | ------------------------------ |
| `field` | `string` | The name of the field to drop. |
### request\_shape
The `request_shape` processor will take a field representing an HTTP request, such as `GET /api/v1/users?id=22 HTTP/1.1`, and unpack it into its constituent parts.
**Options:**
| Key | Value | Description |
| ----------- | ----------------- | ---------------------------------------------------------------------------- |
| `field` | `string` | The name of the field containing the HTTP request (for example, `"request"`) |
| `patterns` | list of `string`s | A list of URL patterns to match when unpacking the request |
| `queryKeys` | list of `string`s | An allowlist of keys in the URL query string to unpack |
| `prefix` | `string` | A prefix to prepend to the unpacked field names |
For example, with the following configuration:
```yaml theme={}
processors:
- request_shape:
field: request
patterns:
- /api/:version/:resource
queryKeys:
- id
```
the request\_shape processor will expand the event
```json theme={}
{"request": "GET /api/v1/users?id=22 HTTP/1.1", ...}
```
into
```json theme={}
{
"request": "GET /api/v1/users?id=22 HTTP/1.1",
"request_method": "GET",
"request_protocol_version": "HTTP/1.1",
"request_uri": "/api/v1/users?id=22",
"request_path": "/api/v1/users",
"request_query": "id=22",
"request_shape": "/api/:version/:resource?id=?",
"request_path_version": "v1",
"request_path_resource": "users",
"request_pathshape": "/api/:version/:resource",
"request_queryshape": "id=?",
"request_query_id": "22",
...
}
```
### timefield
The `timefield` processor will replace the default timestamp in an event with one extracted from a specific field in the event.
**Options:**
| Key | Value | Description |
| -------- | -------- | -------------------------------------------------------------------------------------------------------------------------- |
| `field` | `string` | The name of the field containing the timestamp |
| `format` | `string` | The format of the timestamp found in timefield, in strftime or [Golang](https://golang.org/pkg/time/#pkg-constants) format |
This processor is not generally necessary when collecting pod logs.
The Honeycomb Kubernetes Agent will automatically use the timestamp recorded by the Docker json-log driver.
It is useful when parsing logs that live at a particular path on the node filesystem, such as Kubernetes audit logs.
## Sample Configurations
Here are some example Kubernetes Honeycomb Agent configurations.
Parse logs from pods labelled with `app: nginx`:
```yaml theme={}
---
writekey: "YOUR_API_KEY"
watchers:
- labelSelector: app=nginx
parser: nginx
dataset: nginx-kubernetes
processors:
- request_shape:
field: request
```
Send logs from different services to different datasets:
```yaml theme={}
---
writekey: "YOUR_API_KEY"
watchers:
- labelSelector: "app=nginx"
parser: nginx
dataset: nginx-kubernetes
- labelSelector: "app=frontend-web"
parser: json
dataset: frontend
```
Sample events from a frontend-web deployment: only send one in 20 events from the prod namespace, and one in 10 events from the staging namespace.
```yaml theme={}
---
writekey: "YOUR_API_KEY"
watchers:
- labelSelector: "app=frontend-web"
namespace: prod
parser: json
dataset: frontend
processors:
- sample:
type: static
rate: 20
- drop_field:
field: user_email
- labelSelector: "app=frontend-web"
namespace: staging
parser: json
dataset: frontend
processors:
- sample:
type: static
rate: 10
```
Get logs from a multi-container pod, but only from the `sidecar` container:
```yaml theme={}
---
writekey: "YOUR_API_KEY"
watchers:
- labelSelector: "app=frontend-web"
containerName: sidecar
parser: json
dataset: frontend
```
The Honeycomb Kubernetes Agent's configuration file describes **which** pods' logs to process, and **how** to handle them, as well as which resource types to collect metrics from.
### Metadata
What metadata does the agent add to these logs?
* `pod.labels`
* `pod.name`
* `pod.namespace`
* `pod.resourceVersion`
* `pod.UID`
* `pod.nodeName`
* `pod.nodeSelector`
* `pod.serviceAccountName`
* `pod.subdomain`
* `pod.annotations`
* `container.args`
* `container.command`
* `container.name`
* `container.env`
* `container.image`
* `container.ports`
* `container.VolumeMounts`
* `container.workingDir`
* `container.resources`
The above metadata is added by default.
Node metadata can be added by specifying `includeNodeLabels: true` within the agent's metrics configuration.
## Modifying Configuration
You can modify the agent's configuration via the `ConfigMap` deployed.
By default, Kubernetes resource metrics and logs from the controller and scheduler will be collected.
Applications in Kubernetes tend to use different logging formats.
In our opinion, your own applications should use a structured, self-describing log format such as JSON.
But Kubernetes system components use the [glog](https://github.com/google/glog) format, reverse proxies and ingress controllers may use a [combined log format](https://docs.nginx.com/nginx/admin-guide/monitoring/logging/), and so on.
You might also want to aggregate events only from specific services, rather than from **everything** that might be running in a cluster.
Or you might want to send logs from different services to different datasets.
To accommodate these real-world use cases, you can customize the [Honeycomb Kubernetes Agent](https://github.com/honeycombio/honeycomb-kubernetes-agent)'s behavior with a YAML configuration file.
Ordinarily, you will create this file as a Kubernetes `ConfigMap` that will be mounted inside the agent container.
### Metrics Collection Configuration
Metrics collection can be configured using the `metrics` configuration property.
```yaml theme={}
metrics:
enabled: true
dataset: kubernetes-metrics
clusterName: MyCluster
metricGroups:
- node
- pod
```
A `clusterName` must be specified for each cluster.
By default, only node and pod metrics will be collected.
The following table describes all properties for metrics configuration:
| Key | Required? | Type | Description |
| ------------------- | --------- | -------- | ---------------------------------------------------------------------------------------------------------------------------------------------------------------------- |
| `enabled` | yes | `bool` | Enables metrics to be collected and sent to Honeycomb. default: `false` |
| `dataset` | yes | `string` | Name of dataset to sent events to. default: `kubernetes-metrics` |
| `clusterName` | yes | `string` | Name of Kubernetes cluster. Will be emitted as a field to Honeycomb. default: `k8s-cluster` |
| `interval` | no | `string` | Collection interval in time duration format, which is specified with a duration suffix. Valid time units are `ns`, `us` (or `µs`), `ms`, `s`, `m`, `h`. default: `10s` |
| `metricGroups` | no | `list` | Resource groups to collected metrics from. Valid values are: `node`, `pod`, `container`, `volume`. default: `node`, `pod` |
| `omitLabels` | no | `list` | Labels in this list will not be collected and sent as fields to Honeycomb. default: `nil` |
| `additionalFields` | no | `map` | A map of fields name and values to apply to each metric event. default: `nil` |
| `includeNodeLabels` | no | `bool` | If enabled, attaches node metadata to metric events. Node labels will respect the `omitLabels` list. |
#### Example Metrics Configuration
This configuration will collect metrics from the node, pods, containers, and volumes, every 10 seconds.
The auto generated `controller-revision-hash` label will be omitted, and additional fields for region and az will be added.
```yaml theme={}
metrics:
enabled: true
dataset: kubernetes-metrics
clusterName: k8s-cluster
interval: 10s
metricGroups:
- node
- pod
- container
- volume
omitLabels:
- controller-revision-hash
additionalFields:
region: us-east
az: us-east-1a
```
### Log Watchers Configuration
Logs parsing and collection can be configured using the `watchers` configuration property.
```yaml theme={}
watchers:
- labelSelector: "app=nginx"
parser: nginx
dataset: kubernetes-nginx
- labelSelector: "app=frontend"
parser: json
dataset: kubernetes-frontend
```
Each block in the `watchers` list describes a set of pods whose logs you want to handle in a specific way, and has the following keys:
| Key | Required? | Type | Description |
| --------------- | --------- | -------------- | --------------------------------------------------------------------------------------------------------------------------------------------------------------- |
| `labelSelector` | yes\* | `string` | A Kubernetes [label selector](https://kubernetes.io/docs/concepts/overview/working-with-objects/labels/#label-selectors) identifying the set of pods to watch. |
| `parser` | yes | `string` | Describes how this watcher should parse events. |
| `dataset` | yes | `string` | The dataset that this watcher should send events to. |
| `containerName` | no | `string` | If you only want to consume logs from one container in a multi-container pod, the name of the container to watch. |
| `processors` | no | `list` | A list of [processors](#processors) to apply to events after they are parsed. |
| `namespace` | no | `string` | The Kubernetes namespace the pods are located in. If not supplied, default namespace is used. |
| `paths` | no | `string array` | Glob-style\* paths to the log files. If not supplied, the default Kubernetes log paths and filenames are used. |
| `exclude` | no | `string array` | Glob-style\* paths for files to exclude from consideration. If a given file matches an exclude, it will not be watched. If not supplied, no files are excluded. |
"Glob-style" means:
* `*` matches any sequence of non-path-separators.
* `/**/` matches zero or more directories.
* `?` matches any single non-path-separator character.
### Validating a Configuration File
To check a configuration file without needing to deploy it into the cluster, you can run the Honeycomb Kubernetes Agent container locally with the `--validate` flag:
```shell theme={}
docker run -v /FULL/PATH/TO/YOUR/config.yaml:/etc/honeycomb/config.yaml honeycombio/honeycomb-kubernetes-agent:head --validate
```
### Uploading a Configuration File to a Cluster
To make a configuration file visible to the Honeycomb Kubernetes Agent inside a Kubernetes cluster, you will need to create a Kubernetes [`ConfigMap`](https://kubernetes.io/docs/tasks/configure-pod-container/configure-pod-configmap/) from it.
To create a brand-new `ConfigMap` from a local file `config.yaml`, run:
```shell theme={}
kubectl create configmap honeycomb-agent-config --from-file=config.yaml
```
To replace an existing `ConfigMap`, you can run:
```shell theme={}
kubectl create configmap honeycomb-agent-config \
--from-file=config.yaml --output=yaml \
--dry-run | kubectl replace --filename=-
```
Then restart running agent pods:
```shell theme={}
kubectl delete pod --selector k8s-app=honeycomb-agent
```
## Parsers
Currently, the following parsers are supported:
### Nop
Does no parsing on logs, and submits an event with the entire contents of the log line in a `"log"` field, plus the aforementioned [kubernetes metadata](#metadata).
Use this if you just want the "raw" log line, or if your log line structure does not match one of the parsers below.
You can still query datasets with raw log lines to some degree using string filters and calculated fields, but structuring your logs is strongly encouraged.
### JSON
JSON is a great format for structured logs.
With the JSON parser, we map JSON key/value pairs to event fields.
### NGINX
Parses NGINX access logs.
If you are using a custom NGINX log format, you can specify the format using the following configuration:
```yaml theme={}
watchers:
- labelSelector: "io.kompose.service=nginx"
parser:
name: nginx
dataset: nginx-inner
options:
log_format: '$remote_addr - $remote_user [$time_local] $host "$request" $status $bytes_sent $body_bytes_sent $request_time "$http_referer" "$http_user_agent" $request_length "$http_authorization" "$http_x_forwarded_proto" "$http_x_forwarded_for" $server_name'
```
This uses the enhanced additional log fields from our [using NGINX with Honeytail](/send-data/logs/structured/nginx/#missing-default-options) guide.
You may need to modify the log format in the watcher YAML, or your NGINX config file / ConfigMap, to match.
### Glog
Parses logs produced by [glog](https://github.com/golang/glog), which look like this:
```log theme={}
I0719 23:09:54.422170 1 kube.go:118] Node controller sync successful
```
This format is commonly used by Kubernetes system components, such as the API server.
### Redis
Parses logs produced by [redis](https://redis.io) 3.0+, which look like this:
```log theme={}
1:M 08 Aug 22:59:58.739 * Background saving started by pid 43
```
**Thanks to MacRae Linton for contributing the Redis parser.**
### Keyval
Parses logs in `key=value` format, such as:
```log theme={}
time=2022-05-15T05:43:19Z msg="server response - time 12ms code: 401 - request: GET /hello ..."
```
Key-value formatted logs often have a special prefix, such as a log level.
```log theme={}
INFO: time=2022-05-15T05:43:19Z msg="server response - time 12ms code: 401 - request: GET /hello ..."
```
For parsing lines that have additional fields without an equal sign, and to ensure fields are extracted properly into fields in the Honeycomb UI, specify a regular expression to parse that prefix in the configuration.
```yaml theme={}
watchers:
- labelSelector: "com.myco.logging.keyvalformat=true"
parser:
name: keyval
options:
prefixRegex: "(?P[A-Z]+): (?Ptime=[0-9]{4}-[0-9]{2}-[0-9]{2}T[0-9]{2}:[0-9]{2}:[0-9]{2}Z )"
```
If whitespace-separated text is found that does not contain `=`, then it will be interpreted as a key without a value.
For example, if a log contains text:
```log theme={}
This is a test
```
Then the `keyval` parser will create an event that looks similar to:
```json theme={}
{
"This": true,
"is": true,
"a": true,
"test": true
}
```
This will cause an explosion of columns in Honeycomb.
As this is a deliberate choice by the `keyval` parser, extra care should be taken when using it.
## Processors
Processors transform events after they are parsed.
Currently, the following processors are supported:
### additional\_fields
The `additional_fields` processor accepts a static map of field names and values and appends those to every event it processes.
These values will overwrite existing fields of the same name, if they exist.
For example, with the following configuration:
```yaml theme={}
processors:
- additional_fields:
environment: production
owner: me@example.com
```
The field's environment and owner will be added to the event.
### sample
The `sample` processor will only send a subset of events to Honeycomb.
Honeycomb natively supports sampled event streams, allowing you to send a representative subset of events while still getting high-fidelity query results.
**Options:**
| Key | Type | Description |
| ----------------- | ------------------------- | ----------------------------------------------------------------------------------------------------------------------------------------------------------------------------------------------------------------------------------------------------------------------------- |
| `type` | `"static"` or `"dynamic"` | How events should be sampled. |
| `rate` | `integer` | The rate at which to sample events. Specifying a sample rate of 20 will cause one in 20 events to be sent. |
| `keys` | list of `string`s | The list of field keys to use when doing dynamic sampling. |
| `windowsize` | `integer` | How often to refresh estimated sample rates during dynamic sampling, in seconds. Default: `30s`. |
| `minEventsPerSec` | `integer` | Whenever the number of events per second being processed falls below this value for a time window (see `windowSize`), sampling will be disabled for the next time window (all events will be sent with a sample rate of 1). Default: `50`. The minimum possible value is `1`. |
### drop\_field
The `drop_field` processor will remove the specified field from all events before sending them to Honeycomb.
This is useful for removing sensitive information from events.
**Options:**
| Key | Value | Description |
| ------- | -------- | ------------------------------ |
| `field` | `string` | The name of the field to drop. |
### request\_shape
The `request_shape` processor will take a field representing an HTTP request, such as `GET /api/v1/users?id=22 HTTP/1.1`, and unpack it into its constituent parts.
**Options:**
| Key | Value | Description |
| ----------- | ----------------- | ---------------------------------------------------------------------------- |
| `field` | `string` | The name of the field containing the HTTP request (for example, `"request"`) |
| `patterns` | list of `string`s | A list of URL patterns to match when unpacking the request |
| `queryKeys` | list of `string`s | An allowlist of keys in the URL query string to unpack |
| `prefix` | `string` | A prefix to prepend to the unpacked field names |
For example, with the following configuration:
```yaml theme={}
processors:
- request_shape:
field: request
patterns:
- /api/:version/:resource
queryKeys:
- id
```
the request\_shape processor will expand the event
```json theme={}
{"request": "GET /api/v1/users?id=22 HTTP/1.1", ...}
```
into
```json theme={}
{
"request": "GET /api/v1/users?id=22 HTTP/1.1",
"request_method": "GET",
"request_protocol_version": "HTTP/1.1",
"request_uri": "/api/v1/users?id=22",
"request_path": "/api/v1/users",
"request_query": "id=22",
"request_shape": "/api/:version/:resource?id=?",
"request_path_version": "v1",
"request_path_resource": "users",
"request_pathshape": "/api/:version/:resource",
"request_queryshape": "id=?",
"request_query_id": "22",
...
}
```
### timefield
The `timefield` processor will replace the default timestamp in an event with one extracted from a specific field in the event.
**Options:**
| Key | Value | Description |
| -------- | -------- | -------------------------------------------------------------------------------------------------------------------------- |
| `field` | `string` | The name of the field containing the timestamp |
| `format` | `string` | The format of the timestamp found in timefield, in strftime or [Golang](https://golang.org/pkg/time/#pkg-constants) format |
This processor is not generally necessary when collecting pod logs.
The Honeycomb Kubernetes Agent will automatically use the timestamp recorded by the Docker json-log driver.
It is useful when parsing logs that live at a particular path on the node filesystem, such as Kubernetes audit logs.
## Sample Configurations
Here are some example Kubernetes Honeycomb Agent configurations.
Parse logs from pods labelled with `app: nginx`:
```yaml theme={}
---
writekey: "YOUR_API_KEY"
watchers:
- labelSelector: app=nginx
parser: nginx
dataset: nginx-kubernetes
processors:
- request_shape:
field: request
```
Send logs from different services to different datasets:
```yaml theme={}
---
writekey: "YOUR_API_KEY"
watchers:
- labelSelector: "app=nginx"
parser: nginx
dataset: nginx-kubernetes
- labelSelector: "app=frontend-web"
parser: json
dataset: frontend
```
Sample events from a frontend-web deployment: only send one in 20 events from the prod namespace, and one in 10 events from the staging namespace.
```yaml theme={}
---
writekey: "YOUR_API_KEY"
watchers:
- labelSelector: "app=frontend-web"
namespace: prod
parser: json
dataset: frontend
processors:
- sample:
type: static
rate: 20
- drop_field:
field: user_email
- labelSelector: "app=frontend-web"
namespace: staging
parser: json
dataset: frontend
processors:
- sample:
type: static
rate: 10
```
Get logs from a multi-container pod, but only from the `sidecar` container:
```yaml theme={}
---
writekey: "YOUR_API_KEY"
watchers:
- labelSelector: "app=frontend-web"
containerName: sidecar
parser: json
dataset: frontend
```