> ## Documentation Index
> Fetch the complete documentation index at: https://docs.honeycomb.io/llms.txt
> Use this file to discover all available pages before exploring further.
# Kubernetes Prometheus Node
> Retrieve metrics from Kubernetes pods using service discovery
Ent+
This feature is available as an add-on for the [Honeycomb Enterprise plan](https://www.honeycomb.io/pricing/).
Please contact your Honeycomb account team for details.
## Supported Platforms
| Platform | Metrics | Logs | Traces |
| :-------------------- | :------ | :--- | :----- |
| Kubernetes DaemonSet | ✓ | | |
| OpenShift 4 DaemonSet | ✓ | | |
## Configuration Table
| Field | Description |
| :-------------------------------- | :------------------------------------------------------------------------------------------------------------------------------------ |
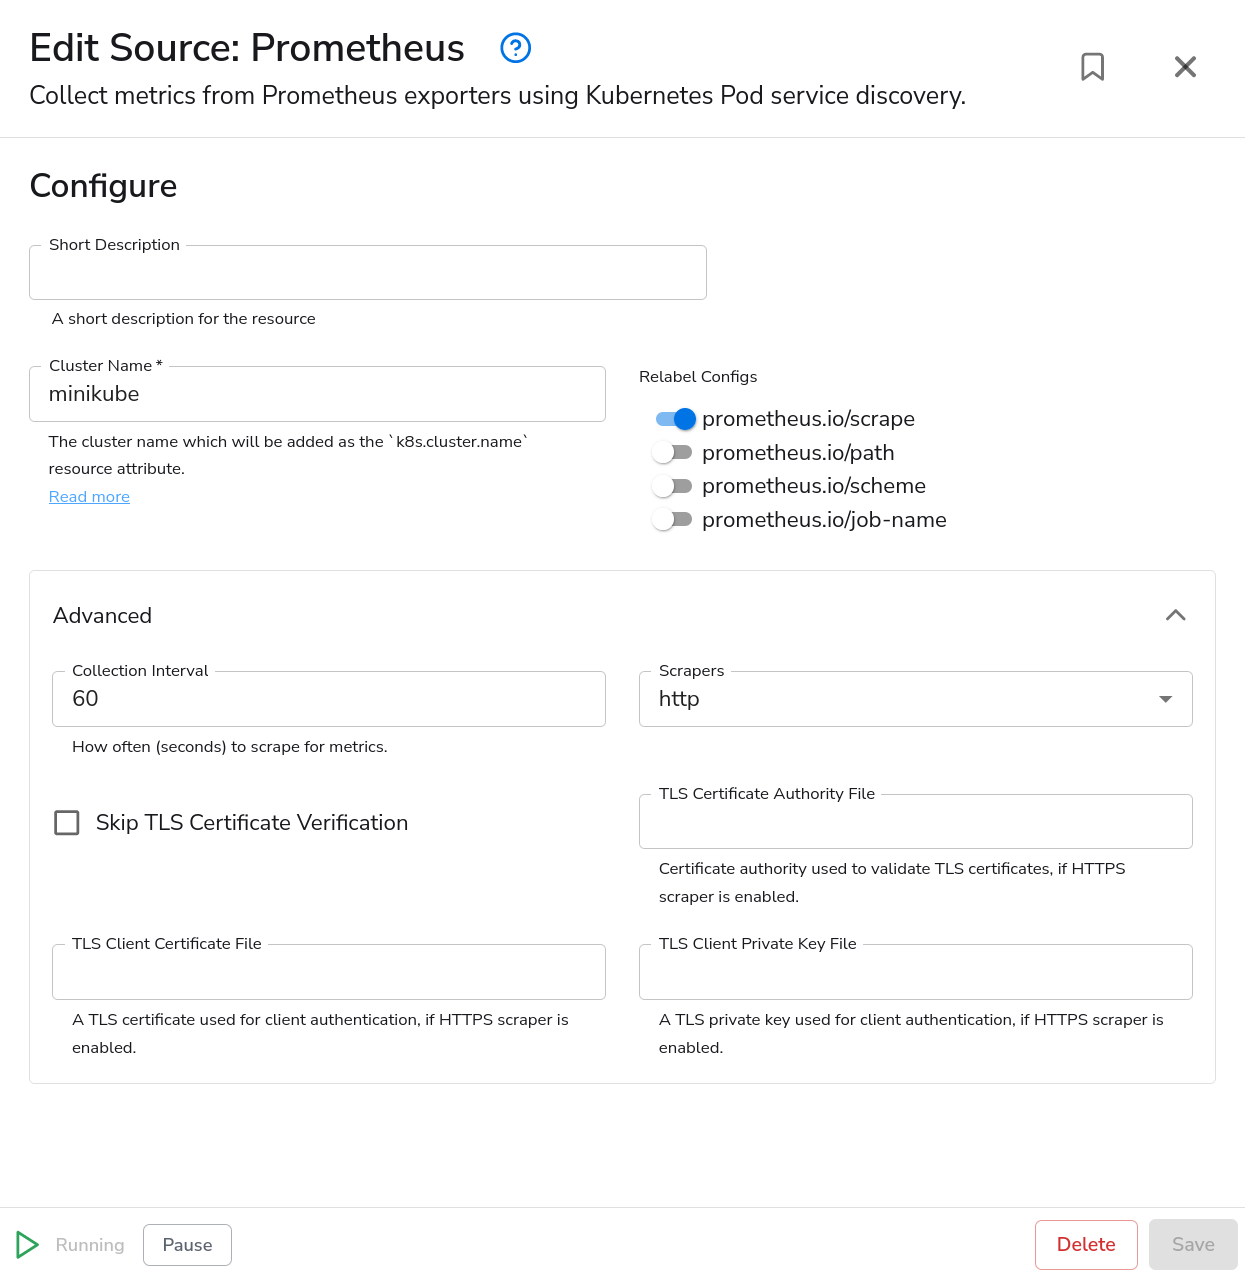
| Cluster Name\* | The cluster name that will be added as the `k8s.cluster.name` resource attribute. |
| Relabel Configs | Enable or disable relabel configurations. See [Relabel Configs](#relabel-configs). |
| Scrapers | Enable or disable HTTP and HTTPS scrapers. |
| Collection Interval | Sets how often (seconds) to scrape for metrics. |
| Skip TLS Certificate Verification | Enable to skip TLS certificate verification. |
| TLS Certificate Authority File | Certificate authority used to validate the exporters TLS certificate. See [Transport Layer Security](#transport-layer-security). |
| TLS Client Certificate File | A TLS certificate used for client authentication if mutual TLS is enabled. See [Transport Layer Security](#transport-layer-security). |
| TLS Client Private Key File | A TLS private key used for client authentication if mutual TLS is enabled. See [Transport Layer Security](#transport-layer-security). |
### Relabel Configs
Relabel configs are used to control how detected pods are scraped. There are four options.
#### prometheus.io/scrape
When enabled, only pods with the `prometheus.io/scrape: "true"` annotation will be considered for scraping.
This option is enabled by default, to prevent the receiver from scraping all pods.
#### prometheus.io/path
The default HTTP path is `/metrics`. The path can be overridden by enabling this option and configuring
the `prometheus.io/path` annotation.
#### prometheus.io/scheme
When this option is enabled, the HTTP scraper (configured with the "Scrapers" option) will only scrape
pods that have the `prometheus.io/scheme: "http"` annotation set. Similarly, the HTTPS scraper will only
scrape pods that have the `prometheus.io/scheme: "https"` annotation set.
This option is recommended when using both HTTP and HTTPS scrapers.
#### prometheus.io/job-name
When this option is enabled, the `service.name` resource attribute will be set to the value of the
pod annotation `prometheus.io/job-name`. This allows you to dynamically set `service.name`, which defaults
to `kubernetes-pod-http` and `kubernetes-pod-https`, depending on which scraper is in use.
#### Example Configuration
When using Relabel configs, make sure to annotate your pods. Pod annotations are set at
`spec.template.metadata.annotations`, not to be confused with `metadata.annotations`.
```yaml theme={}
apiVersion: apps/v1
kind: Deployment
metadata:
name: nginx
spec:
selector:
matchLabels:
app: nginx
replicas: 2
template:
metadata:
annotations:
+ prometheus.io/path: /metrics
+ prometheus.io/port: '9113'
+ prometheus.io/scrape: 'true'
+ prometheus.io/scheme: http
+ prometheus.io/job-name: nginx
```
Updating pod annotations will cause your pods to be re-deployed.
### Transport Layer Security
When using TLS, if you need to configure a TLS certificate authority or a client key pair, update
your Telemetry Pipeline Agent YAML manifest to include a `volumeMount` that will mount your TLS files
into the container.
You can find documentation for mounting secrets into a container [here](https://kubernetes.io/docs/concepts/configuration/secret/).
## Example Configuration
By default, the Prometheus source is configured to use the HTTP scraper and the `prometheus.io/scrape`
relabel config is enabled. This means the receiver will only scrape pods that have `prometheus.io/scrape: "true"`
set in their annotations.
A cluster name is required, and will be set as `k8s.cluster.name`. You can use a placeholder value if you
intend to use [Resource Detection](/send-data/telemetry-pipeline/processors/detect-resource/) or [Add Fields](/send-data/telemetry-pipeline/processors/add-fields/)
processors.
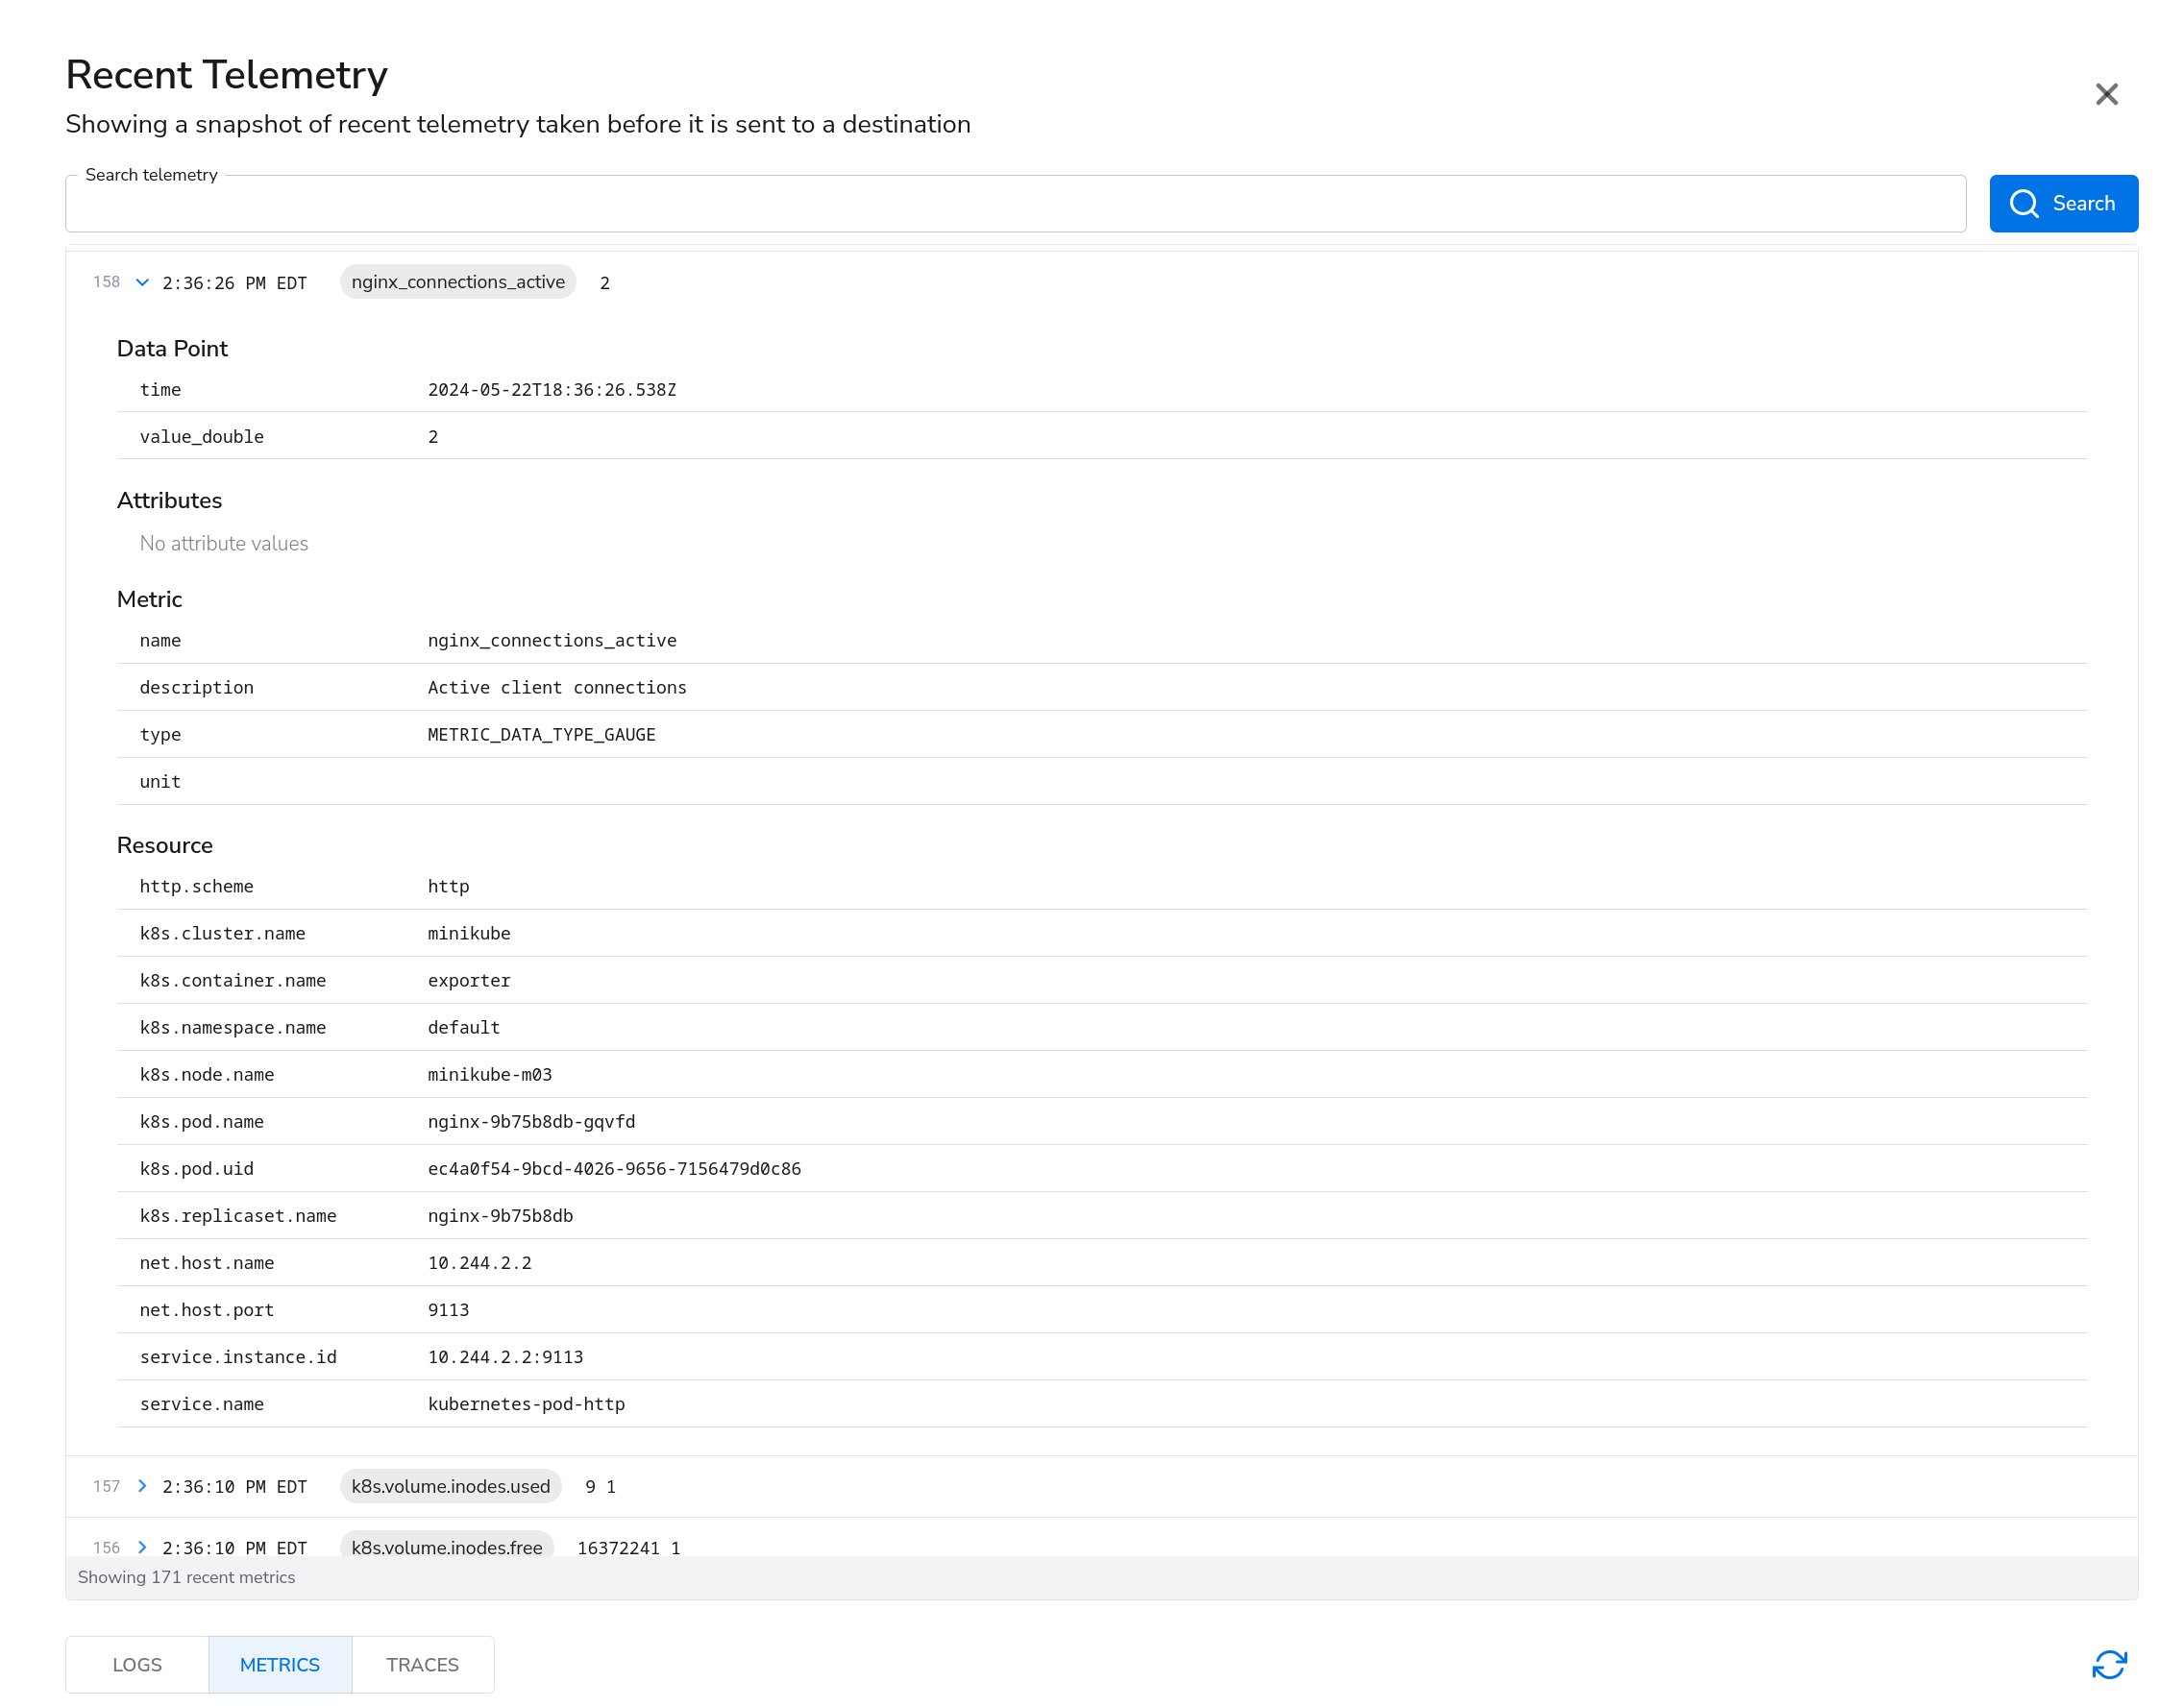
 Once running on an agent, some notable resource attributes are:
* k8s.cluster.name
* k8s.node.name
* k8s.container.name
* k8s.pod.name
* service.name: The name Prometheus job name
Once running on an agent, some notable resource attributes are:
* k8s.cluster.name
* k8s.node.name
* k8s.container.name
* k8s.pod.name
* service.name: The name Prometheus job name