> ## Documentation Index
> Fetch the complete documentation index at: https://docs.honeycomb.io/llms.txt
> Use this file to discover all available pages before exploring further.
# Custom
Ent+
This feature is available as an add-on for the [Honeycomb Enterprise plan](https://www.honeycomb.io/pricing/).
Please contact your Honeycomb account team for details.
## Description
This Custom source can be used to directly configure an OpenTelemetry Receiver. The Custom source
is useful for testing new receivers or for fulfilling a use case that is not supported by Telemetry Pipeline natively.
The Custom Source can only be used with components that are present in the Telemetry Pipeline Agent.
See the [Included Components](https://github.com/observIQ/bindplane-agent/tree/main#included-components)
documentation for a list of supported components.
## Supported Platforms
| Platform | Metrics | Logs | Traces |
| :--------------------------- | :------ | :--- | :----- |
| Linux | ✓ | ✓ | ✓ |
| Windows | ✓ | ✓ | ✓ |
| macOS | ✓ | ✓ | ✓ |
| Kubernetes Node (DaemonSet) | ✓ | ✓ | ✓ |
| Kubernetes Deployment | ✓ | ✓ | ✓ |
| Kubernetes Gateway | ✓ | ✓ | ✓ |
| OpenShift 4 Node (DaemonSet) | ✓ | ✓ | ✓ |
| OpenShift 4 Deployment | ✓ | ✓ | ✓ |
The supported platforms and types will be limited to those allowed by the specific receiver used in the configuration.
## Configuration
| Field | Description |
| :-------------- | :---------------------------------------------------------------------------------------------------------------- |
| Telemetry Types | The kind of telemetry that will be gathered by the receiver. Can be any combination of metrics, logs, and traces. |
| Configuration | The YAML configuration for the receiver. |
## Example Configuration
### SQL Server Receiver
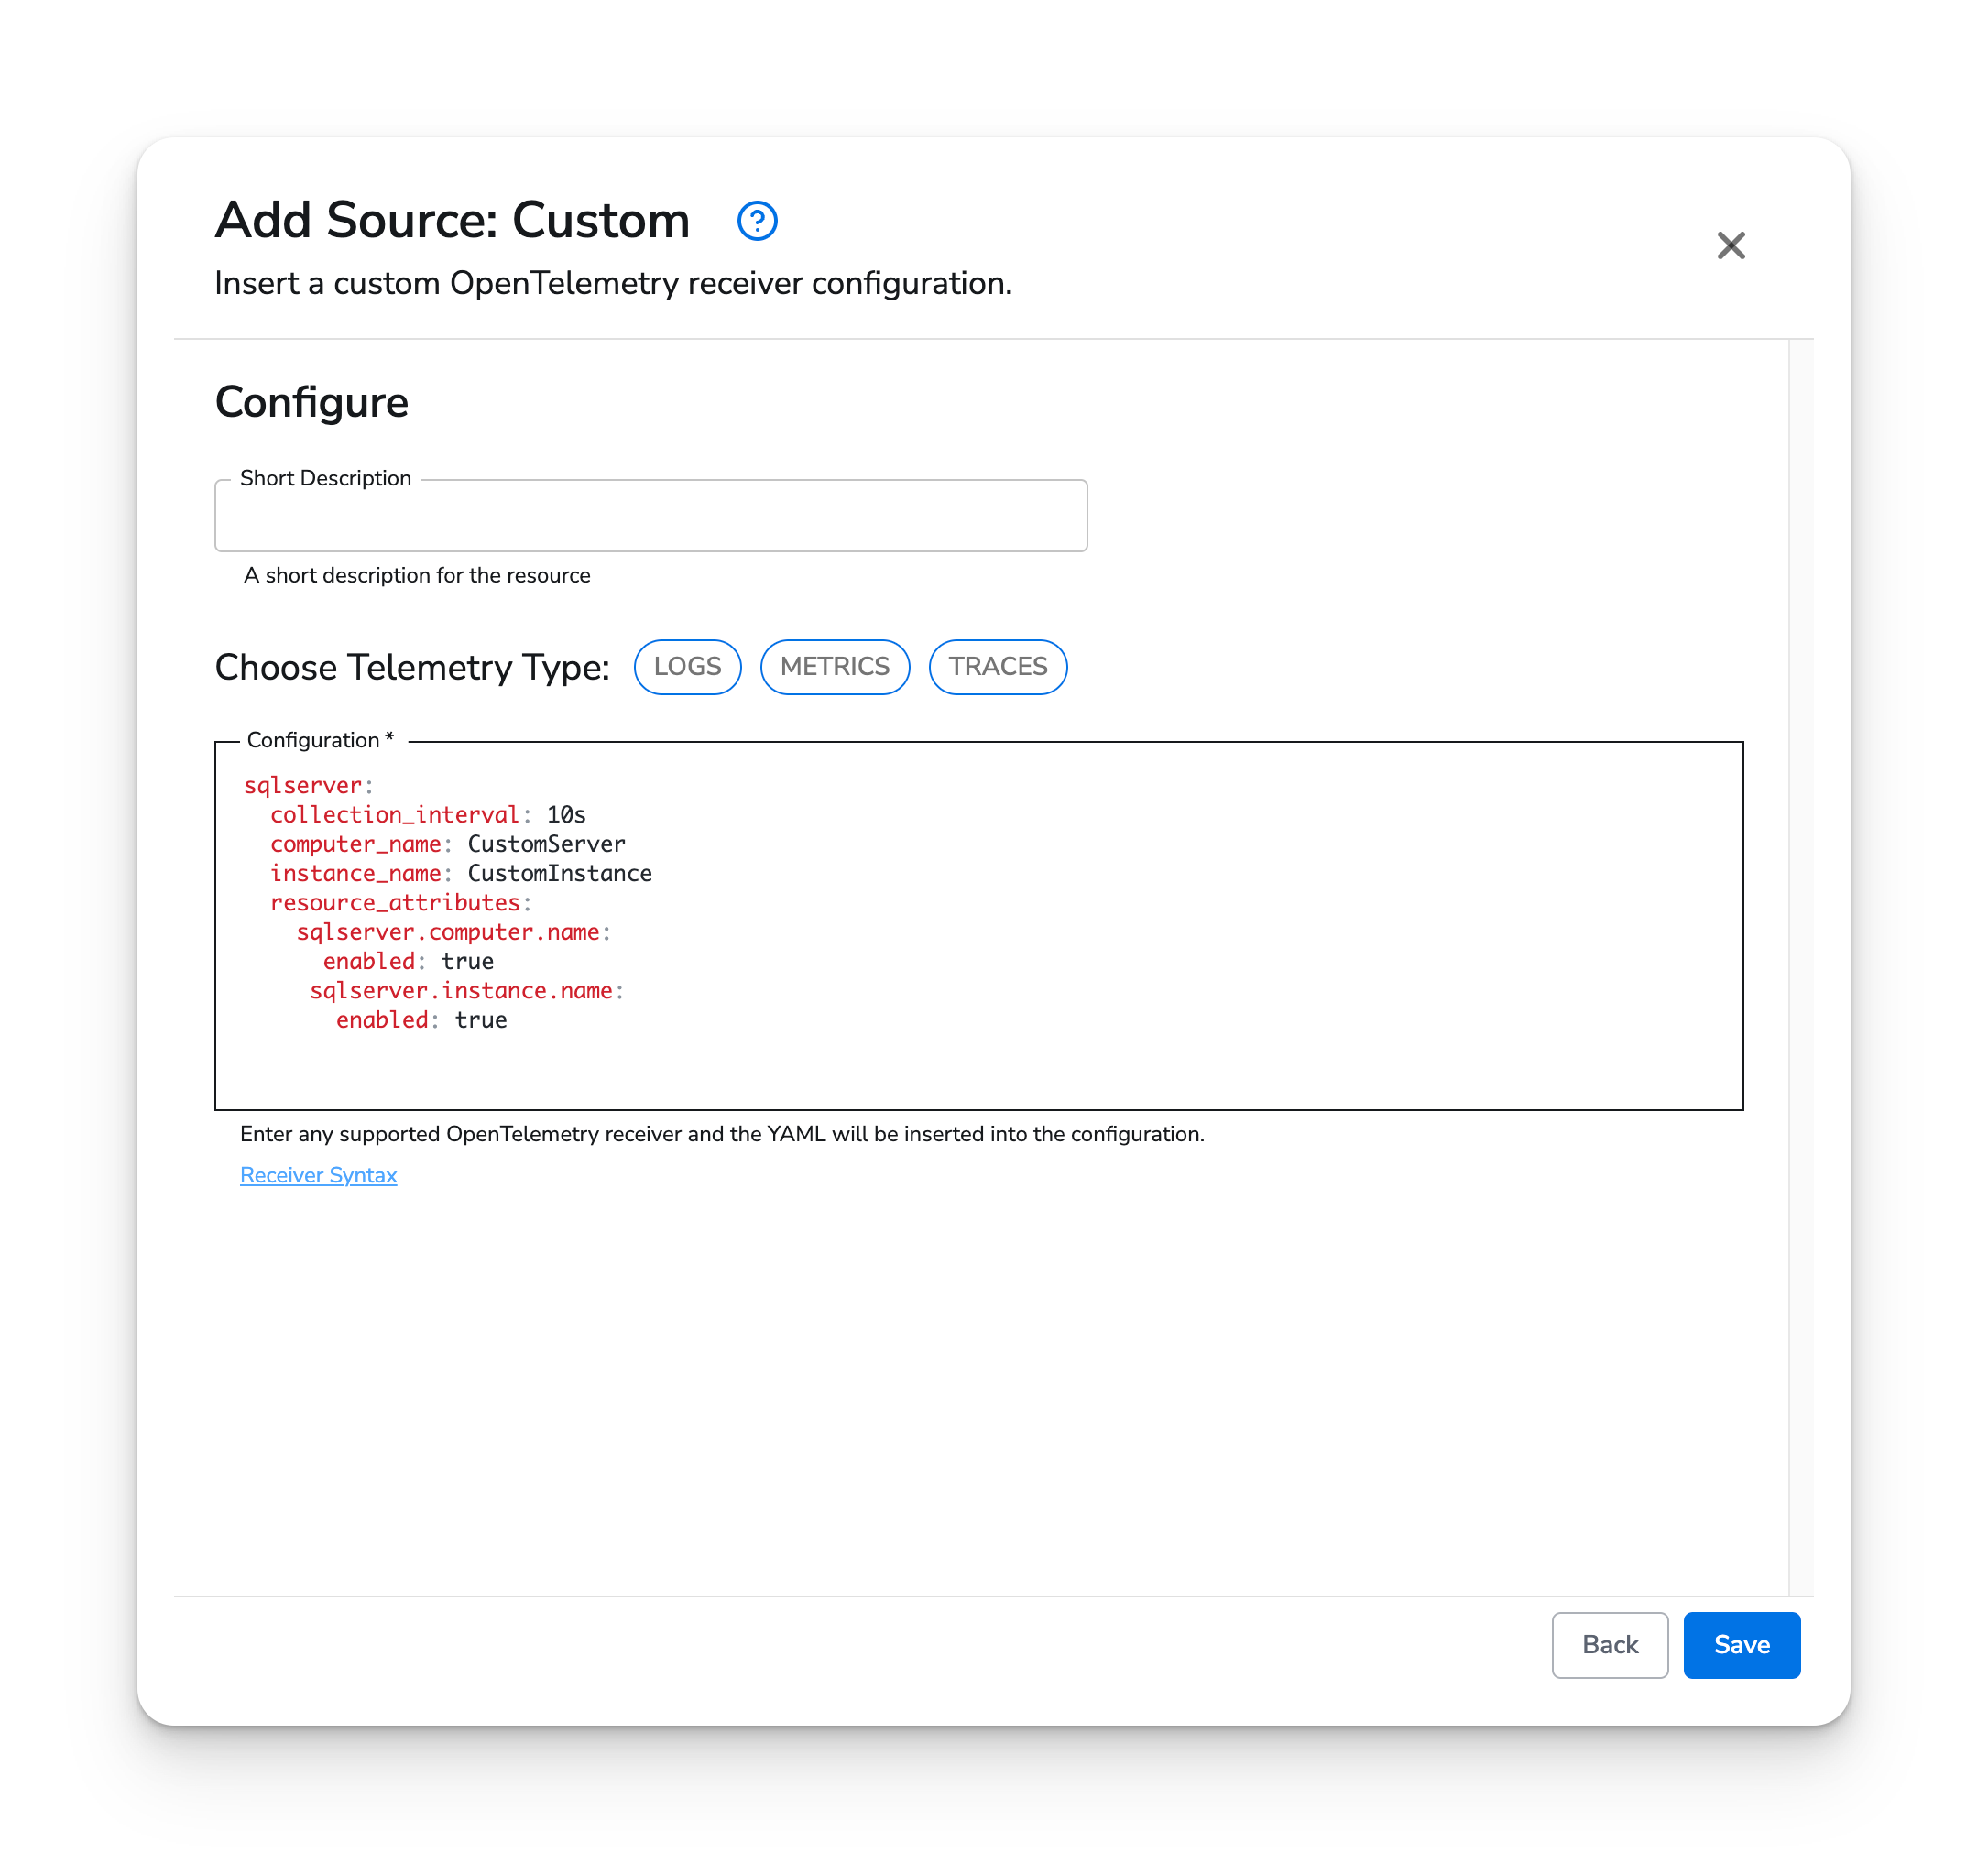
The [SQL Server Receiver](https://github.com/open-telemetry/opentelemetry-collector-contrib/tree/main/receiver/sqlserverreceiver) is already configurable via the [Microsoft SQL Server](https://observiq.com/docs/integrations/sources/microsoft-sql-server) source, but the custom source can be used to access configuration options that are not exposed in Telemetry Pipeline.
#### Web Interface
 #### Standalone Source
```yaml theme={}
apiVersion: bindplane.observiq.com/v1
kind: Source
metadata:
id: custom
name: custom
spec:
type: custom
parameters:
- name: telemetry_types
value:
- Logs
- Metrics
- Traces
- name: configuration
value: |-
sqlserver:
collection_interval: 10s
computer_name: CustomServer
instance_name: CustomInstance
resource_attributes:
sqlserver.computer.name:
enabled: true
sqlserver.instance.name:
enabled: true
```
#### Standalone Source
```yaml theme={}
apiVersion: bindplane.observiq.com/v1
kind: Source
metadata:
id: custom
name: custom
spec:
type: custom
parameters:
- name: telemetry_types
value:
- Logs
- Metrics
- Traces
- name: configuration
value: |-
sqlserver:
collection_interval: 10s
computer_name: CustomServer
instance_name: CustomInstance
resource_attributes:
sqlserver.computer.name:
enabled: true
sqlserver.instance.name:
enabled: true
```