> ## Documentation Index
> Fetch the complete documentation index at: https://docs.honeycomb.io/llms.txt
> Use this file to discover all available pages before exploring further.
# Add Custom Instrumentation
> Extend automatic OpenTelemetry instrumentation with custom spans, attributes, and events to capture the specific application behavior you need in Honeycomb.
The quickest way to start seeing your trace data in Honeycomb is to use [OpenTelemetry](https://opentelemetry.io/), an open-source collection of tools, APIs, and SDKs, to automatically inject instrumentation code into your application without requiring explicit changes to your codebase.
But to get the most insight into your system, you should also add custom instrumentation.
For example, if you have an application or service that handles users, you probably want to associate the user with the span created by automatic instrumentation.
Additionally, because automatic instrumentation doesn't know your business logic--it only knows about frameworks and languages--you'll want to explicitly add instrumentation code surrounding your business logic.
These instructions will guide you through the process of customizing your instrumentation to get additional visibility into the inner workings of your business logic.
To learn more about adding automatic instrumentation to your application, visit [Start Building: Honeycomb for Applications](/get-started/start-building/application/).
When deciding what to instrument, we recommend thinking of this as an exploratory process and part of the [core analysis loop](/get-started/honeycomb/core-analysis-loop).
You don't need to add your custom instrumentation to everything all at once.
Consider your top interests and instrument them.
Then analyze your results and add additional code as necessary.
## Acquiring Dependencies
Before you can customize your instrumentation, you must install any required dependencies. These will vary depending on your chosen programming language.
To continue, you must install OpenTelemetry's API package. Once you have installed the API package, you can use it to add instrumentation for everything you care about in your application.
This Quick Start uses the `npm` dependency manager.
For instructions with `yarn` or if using TypeScript, read our [OpenTelemetry Node.js documentation](/send-data/javascript-nodejs/opentelemetry-sdk/#add-custom-instrumentation).
```shell theme={}
npm install --save @opentelemetry/api
```
To continue, you must install OpenTelemetry's API package. Once you have installed the API package, you can use it to add instrumentation for everything you care about in your application.
This Quick Start uses the `pip` package manager.
For instructions with `poetry`, read our [OpenTelemetry Python documentation](/send-data/python/opentelemetry-sdk/#add-custom-instrumentation).
```shell theme={}
python -m pip install opentelemetry-api
```
To continue, you must install the OpenTelemetry API.
Once you have installed the API, you can use it to add instrumentation for everything you care about in your application.
This Quick Start uses the Gradle build tool.
```groovy theme={}
dependencies {
// Replace '{opentelemetry_java_instrumentation.version}' below with the version of the OTel JavaAgent in use.
implementation(platform("io.opentelemetry.instrumentation:opentelemetry-instrumentation-bom:{opentelemetry_java_instrumentation.version}"))
implementation("io.opentelemetry:opentelemetry-api")
implementation("io.opentelemetry.instrumentation:opentelemetry-instrumentation-annotations")
}
```
This Quick Start uses ASP.NET Core.
For other .NET configuration options, visit our [OpenTelemetry for .NET SDK](/send-data/dotnet/) documentation.
Because you already installed all necessary dependencies when implementing automatic instrumentation, you can skip this step.
Because you already installed all necessary dependencies when implementing automatic instrumentation, you can skip this step.
Because you already installed all necessary dependencies when implementing automatic instrumentation, you can skip this step.
If your preferred language is not covered here, you can find relevant instrumentation information in the [OpenTelemetry community documentation](https://opentelemetry.io/docs/languages/).
## Adding Contextual Information to Existing Spans
To enhance the understanding of your telemetry data, you can attach contextual information to the spans generated by automatic instrumentation.
Contextual information includes attributes, which are arbitrary key-value pairs that you can add to provide additional data about the span, such as a specific database query being executed or an HTTP request being made.
In this example, you will enhance your automatic instrumentation by associating a span created automatically when a user queries your service with the user's ID, which will be saved in an attribute called `user.id`.
Once this attribute is added, you will be able to use it to query your data in Honeycomb.
```js theme={}
const { trace } = require("@opentelemetry/api");
//...
function handleUser(user) {
// Gets the active span from the context
let activeSpan = trace.getActiveSpan();
// Sets an attribute that contains the user ID
activeSpan.setAttribute("user.id", user.getId());
}
```
```python theme={}
from opentelemetry import trace
#...
# Gets the active span from the context
span = trace.get_current_span()
# Sets an attribute that contains the user ID
span.set_attribute("user.id", user.id())
```
```java theme={}
import io.opentelemetry.api.trace.Span;
//...
// Gets the active span from the context
Span span = Span.current();
// Sets an attribute that contains the user ID
span.setAttribute("user.id", user.getId());
```
```csharp theme={}
using OpenTelemetry.Trace;
//...
// Gets the active span from the context
var currentSpan = Tracer.CurrentSpan;
// Sets an attribute that contains the user ID
currentSpan.SetAttribute("user.id", User.GetUserId())
```
This example assumes you are writing a web application with the `net/http` package.
```go theme={}
import (
// ...
"go.opentelemetry.io/otel/attribute"
"go.opentelemetry.io/otel/trace"
// ...
)
// ...
handler := func(w http.ResponseWriter, r *http.Request) {
// Gets the currently logged in user
user := someServiceCall()
ctx := r.Context()
// Gets the active span from the context
span := trace.SpanFromContext(ctx)
// Sets an attribute that contains the user ID
span.SetAttributes(attribute.Int("user.id", user.getID()))
}
// ...
```
```ruby theme={}
# Somewhere within the service, the SDK has been required and configured
require 'opentelemetry/sdk'
OpenTelemetry::SDK.configure do ... end
# ...
def handle_user(user)
# Gets the active span from the context
current_span = OpenTelemetry::Trace.current_span
# Sets an attribute that contains the user ID
current_span.set_attribute("user.id", user.id)
end
```
If your preferred language is not covered here, you can find relevant instrumentation information in the [OpenTelemetry community documentation](https://opentelemetry.io/docs/languages/).
## Creating Custom Spans
To further enhance the understanding of your telemetry data, you'll want to generate custom spans.
Automatic instrumentation can show the shape of requests to your system, but only you know the truly important parts.
To get the full picture, you should manually add spans to areas of interest. In OpenTelemetry, this is called manual instrumentation.
### Initialize a Tracer
Before you can create a custom span, you must initialize a tracer.
In OpenTelemetry, a tracer is used to instrument your code and generate telemetry data. The tracer provides the interface for capturing spans, which represent individual units of work in your code.
```js theme={}
const { trace } = require("@opentelemetry/api");
// Creates the tracer and names it.
// Choose a name that matches the appropriate scope for your trace.
// For example, if you have one tracer for each service, then use
// the service name. If you have multiple tracers that live in
// different "layers" of your application, then user the name that
// corresponds to the appropriate "layer".
const tracer = trace.getTracer("your.tracer.name");
```
```python theme={}
from opentelemetry import trace
#...
# Creates the tracer and names it.
# Choose a name that matches the appropriate scope for your trace.
# For example, if you have one tracer for each service, then use
# the service name. If you have multiple tracers that live in
# different "layers" of your application, then user the name that
# corresponds to the appropriate "layer".
tracer = trace.get_tracer("tracer.name.here")
```
```java theme={}
import io.opentelemetry.api.GlobalOpenTelemetry;
import io.opentelemetry.api.trace.Tracer;
//...
// Creates the tracer and names it.
// Choose a name that matches the appropriate scope for your trace.
// For example, if you have one tracer for each service, then use
// the service name. If you have multiple tracers that live in
// different "layers" of your application, then user the name that
// corresponds to the appropriate "layer".
Tracer tracer = GlobalOpenTelemetry.getTracer("tracer.name.here");
```
```csharp theme={}
using OpenTelemetry.Trace;
//...
// Creates the tracer and names it.
// Choose a name that matches the appropriate scope for your trace.
// For example, if you have one tracer for each service, then use
// the service name. If you have multiple tracers that live in
// different "layers" of your application, then user the name that
// corresponds to the appropriate "layer".
var tracer = TracerProvider.Default.GetTracer("tracer.name.here");
```
Then, inject the `Tracer` instance with ASP.NET Core dependency injection or manage its lifecycle manually.
```go theme={}
import (
// ...
"go.opentelemetry.io/otel"
// ...
)
//...
// Creates the tracer and names it.
// Choose a name that matches the appropriate scope for your trace.
// For example, if you have one tracer for each service, then use
// the service name. If you have multiple tracers that live in
// different "layers" of your application, then user the name that
// corresponds to the appropriate "layer".
tracer := otel.Tracer("tracer.name.here")
```
```ruby theme={}
require "opentelemetry/sdk"
#...
# Creates the tracer and names it.
# Choose a name that matches the appropriate scope for your trace.
# For example, if you have one tracer for each service, then use
# the service name. If you have multiple tracers that live in
# different "layers" of your application, then user the name that
# corresponds to the appropriate "layer".
tracer = OpenTelemetry.tracer_provider.tracer("tracer.name.here")
```
If your preferred language is not covered here, you can find relevant instrumentation information in the [OpenTelemetry community documentation](https://opentelemetry.io/docs/languages/).
### Create Your Span
Get the tracer from the OpenTelemetry API and use it to create your custom span.
```js theme={}
const { trace } = require("@opentelemetry/api");
const tracer = trace.getTracer("my-service-tracer");
function runQuery() {
tracer.startActiveSpan("expensive-query", (span) => {
// Do cool stuff
span.end();
});
}
```
```python theme={}
from opentelemetry import trace
tracer = trace.get_tracer("tracer.name.here")
with tracer.start_as_current_span("some-long-running-handler"):
# Prepare to auth
with tracer.start_as_current_span("what-it-takes-to-authorize-handling"):
# Perform auth
# Do the authorized long-running handling of cool stuff
```
```java theme={}
import io.opentelemetry.api.GlobalOpenTelemetry;
import io.opentelemetry.api.trace.Span;
import io.opentelemetry.api.trace.Tracer;
...
Tracer tracer = GlobalOpenTelemetry.getTracer("my-service");
Span span = tracer.spanBuilder("expensive-query").startSpan();
// ... Do cool stuff
span.end();
```
```csharp theme={}
using OpenTelemetry.Trace;
//...
using var span = TracerProvider.Default.GetTracer("my-service").StartActiveSpan("expensive-query")
// ... Do cool stuff
```
```go theme={}
import (
// ...
"go.opentelemetry.io/otel"
// ...
)
// ...
tracer := otel.Tracer("my-app") // If not already in scope
ctx, span := tracer.Start(ctx, "expensive-operation")
defer span.End()
// ...
```
```ruby theme={}
# Somewhere within the service, the SDK has been required and configured
require 'opentelemetry/sdk'
OpenTelemetry::SDK.configure do ... end
# ...
def run_query
tracer = OpenTelemetry.tracer_provider.tracer('my-tracer')
tracer.in_span("expensive-query") do |span|
# ... Do cool stuff
span.set_attribute('coolness', 100)
end
end
```
If your preferred language is not covered here, you can find relevant instrumentation information in the [OpenTelemetry community documentation](https://opentelemetry.io/docs/languages/).
## Analyzing Your Results
Now that you have customized your instrumentation, take a look at your trace.
We generated the following examples after adding additional custom spans (a note to indicate where we are in the process, plus `person name` and `message`) to our simple greeting service application written in Node.js.
You can [see the code in our GitHub repository](https://github.com/brianlangbecker/best-practices-blog).
Here's our example trace:
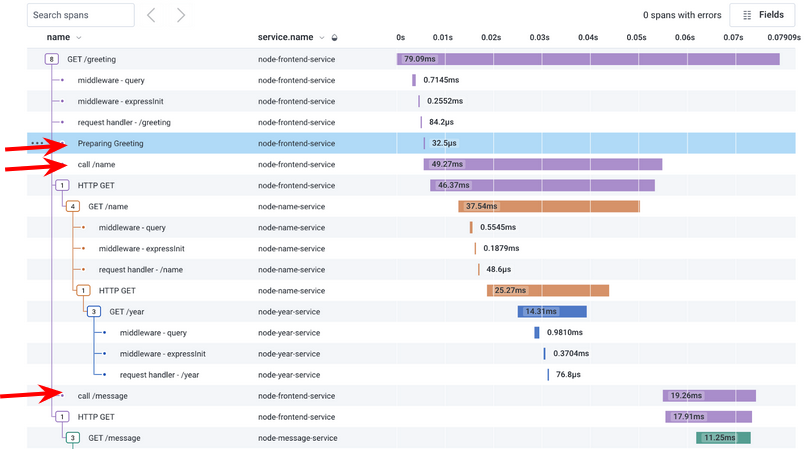 In this trace, you can see the additional spans:
* note indicating we are preparing the greeting
* call name
* call message
If you look in the **Fields** section of the UI, you would also see new attributes, such as the name of the person and the message that was sent.
## What's Next?
Excellent work!
If you made it this far, you should now have additional visibility into the inner workings of your business logic.
But there is so much more to explore!
To learn more about what you can do with Honeycomb, check out:
* [Ways to Explore Your Data](/observe/): Get a quick run-through of the different ways you can explore your data in Honeycomb.
* [Board Templates](/observe/boards/): Get key insights with one-click with out-of-the-box Board Templates.
* [Honeycomb's Sandbox](https://play.honeycomb.io/sandbox/tours): Explore common scenarios with real data.
* [DevRel Office Hours](https://www.honeycomb.io/devrel/observability-office-hours/): Join in on observability talk with world-class experts.
* [Integrations](/integrations/): Learn about other types of data you can explore with Honeycomb.
In this trace, you can see the additional spans:
* note indicating we are preparing the greeting
* call name
* call message
If you look in the **Fields** section of the UI, you would also see new attributes, such as the name of the person and the message that was sent.
## What's Next?
Excellent work!
If you made it this far, you should now have additional visibility into the inner workings of your business logic.
But there is so much more to explore!
To learn more about what you can do with Honeycomb, check out:
* [Ways to Explore Your Data](/observe/): Get a quick run-through of the different ways you can explore your data in Honeycomb.
* [Board Templates](/observe/boards/): Get key insights with one-click with out-of-the-box Board Templates.
* [Honeycomb's Sandbox](https://play.honeycomb.io/sandbox/tours): Explore common scenarios with real data.
* [DevRel Office Hours](https://www.honeycomb.io/devrel/observability-office-hours/): Join in on observability talk with world-class experts.
* [Integrations](/integrations/): Learn about other types of data you can explore with Honeycomb.