> ## Documentation Index
> Fetch the complete documentation index at: https://docs.honeycomb.io/llms.txt
> Use this file to discover all available pages before exploring further.
# Create a Telemetry Pipeline
> Set up an OpenTelemetry Collector pipeline for your Kubernetes cluster and start sending traces, logs, and metrics to Honeycomb in under 10 minutes.
export const siteurl = "https://docs.honeycomb.io/";
Whether you want to maximize Honeycomb's capabilities or begin with a more limited set of telemetry data for your Kubernetes applications, we recommend that you use [OpenTelemetry](https://opentelemetry.io/), a highly configurable, open-source, and vendor-neutral instrumentation framework.
In this guide, you will learn how to get answers about how your applications on Kubernetes are performing in production using OpenTelemetry Collectors and Honeycomb--and you'll do it in under 10 minutes.
When you finish, you'll have visibility into in-depth Kubernetes data, including Kubernetes logs, events, and node/cluster metrics.
And you'll be given the opportunity to take the next step toward leveraging Honeycomb's full potential by instrumenting your code.
## Overview
In the next 10 minutes, you will create a series of OpenTelemetry Collectors that will work together to pull in the correct telemetry and apply Kubernetes-specific data to it, which will help correlate issues.
Your implementation will also lay the foundation for your applications to send telemetry data, if you choose to instrument them.
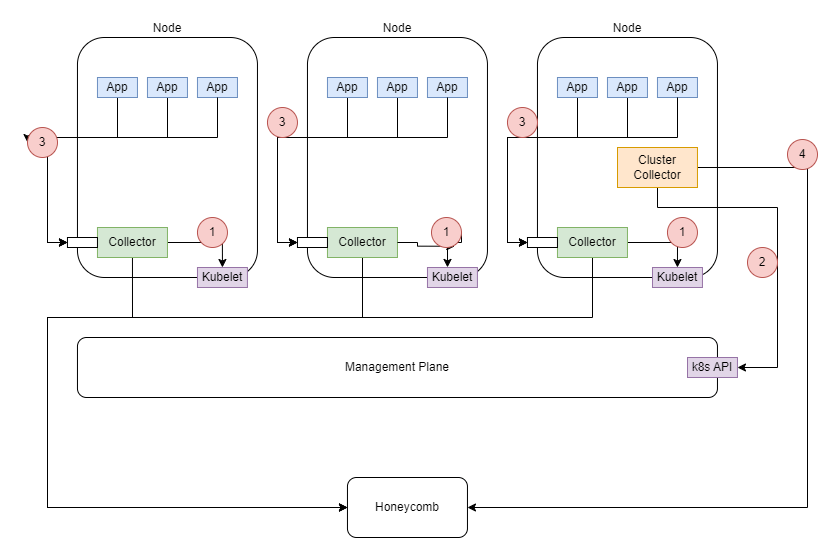 1. Each node will contain a Collector, which will use the node's Kubelet API to gather metrics data about the node and the node's pod resources.
2. The entire cluster will contain a separate Collector, which will use the Kubernetes API to get details about Kubernetes Events, such as active deployments.
3. Applications will be able to use the node's IP address to send telemetry data (logs, metrics, and traces) to the Collector that is local to the node, if you instrument them.
4. Each Collector will send telemetry data directly to Honeycomb over gRPC.
## Collected Data
When you finish, you will have access to:
* Default [metrics provided by Kubelet Stats](https://github.com/open-telemetry/opentelemetry-collector-contrib/blob/main/receiver/kubeletstatsreceiver/documentation.md) for nodes and pods, plus the optional `uptime`, `*_request_utilization`, and `*_limit_utilization` metrics
* Default [Kubernetes Cluster metrics](https://github.com/open-telemetry/opentelemetry-collector-contrib/blob/main/receiver/k8sclusterreceiver/documentation.md)
* All Kubernetes events from the cluster
* Additional Kubernetes metadata, plus all the pod's labels and annotations as resource attributes whenever possible, including:
* `k8s.namespace.name`
* `k8s.deployment.name`
* `k8s.statefulset.name`
* `k8s.daemonset.name`
* `k8s.cronjob.name`
* `k8s.job.name`
* `k8s.node.name`
* `k8s.pod.name`
* `k8s.pod.uid`
* `k8s.pod.start_time`
## Before You Begin
Before beginning this guide, you should have:
* Created a running Kubernetes cluster.
* Installed the `kubectl` command-line utility locally.
* Installed [Helm 3.9+](https://helm.sh/) locally.
* Deployed some applications to Kubernetes.
You'll also need your Honeycomb API Key.
You can [find your Honeycomb API Key](/configure/environments/manage-api-keys/#find-api-keys) in your Environment Settings.
Let's get started!
## Step 1: Create a Namespace
To help you manage your objects in the cluster, create a namespace to contain the collector infrastructure.
In this example, we call the namespace `honeycomb`.
```shell theme={}
kubectl create namespace honeycomb
```
## Step 2: Configure Kubernetes with Your Honeycomb API Key
Within your new namespace, create a Kubernetes Secret that contains your Honeycomb API Key.
You can [find your Honeycomb API Key](/configure/environments/manage-api-keys/#find-api-keys) in your environment in Honeycomb.
```shell theme={}
export HONEYCOMB_API_KEY=mykey
kubectl create secret generic honeycomb --from-literal=api-key=$HONEYCOMB_API_KEY --namespace=honeycomb
```
## Step 3: Add OpenTelemetry's Helm Repository
[OpenTelemetry's Helm GitHub repository](https://github.com/open-telemetry/opentelemetry-helm-charts) includes Helm charts with all of the resources you need to deploy Collectors to your Kubernetes cluster.
1. Add the repo:
```shell theme={}
helm repo add open-telemetry https://open-telemetry.github.io/opentelemetry-helm-charts
```
2. Update your repos to ensure Helm is aware of the latest versions:
```shell theme={}
helm repo update
```
## Step 4: Deploy Collectors
Deploy your Collectors:
* A Deployment-mode Collector to collect your cluster metrics.
* A DaemonSet-mode Collector to collect application telemetry data and metrics from your cluster's node(s).
You can deploy both Collectors using the same Helm chart, but with different names and values files.
Deploy the Deployment-mode Collector:
```shell theme={}
helm install otel-collector-cluster open-telemetry/opentelemetry-collector --namespace honeycomb --values https://docs.honeycomb.io/_assets/code-samples/kubernetes/values-files/values-deployment.yaml
```
[Download](/_assets/code-samples/kubernetes/values-files/values-deployment.yaml)
```yaml theme={}
mode: deployment
image:
repository: ghcr.io/open-telemetry/opentelemetry-collector-releases/opentelemetry-collector-k8s
extraEnvs:
- name: HONEYCOMB_API_KEY
valueFrom:
secretKeyRef:
name: honeycomb
key: api-key
# We only want one of these collectors - any more and we'd produce duplicate data
replicaCount: 1
presets:
# enables the k8sclusterreceiver and adds it to the metrics pipelines
clusterMetrics:
enabled: true
# enables the k8sobjectsreceiver to collect events only and adds it to the logs pipelines
kubernetesEvents:
enabled: true
config:
receivers:
k8s_cluster:
collection_interval: 30s
metrics:
# Disable replicaset metrics by default. These are typically high volume, low signal metrics.
# If volume is not a concern, then the following blocks can be removed.
k8s.replicaset.desired:
enabled: false
k8s.replicaset.available:
enabled: false
jaeger: null
zipkin: null
processors:
transform/events:
error_mode: ignore
log_statements:
- context: log
statements:
# adds a new watch-type attribute from the body if it exists
- set(attributes["watch-type"], body["type"]) where IsMap(body) and body["type"] != nil
# create new attributes from the body if the body is an object
- merge_maps(attributes, body, "upsert") where IsMap(body) and body["object"] == nil
- merge_maps(attributes, body["object"], "upsert") where IsMap(body) and body["object"] != nil
# Transform the attributes so that the log events use the k8s.* semantic conventions
- merge_maps(attributes, attributes[ "metadata"], "upsert") where IsMap(attributes[ "metadata"])
- set(attributes["k8s.pod.name"], attributes["regarding"]["name"]) where attributes["regarding"]["kind"] == "Pod"
- set(attributes["k8s.node.name"], attributes["regarding"]["name"]) where attributes["regarding"]["kind"] == "Node"
- set(attributes["k8s.job.name"], attributes["regarding"]["name"]) where attributes["regarding"]["kind"] == "Job"
- set(attributes["k8s.cronjob.name"], attributes["regarding"]["name"]) where attributes["regarding"]["kind"] == "CronJob"
- set(attributes["k8s.namespace.name"], attributes["regarding"]["namespace"]) where attributes["regarding"]["kind"] == "Pod" or attributes["regarding"]["kind"] == "Job" or attributes["regarding"]["kind"] == "CronJob"
# Transform the type attribtes into OpenTelemetry Severity types.
- set(severity_text, attributes["type"]) where attributes["type"] == "Normal" or attributes["type"] == "Warning"
- set(severity_number, SEVERITY_NUMBER_INFO) where attributes["type"] == "Normal"
- set(severity_number, SEVERITY_NUMBER_WARN) where attributes["type"] == "Warning"
exporters:
otlp/k8s-metrics:
endpoint: "api.honeycomb.io:443" # US instance
#endpoint: "api.eu1.honeycomb.io:443" # EU instance
headers:
"x-honeycomb-team": "${env:HONEYCOMB_API_KEY}"
"x-honeycomb-dataset": "k8s-metrics"
otlp/k8s-events:
endpoint: "api.honeycomb.io:443" # US instance
#endpoint: "api.eu1.honeycomb.io:443" # EU instance
headers:
"x-honeycomb-team": "${env:HONEYCOMB_API_KEY}"
"x-honeycomb-dataset": "k8s-events"
service:
pipelines:
traces: null
metrics:
receivers: [k8s_cluster]
exporters: [ otlp/k8s-metrics ]
logs:
receivers: [k8sobjects]
processors: [ memory_limiter, transform/events, batch ]
exporters: [ otlp/k8s-events ]
ports:
jaeger-compact:
enabled: false
jaeger-thrift:
enabled: false
jaeger-grpc:
enabled: false
zipkin:
enabled: false
```
Deploy the DaemonSet-mode Collector:
```shell theme={}
helm install otel-collector open-telemetry/opentelemetry-collector --namespace honeycomb --values https://docs.honeycomb.io/_assets/code-samples/kubernetes/values-files/values-daemonset.yaml
```
[Download](/_assets/code-samples/kubernetes/values-files/values-daemonset.yaml)
```yaml theme={}
mode: daemonset
image:
repository: ghcr.io/open-telemetry/opentelemetry-collector-releases/opentelemetry-collector-k8s
# Required to use the kubeletstats cpu/memory utilization metrics
clusterRole:
create: true
rules:
- apiGroups:
- ""
resources:
- nodes/proxy
verbs:
- get
extraEnvs:
- name: HONEYCOMB_API_KEY
valueFrom:
secretKeyRef:
name: honeycomb
key: api-key
presets:
# enables the k8sattributesprocessor and adds it to the traces, metrics, and logs pipelines
kubernetesAttributes:
enabled: true
extractAllPodLabels: true
extractAllPodAnnotations: true
# enables the kubeletstatsreceiver and adds it to the metrics pipelines
kubeletMetrics:
enabled: true
config:
receivers:
jaeger: null
zipkin: null
kubeletstats:
insecure_skip_verify: true # required as most clusters use self-signed certificates
collection_interval: 30s
metric_groups:
- node
- pod
metrics:
k8s.node.uptime:
enabled: true
k8s.pod.uptime:
enabled: true
k8s.pod.cpu_limit_utilization:
enabled: true
k8s.pod.cpu_request_utilization:
enabled: true
k8s.pod.memory_limit_utilization:
enabled: true
k8s.pod.memory_request_utilization:
enabled: true
exporters:
otlp_http:
endpoint: "https://api.honeycomb.io:443" # US instance
#endpoint: "https://api.eu1.honeycomb.io:443" # EU instance
headers:
"x-honeycomb-team": "${env:HONEYCOMB_API_KEY}"
otlp_http/k8s-metrics:
endpoint: "https://api.honeycomb.io:443" # US instance
#endpoint: "https://api.eu1.honeycomb.io:443" # EU instance
headers:
"x-honeycomb-team": "${env:HONEYCOMB_API_KEY}"
"x-honeycomb-dataset": "k8s-metrics"
otlp_http/k8s-logs:
endpoint: "https://api.honeycomb.io:443" # US instance
#endpoint: "https://api.eu1.honeycomb.io:443" # EU instance
headers:
"x-honeycomb-team": "${env:HONEYCOMB_API_KEY}"
"x-honeycomb-dataset": "k8s-logs"
service:
pipelines:
traces:
receivers: [otlp]
exporters: [otlp_http]
metrics:
receivers: [kubeletstats]
exporters: [otlp/k8s-metrics]
logs:
exporters: [otlp/k8s-logs]
ports:
jaeger-compact:
enabled: false
jaeger-thrift:
enabled: false
jaeger-grpc:
enabled: false
zipkin:
enabled: false
```
Deploy the Deployment-mode Collector:
```shell theme={}
helm install otel-collector-cluster open-telemetry/opentelemetry-collector --namespace honeycomb --values https://docs.honeycomb.io/_assets/code-samples/kubernetes/values-files/eu-values-deployment.yaml
```
[Download](/_assets/code-samples/kubernetes/values-files/eu-values-deployment.yaml)
```yaml theme={}
mode: deployment
image:
repository: ghcr.io/open-telemetry/opentelemetry-collector-releases/opentelemetry-collector-k8s
extraEnvs:
- name: HONEYCOMB_API_KEY
valueFrom:
secretKeyRef:
name: honeycomb
key: api-key
# We only want one of these collectors - any more and we'd produce duplicate data
replicaCount: 1
presets:
# enables the k8sclusterreceiver and adds it to the metrics pipelines
clusterMetrics:
enabled: true
# enables the k8sobjectsreceiver to collect events only and adds it to the logs pipelines
kubernetesEvents:
enabled: true
config:
receivers:
k8s_cluster:
collection_interval: 30s
metrics:
# Disable replicaset metrics by default. These are typically high volume, low signal metrics.
# If volume is not a concern, then the following blocks can be removed.
k8s.replicaset.desired:
enabled: false
k8s.replicaset.available:
enabled: false
jaeger: null
zipkin: null
processors:
transform/events:
error_mode: ignore
log_statements:
- context: log
statements:
# adds a new watch-type attribute from the body if it exists
- set(attributes["watch-type"], body["type"]) where IsMap(body) and body["type"] != nil
# create new attributes from the body if the body is an object
- merge_maps(attributes, body, "upsert") where IsMap(body) and body["object"] == nil
- merge_maps(attributes, body["object"], "upsert") where IsMap(body) and body["object"] != nil
# Transform the attributes so that the log events use the k8s.* semantic conventions
- merge_maps(attributes, attributes[ "metadata"], "upsert") where IsMap(attributes[ "metadata"])
- set(attributes["k8s.pod.name"], attributes["regarding"]["name"]) where attributes["regarding"]["kind"] == "Pod"
- set(attributes["k8s.node.name"], attributes["regarding"]["name"]) where attributes["regarding"]["kind"] == "Node"
- set(attributes["k8s.job.name"], attributes["regarding"]["name"]) where attributes["regarding"]["kind"] == "Job"
- set(attributes["k8s.cronjob.name"], attributes["regarding"]["name"]) where attributes["regarding"]["kind"] == "CronJob"
- set(attributes["k8s.namespace.name"], attributes["regarding"]["namespace"]) where attributes["regarding"]["kind"] == "Pod" or attributes["regarding"]["kind"] == "Job" or attributes["regarding"]["kind"] == "CronJob"
# Transform the type attribtes into OpenTelemetry Severity types.
- set(severity_text, attributes["type"]) where attributes["type"] == "Normal" or attributes["type"] == "Warning"
- set(severity_number, SEVERITY_NUMBER_INFO) where attributes["type"] == "Normal"
- set(severity_number, SEVERITY_NUMBER_WARN) where attributes["type"] == "Warning"
exporters:
otlp/k8s-metrics:
# endpoint: "api.honeycomb.io:443" # US instance
endpoint: "api.eu1.honeycomb.io:443" # EU instance
headers:
"x-honeycomb-team": "${env:HONEYCOMB_API_KEY}"
"x-honeycomb-dataset": "k8s-metrics"
otlp/k8s-events:
# endpoint: "api.honeycomb.io:443" # US instance
endpoint: "api.eu1.honeycomb.io:443" # EU instance
headers:
"x-honeycomb-team": "${env:HONEYCOMB_API_KEY}"
"x-honeycomb-dataset": "k8s-events"
service:
pipelines:
traces: null
metrics:
receivers: [k8s_cluster]
exporters: [ otlp/k8s-metrics ]
logs:
receivers: [k8sobjects]
processors: [ memory_limiter, transform/events, batch ]
exporters: [ otlp/k8s-events ]
ports:
jaeger-compact:
enabled: false
jaeger-thrift:
enabled: false
jaeger-grpc:
enabled: false
zipkin:
enabled: false
```
Deploy the DaemonSet-mode Collector:
```shell theme={}
helm install otel-collector open-telemetry/opentelemetry-collector --namespace honeycomb --values https://docs.honeycomb.io/_assets/code-samples/kubernetes/values-files/eu-values-daemonset.yaml
```
[Download](/_assets/code-samples/kubernetes/values-files/eu-values-daemonset.yaml)
```yaml theme={}
mode: daemonset
image:
repository: ghcr.io/open-telemetry/opentelemetry-collector-releases/opentelemetry-collector-k8s
# Required to use the kubeletstats cpu/memory utilization metrics
clusterRole:
create: true
rules:
- apiGroups:
- ""
resources:
- nodes/proxy
verbs:
- get
extraEnvs:
- name: HONEYCOMB_API_KEY
valueFrom:
secretKeyRef:
name: honeycomb
key: api-key
presets:
# enables the k8sattributesprocessor and adds it to the traces, metrics, and logs pipelines
kubernetesAttributes:
enabled: true
extractAllPodLabels: true
extractAllPodAnnotations: true
# enables the kubeletstatsreceiver and adds it to the metrics pipelines
kubeletMetrics:
enabled: true
config:
receivers:
jaeger: null
zipkin: null
kubeletstats:
insecure_skip_verify: true # required as most clusters use self-signed certificates
collection_interval: 30s
metric_groups:
- node
- pod
metrics:
k8s.node.uptime:
enabled: true
k8s.pod.uptime:
enabled: true
k8s.pod.cpu_limit_utilization:
enabled: true
k8s.pod.cpu_request_utilization:
enabled: true
k8s.pod.memory_limit_utilization:
enabled: true
k8s.pod.memory_request_utilization:
enabled: true
exporters:
otlp_http:
# endpoint: "https://api.honeycomb.io:443" # US instance
endpoint: "https://api.eu1.honeycomb.io:443" # EU instance
headers:
"x-honeycomb-team": "${env:HONEYCOMB_API_KEY}"
otlp_http/k8s-metrics:
# endpoint: "https://api.honeycomb.io:443" # US instance
endpoint: "https://api.eu1.honeycomb.io:443" # EU instance
headers:
"x-honeycomb-team": "${env:HONEYCOMB_API_KEY}"
"x-honeycomb-dataset": "k8s-metrics"
otlp_http/k8s-logs:
# endpoint: "https://api.honeycomb.io:443" # US instance
endpoint: "https://api.eu1.honeycomb.io:443" # EU instance
headers:
"x-honeycomb-team": "${env:HONEYCOMB_API_KEY}"
"x-honeycomb-dataset": "k8s-logs"
service:
pipelines:
traces:
receivers: [otlp]
exporters: [otlp_http]
metrics:
receivers: [kubeletstats]
exporters: [otlp_http/k8s-metrics]
logs:
exporters: [otlp_http/k8s-logs]
ports:
jaeger-compact:
enabled: false
jaeger-thrift:
enabled: false
jaeger-grpc:
enabled: false
zipkin:
enabled: false
```
If Collector installation fails and returns an error like the following:
```bash theme={}
Error: INSTALLATION FAILED: template: opentelemetry-collector/templates/service.yaml:38:28: executing "opentelemetry-collector/templates/service.yaml" at : error calling include: template: opentelemetry-collector/templates/_helpers.tpl:148:44: executing "opentelemetry-collector.serviceInternalTrafficPolicy" at : error calling eq: incompatible types for comparison
```
Make sure you have [Helm 3.9+](https://helm.sh/) installed, as older Helm versions typically cause this error.
## Step 5: Verify the Collector Installation
Check that the Collectors are installed by using the `kubectl` command to see if the pods are running:
```shell theme={}
kubectl get pods --namespace honeycomb
```
This command should return something like:
```pre theme={}
NAME READY STATUS RESTARTS AGE
otel-collector-cluster-opentelemetry-collector-7c9cc9f8d-k9ncw 1/1 Running 0 9m21s
otel-collector-opentelemetry-collector-agent-fcn5v 1/1 Running 0 17m
```
The result should contain one pod running under a name containing the prefix `otel-collector-cluster`, and one pod running under a name containing the word `agent` for each node in your Kubernetes cluster.
You should now have an OpenTelemetry installation in your cluster that can:
* Receive tracing data from service applications in your cluster and forward it to Honeycomb.
* Gather and send metrics data from all of the pods in your cluster.
* Gather and send metrics data about the nodes in your cluster.
## Explore Your Data in Honeycomb
After a few minutes, data should start flowing into Honeycomb.
If you do not see any data after several minutes, reach out for help in our [Pollinators Community Slack](/troubleshoot/community/#join-pollinators-community-slack).
Pro/Enterprise users can [visit Honeycomb Support](https://support.honeycomb.io/) or [email support@honeycomb.io](mailto:support@honeycomb.io).
To explore metrics related to your Kubernetes cluster, log in to Honeycomb and query the `k8s-metrics` dataset in your environment.
Try asking the Query Assistant questions like:
* "Show me the average CPU of my pods"
* "What's the P99 memory usage of my nodes?"
To explore the events emitted by Kubernetes itself, query the `k8s-events` dataset. These may be a little harder to understand, so try asking the Query Assistant questions like:
* "Show me the pods that have a reason of Started"
* "Show me pods that are crashing"
For each question you ask, the Query Assistant will create a general query.
You can further customize each query by adding visualizations, or by filtering or grouping the data.
## What's Next?
Now that you have created an observability pipeline and have gotten some metrics, you can use these to get even more visibility into your Kubernetes cluster.
* **Configure your applications to send data to the OpenTelemetry Collectors**
Have you already instrumented your applications with OpenTelemetry?
You'll need to [configure your pods and applications to send data to your new Collectors](/send-data/kubernetes/opentelemetry/collect-instrumented-code/).
* **Add low-code, automatic instrumentation to your applications**
Do you want more insight into your application data, but can't fully instrument your code yet?
You can get even more insight by using the OpenTelemetry Operator to automatically instrument your applications.
To learn more, visit [Low-Code Auto-Instrumentation with the OpenTelemetry Operator for Kubernetes](/send-data/kubernetes/opentelemetry/add-automatic-instrumentation/).
## Additional Information
The DaemonSet-mode Collector uses the following components:
* [Kubernetes Attribute Processor](/send-data/kubernetes/opentelemetry/components/#kubernetes-attributes-processor)
* [Kubeletstats Receiver](/send-data/kubernetes/opentelemetry/components/#kubeletstats-receiver)
The Deployment-mode Collector uses the following components:
* [Kubernetes Cluster Receiver](/send-data/kubernetes/opentelemetry/components/#kubernetes-cluster-receiver)
* [Kubernetes Objects Receiver](/send-data/kubernetes/opentelemetry/components/#kubernetes-objects-receiver)
1. Each node will contain a Collector, which will use the node's Kubelet API to gather metrics data about the node and the node's pod resources.
2. The entire cluster will contain a separate Collector, which will use the Kubernetes API to get details about Kubernetes Events, such as active deployments.
3. Applications will be able to use the node's IP address to send telemetry data (logs, metrics, and traces) to the Collector that is local to the node, if you instrument them.
4. Each Collector will send telemetry data directly to Honeycomb over gRPC.
## Collected Data
When you finish, you will have access to:
* Default [metrics provided by Kubelet Stats](https://github.com/open-telemetry/opentelemetry-collector-contrib/blob/main/receiver/kubeletstatsreceiver/documentation.md) for nodes and pods, plus the optional `uptime`, `*_request_utilization`, and `*_limit_utilization` metrics
* Default [Kubernetes Cluster metrics](https://github.com/open-telemetry/opentelemetry-collector-contrib/blob/main/receiver/k8sclusterreceiver/documentation.md)
* All Kubernetes events from the cluster
* Additional Kubernetes metadata, plus all the pod's labels and annotations as resource attributes whenever possible, including:
* `k8s.namespace.name`
* `k8s.deployment.name`
* `k8s.statefulset.name`
* `k8s.daemonset.name`
* `k8s.cronjob.name`
* `k8s.job.name`
* `k8s.node.name`
* `k8s.pod.name`
* `k8s.pod.uid`
* `k8s.pod.start_time`
## Before You Begin
Before beginning this guide, you should have:
* Created a running Kubernetes cluster.
* Installed the `kubectl` command-line utility locally.
* Installed [Helm 3.9+](https://helm.sh/) locally.
* Deployed some applications to Kubernetes.
You'll also need your Honeycomb API Key.
You can [find your Honeycomb API Key](/configure/environments/manage-api-keys/#find-api-keys) in your Environment Settings.
Let's get started!
## Step 1: Create a Namespace
To help you manage your objects in the cluster, create a namespace to contain the collector infrastructure.
In this example, we call the namespace `honeycomb`.
```shell theme={}
kubectl create namespace honeycomb
```
## Step 2: Configure Kubernetes with Your Honeycomb API Key
Within your new namespace, create a Kubernetes Secret that contains your Honeycomb API Key.
You can [find your Honeycomb API Key](/configure/environments/manage-api-keys/#find-api-keys) in your environment in Honeycomb.
```shell theme={}
export HONEYCOMB_API_KEY=mykey
kubectl create secret generic honeycomb --from-literal=api-key=$HONEYCOMB_API_KEY --namespace=honeycomb
```
## Step 3: Add OpenTelemetry's Helm Repository
[OpenTelemetry's Helm GitHub repository](https://github.com/open-telemetry/opentelemetry-helm-charts) includes Helm charts with all of the resources you need to deploy Collectors to your Kubernetes cluster.
1. Add the repo:
```shell theme={}
helm repo add open-telemetry https://open-telemetry.github.io/opentelemetry-helm-charts
```
2. Update your repos to ensure Helm is aware of the latest versions:
```shell theme={}
helm repo update
```
## Step 4: Deploy Collectors
Deploy your Collectors:
* A Deployment-mode Collector to collect your cluster metrics.
* A DaemonSet-mode Collector to collect application telemetry data and metrics from your cluster's node(s).
You can deploy both Collectors using the same Helm chart, but with different names and values files.
Deploy the Deployment-mode Collector:
```shell theme={}
helm install otel-collector-cluster open-telemetry/opentelemetry-collector --namespace honeycomb --values https://docs.honeycomb.io/_assets/code-samples/kubernetes/values-files/values-deployment.yaml
```
[Download](/_assets/code-samples/kubernetes/values-files/values-deployment.yaml)
```yaml theme={}
mode: deployment
image:
repository: ghcr.io/open-telemetry/opentelemetry-collector-releases/opentelemetry-collector-k8s
extraEnvs:
- name: HONEYCOMB_API_KEY
valueFrom:
secretKeyRef:
name: honeycomb
key: api-key
# We only want one of these collectors - any more and we'd produce duplicate data
replicaCount: 1
presets:
# enables the k8sclusterreceiver and adds it to the metrics pipelines
clusterMetrics:
enabled: true
# enables the k8sobjectsreceiver to collect events only and adds it to the logs pipelines
kubernetesEvents:
enabled: true
config:
receivers:
k8s_cluster:
collection_interval: 30s
metrics:
# Disable replicaset metrics by default. These are typically high volume, low signal metrics.
# If volume is not a concern, then the following blocks can be removed.
k8s.replicaset.desired:
enabled: false
k8s.replicaset.available:
enabled: false
jaeger: null
zipkin: null
processors:
transform/events:
error_mode: ignore
log_statements:
- context: log
statements:
# adds a new watch-type attribute from the body if it exists
- set(attributes["watch-type"], body["type"]) where IsMap(body) and body["type"] != nil
# create new attributes from the body if the body is an object
- merge_maps(attributes, body, "upsert") where IsMap(body) and body["object"] == nil
- merge_maps(attributes, body["object"], "upsert") where IsMap(body) and body["object"] != nil
# Transform the attributes so that the log events use the k8s.* semantic conventions
- merge_maps(attributes, attributes[ "metadata"], "upsert") where IsMap(attributes[ "metadata"])
- set(attributes["k8s.pod.name"], attributes["regarding"]["name"]) where attributes["regarding"]["kind"] == "Pod"
- set(attributes["k8s.node.name"], attributes["regarding"]["name"]) where attributes["regarding"]["kind"] == "Node"
- set(attributes["k8s.job.name"], attributes["regarding"]["name"]) where attributes["regarding"]["kind"] == "Job"
- set(attributes["k8s.cronjob.name"], attributes["regarding"]["name"]) where attributes["regarding"]["kind"] == "CronJob"
- set(attributes["k8s.namespace.name"], attributes["regarding"]["namespace"]) where attributes["regarding"]["kind"] == "Pod" or attributes["regarding"]["kind"] == "Job" or attributes["regarding"]["kind"] == "CronJob"
# Transform the type attribtes into OpenTelemetry Severity types.
- set(severity_text, attributes["type"]) where attributes["type"] == "Normal" or attributes["type"] == "Warning"
- set(severity_number, SEVERITY_NUMBER_INFO) where attributes["type"] == "Normal"
- set(severity_number, SEVERITY_NUMBER_WARN) where attributes["type"] == "Warning"
exporters:
otlp/k8s-metrics:
endpoint: "api.honeycomb.io:443" # US instance
#endpoint: "api.eu1.honeycomb.io:443" # EU instance
headers:
"x-honeycomb-team": "${env:HONEYCOMB_API_KEY}"
"x-honeycomb-dataset": "k8s-metrics"
otlp/k8s-events:
endpoint: "api.honeycomb.io:443" # US instance
#endpoint: "api.eu1.honeycomb.io:443" # EU instance
headers:
"x-honeycomb-team": "${env:HONEYCOMB_API_KEY}"
"x-honeycomb-dataset": "k8s-events"
service:
pipelines:
traces: null
metrics:
receivers: [k8s_cluster]
exporters: [ otlp/k8s-metrics ]
logs:
receivers: [k8sobjects]
processors: [ memory_limiter, transform/events, batch ]
exporters: [ otlp/k8s-events ]
ports:
jaeger-compact:
enabled: false
jaeger-thrift:
enabled: false
jaeger-grpc:
enabled: false
zipkin:
enabled: false
```
Deploy the DaemonSet-mode Collector:
```shell theme={}
helm install otel-collector open-telemetry/opentelemetry-collector --namespace honeycomb --values https://docs.honeycomb.io/_assets/code-samples/kubernetes/values-files/values-daemonset.yaml
```
[Download](/_assets/code-samples/kubernetes/values-files/values-daemonset.yaml)
```yaml theme={}
mode: daemonset
image:
repository: ghcr.io/open-telemetry/opentelemetry-collector-releases/opentelemetry-collector-k8s
# Required to use the kubeletstats cpu/memory utilization metrics
clusterRole:
create: true
rules:
- apiGroups:
- ""
resources:
- nodes/proxy
verbs:
- get
extraEnvs:
- name: HONEYCOMB_API_KEY
valueFrom:
secretKeyRef:
name: honeycomb
key: api-key
presets:
# enables the k8sattributesprocessor and adds it to the traces, metrics, and logs pipelines
kubernetesAttributes:
enabled: true
extractAllPodLabels: true
extractAllPodAnnotations: true
# enables the kubeletstatsreceiver and adds it to the metrics pipelines
kubeletMetrics:
enabled: true
config:
receivers:
jaeger: null
zipkin: null
kubeletstats:
insecure_skip_verify: true # required as most clusters use self-signed certificates
collection_interval: 30s
metric_groups:
- node
- pod
metrics:
k8s.node.uptime:
enabled: true
k8s.pod.uptime:
enabled: true
k8s.pod.cpu_limit_utilization:
enabled: true
k8s.pod.cpu_request_utilization:
enabled: true
k8s.pod.memory_limit_utilization:
enabled: true
k8s.pod.memory_request_utilization:
enabled: true
exporters:
otlp_http:
endpoint: "https://api.honeycomb.io:443" # US instance
#endpoint: "https://api.eu1.honeycomb.io:443" # EU instance
headers:
"x-honeycomb-team": "${env:HONEYCOMB_API_KEY}"
otlp_http/k8s-metrics:
endpoint: "https://api.honeycomb.io:443" # US instance
#endpoint: "https://api.eu1.honeycomb.io:443" # EU instance
headers:
"x-honeycomb-team": "${env:HONEYCOMB_API_KEY}"
"x-honeycomb-dataset": "k8s-metrics"
otlp_http/k8s-logs:
endpoint: "https://api.honeycomb.io:443" # US instance
#endpoint: "https://api.eu1.honeycomb.io:443" # EU instance
headers:
"x-honeycomb-team": "${env:HONEYCOMB_API_KEY}"
"x-honeycomb-dataset": "k8s-logs"
service:
pipelines:
traces:
receivers: [otlp]
exporters: [otlp_http]
metrics:
receivers: [kubeletstats]
exporters: [otlp/k8s-metrics]
logs:
exporters: [otlp/k8s-logs]
ports:
jaeger-compact:
enabled: false
jaeger-thrift:
enabled: false
jaeger-grpc:
enabled: false
zipkin:
enabled: false
```
Deploy the Deployment-mode Collector:
```shell theme={}
helm install otel-collector-cluster open-telemetry/opentelemetry-collector --namespace honeycomb --values https://docs.honeycomb.io/_assets/code-samples/kubernetes/values-files/eu-values-deployment.yaml
```
[Download](/_assets/code-samples/kubernetes/values-files/eu-values-deployment.yaml)
```yaml theme={}
mode: deployment
image:
repository: ghcr.io/open-telemetry/opentelemetry-collector-releases/opentelemetry-collector-k8s
extraEnvs:
- name: HONEYCOMB_API_KEY
valueFrom:
secretKeyRef:
name: honeycomb
key: api-key
# We only want one of these collectors - any more and we'd produce duplicate data
replicaCount: 1
presets:
# enables the k8sclusterreceiver and adds it to the metrics pipelines
clusterMetrics:
enabled: true
# enables the k8sobjectsreceiver to collect events only and adds it to the logs pipelines
kubernetesEvents:
enabled: true
config:
receivers:
k8s_cluster:
collection_interval: 30s
metrics:
# Disable replicaset metrics by default. These are typically high volume, low signal metrics.
# If volume is not a concern, then the following blocks can be removed.
k8s.replicaset.desired:
enabled: false
k8s.replicaset.available:
enabled: false
jaeger: null
zipkin: null
processors:
transform/events:
error_mode: ignore
log_statements:
- context: log
statements:
# adds a new watch-type attribute from the body if it exists
- set(attributes["watch-type"], body["type"]) where IsMap(body) and body["type"] != nil
# create new attributes from the body if the body is an object
- merge_maps(attributes, body, "upsert") where IsMap(body) and body["object"] == nil
- merge_maps(attributes, body["object"], "upsert") where IsMap(body) and body["object"] != nil
# Transform the attributes so that the log events use the k8s.* semantic conventions
- merge_maps(attributes, attributes[ "metadata"], "upsert") where IsMap(attributes[ "metadata"])
- set(attributes["k8s.pod.name"], attributes["regarding"]["name"]) where attributes["regarding"]["kind"] == "Pod"
- set(attributes["k8s.node.name"], attributes["regarding"]["name"]) where attributes["regarding"]["kind"] == "Node"
- set(attributes["k8s.job.name"], attributes["regarding"]["name"]) where attributes["regarding"]["kind"] == "Job"
- set(attributes["k8s.cronjob.name"], attributes["regarding"]["name"]) where attributes["regarding"]["kind"] == "CronJob"
- set(attributes["k8s.namespace.name"], attributes["regarding"]["namespace"]) where attributes["regarding"]["kind"] == "Pod" or attributes["regarding"]["kind"] == "Job" or attributes["regarding"]["kind"] == "CronJob"
# Transform the type attribtes into OpenTelemetry Severity types.
- set(severity_text, attributes["type"]) where attributes["type"] == "Normal" or attributes["type"] == "Warning"
- set(severity_number, SEVERITY_NUMBER_INFO) where attributes["type"] == "Normal"
- set(severity_number, SEVERITY_NUMBER_WARN) where attributes["type"] == "Warning"
exporters:
otlp/k8s-metrics:
# endpoint: "api.honeycomb.io:443" # US instance
endpoint: "api.eu1.honeycomb.io:443" # EU instance
headers:
"x-honeycomb-team": "${env:HONEYCOMB_API_KEY}"
"x-honeycomb-dataset": "k8s-metrics"
otlp/k8s-events:
# endpoint: "api.honeycomb.io:443" # US instance
endpoint: "api.eu1.honeycomb.io:443" # EU instance
headers:
"x-honeycomb-team": "${env:HONEYCOMB_API_KEY}"
"x-honeycomb-dataset": "k8s-events"
service:
pipelines:
traces: null
metrics:
receivers: [k8s_cluster]
exporters: [ otlp/k8s-metrics ]
logs:
receivers: [k8sobjects]
processors: [ memory_limiter, transform/events, batch ]
exporters: [ otlp/k8s-events ]
ports:
jaeger-compact:
enabled: false
jaeger-thrift:
enabled: false
jaeger-grpc:
enabled: false
zipkin:
enabled: false
```
Deploy the DaemonSet-mode Collector:
```shell theme={}
helm install otel-collector open-telemetry/opentelemetry-collector --namespace honeycomb --values https://docs.honeycomb.io/_assets/code-samples/kubernetes/values-files/eu-values-daemonset.yaml
```
[Download](/_assets/code-samples/kubernetes/values-files/eu-values-daemonset.yaml)
```yaml theme={}
mode: daemonset
image:
repository: ghcr.io/open-telemetry/opentelemetry-collector-releases/opentelemetry-collector-k8s
# Required to use the kubeletstats cpu/memory utilization metrics
clusterRole:
create: true
rules:
- apiGroups:
- ""
resources:
- nodes/proxy
verbs:
- get
extraEnvs:
- name: HONEYCOMB_API_KEY
valueFrom:
secretKeyRef:
name: honeycomb
key: api-key
presets:
# enables the k8sattributesprocessor and adds it to the traces, metrics, and logs pipelines
kubernetesAttributes:
enabled: true
extractAllPodLabels: true
extractAllPodAnnotations: true
# enables the kubeletstatsreceiver and adds it to the metrics pipelines
kubeletMetrics:
enabled: true
config:
receivers:
jaeger: null
zipkin: null
kubeletstats:
insecure_skip_verify: true # required as most clusters use self-signed certificates
collection_interval: 30s
metric_groups:
- node
- pod
metrics:
k8s.node.uptime:
enabled: true
k8s.pod.uptime:
enabled: true
k8s.pod.cpu_limit_utilization:
enabled: true
k8s.pod.cpu_request_utilization:
enabled: true
k8s.pod.memory_limit_utilization:
enabled: true
k8s.pod.memory_request_utilization:
enabled: true
exporters:
otlp_http:
# endpoint: "https://api.honeycomb.io:443" # US instance
endpoint: "https://api.eu1.honeycomb.io:443" # EU instance
headers:
"x-honeycomb-team": "${env:HONEYCOMB_API_KEY}"
otlp_http/k8s-metrics:
# endpoint: "https://api.honeycomb.io:443" # US instance
endpoint: "https://api.eu1.honeycomb.io:443" # EU instance
headers:
"x-honeycomb-team": "${env:HONEYCOMB_API_KEY}"
"x-honeycomb-dataset": "k8s-metrics"
otlp_http/k8s-logs:
# endpoint: "https://api.honeycomb.io:443" # US instance
endpoint: "https://api.eu1.honeycomb.io:443" # EU instance
headers:
"x-honeycomb-team": "${env:HONEYCOMB_API_KEY}"
"x-honeycomb-dataset": "k8s-logs"
service:
pipelines:
traces:
receivers: [otlp]
exporters: [otlp_http]
metrics:
receivers: [kubeletstats]
exporters: [otlp_http/k8s-metrics]
logs:
exporters: [otlp_http/k8s-logs]
ports:
jaeger-compact:
enabled: false
jaeger-thrift:
enabled: false
jaeger-grpc:
enabled: false
zipkin:
enabled: false
```
If Collector installation fails and returns an error like the following:
```bash theme={}
Error: INSTALLATION FAILED: template: opentelemetry-collector/templates/service.yaml:38:28: executing "opentelemetry-collector/templates/service.yaml" at : error calling include: template: opentelemetry-collector/templates/_helpers.tpl:148:44: executing "opentelemetry-collector.serviceInternalTrafficPolicy" at : error calling eq: incompatible types for comparison
```
Make sure you have [Helm 3.9+](https://helm.sh/) installed, as older Helm versions typically cause this error.
## Step 5: Verify the Collector Installation
Check that the Collectors are installed by using the `kubectl` command to see if the pods are running:
```shell theme={}
kubectl get pods --namespace honeycomb
```
This command should return something like:
```pre theme={}
NAME READY STATUS RESTARTS AGE
otel-collector-cluster-opentelemetry-collector-7c9cc9f8d-k9ncw 1/1 Running 0 9m21s
otel-collector-opentelemetry-collector-agent-fcn5v 1/1 Running 0 17m
```
The result should contain one pod running under a name containing the prefix `otel-collector-cluster`, and one pod running under a name containing the word `agent` for each node in your Kubernetes cluster.
You should now have an OpenTelemetry installation in your cluster that can:
* Receive tracing data from service applications in your cluster and forward it to Honeycomb.
* Gather and send metrics data from all of the pods in your cluster.
* Gather and send metrics data about the nodes in your cluster.
## Explore Your Data in Honeycomb
After a few minutes, data should start flowing into Honeycomb.
If you do not see any data after several minutes, reach out for help in our [Pollinators Community Slack](/troubleshoot/community/#join-pollinators-community-slack).
Pro/Enterprise users can [visit Honeycomb Support](https://support.honeycomb.io/) or [email support@honeycomb.io](mailto:support@honeycomb.io).
To explore metrics related to your Kubernetes cluster, log in to Honeycomb and query the `k8s-metrics` dataset in your environment.
Try asking the Query Assistant questions like:
* "Show me the average CPU of my pods"
* "What's the P99 memory usage of my nodes?"
To explore the events emitted by Kubernetes itself, query the `k8s-events` dataset. These may be a little harder to understand, so try asking the Query Assistant questions like:
* "Show me the pods that have a reason of Started"
* "Show me pods that are crashing"
For each question you ask, the Query Assistant will create a general query.
You can further customize each query by adding visualizations, or by filtering or grouping the data.
## What's Next?
Now that you have created an observability pipeline and have gotten some metrics, you can use these to get even more visibility into your Kubernetes cluster.
* **Configure your applications to send data to the OpenTelemetry Collectors**
Have you already instrumented your applications with OpenTelemetry?
You'll need to [configure your pods and applications to send data to your new Collectors](/send-data/kubernetes/opentelemetry/collect-instrumented-code/).
* **Add low-code, automatic instrumentation to your applications**
Do you want more insight into your application data, but can't fully instrument your code yet?
You can get even more insight by using the OpenTelemetry Operator to automatically instrument your applications.
To learn more, visit [Low-Code Auto-Instrumentation with the OpenTelemetry Operator for Kubernetes](/send-data/kubernetes/opentelemetry/add-automatic-instrumentation/).
## Additional Information
The DaemonSet-mode Collector uses the following components:
* [Kubernetes Attribute Processor](/send-data/kubernetes/opentelemetry/components/#kubernetes-attributes-processor)
* [Kubeletstats Receiver](/send-data/kubernetes/opentelemetry/components/#kubeletstats-receiver)
The Deployment-mode Collector uses the following components:
* [Kubernetes Cluster Receiver](/send-data/kubernetes/opentelemetry/components/#kubernetes-cluster-receiver)
* [Kubernetes Objects Receiver](/send-data/kubernetes/opentelemetry/components/#kubernetes-objects-receiver)