> ## Documentation Index
> Fetch the complete documentation index at: https://docs.honeycomb.io/llms.txt
> Use this file to discover all available pages before exploring further.
# Service Map
> Reference for the Service Map page in the Honeycomb UI, covering the service count header, traffic flow visualization, and span filtering controls.
export const HnyIcon = ({alias, path, size = 16, iconColor}) => {
const iconMap = {
"home": "house.svg",
"marker": "caretFilledDown.svg",
"show-marker-options": "chatTextLeft.svg",
"download": "arrowLineDown.svg",
"trace-waterfall": "trace.svg",
"show-query-details": "listDashes.svg",
"table": "table.svg",
"log-lines": "logLines.svg",
"chart": "chartLine.svg",
"show-settings": "gear.svg",
"add": "plus.svg",
"remove": "delete.svg",
"persist": "caretDown.svg",
"close": "close.svg",
"copy": "copy.svg",
"zoom-in": "magnifyingGlassPlus.svg",
"zoom-out": "magnifyingGlassMinus.svg",
"color-assignment": "drop.svg",
"drag": "dots-six-vertical.svg",
"drawer": "drawer.svg",
"show-actions": "dotsThree.svg",
"edit": "pencil.svg",
"delete": "trash.svg",
"move": "arrowsOutCardinal.svg",
"show-legend": "circleInfo.svg",
"usage-ok": "usageGood.svg",
"usage-warning": "usageWarning.svg",
"usage-danger": "usageDanger.svg",
"open-query-builder": "query.svg",
"home-menu": "house.svg",
"query-menu": "query.svg",
"boards-menu": "board.svg",
"triggers-menu": "bell.svg",
"slos-menu": "handshake.svg",
"service-map-menu": "serviceMap.svg",
"history-menu": "clockCounterClockwise.svg",
"manage-data-menu": "cube.svg",
"usage-menu": "usageGood.svg",
"canvas-menu": "sparkle.svg",
"anomalies-menu": "anomalies.svg",
"show-details": "dotsThreeVertical.svg",
"resize-handle": "board-panel-resize-handle.png",
"standard-dataset": "cube.svg",
"trace-dataset": "cubeChat.svg",
"all-datasets": "linkedSquares.svg",
"share": "arrowBentRight.svg",
"run-in-query-builder": "arrowSquareUpRight.svg",
"link": "link.svg",
"text": "text.svg",
"receive": "arrowLineDown.svg",
"process": "lightning.svg",
"sample": "drop.svg",
"send": "arrowLineUp.svg",
"submit": "arrowUp.svg",
"canvas-menu": "sparkle.svg",
"canvas": "sparkle.svg",
"chat-about-this-page": "sparkle.svg",
"private": "lockKey.svg",
"shared": "people.svg",
"expand": "caretDown.svg",
"previous": "caretLeft.svg",
"next": "caretRight.svg",
"expand-chat": "caretLeft.svg",
"minimize-chat": "caretRight.svg",
"open-in-canvas": "arrowSquareUpRight.svg"
};
const iconBasePath = "/_assets/icons/";
const iconPath = path || (alias ? `${iconBasePath}${iconMap[alias]}` : undefined);
return ;
};
## Interact with Service Map
At the top, the Service Map summarizes how many services are displayed.
 A label indicates when the Service Map last regenerated.
Use the **time picker** to modify the selected timespan.
Use a preset time range or a custom time range.
Navigate your selection history with the left and right arrows.
The Service Map displays a network of [services](#service) connected by [edges](#edge).
A label indicates when the Service Map last regenerated.
Use the **time picker** to modify the selected timespan.
Use a preset time range or a custom time range.
Navigate your selection history with the left and right arrows.
The Service Map displays a network of [services](#service) connected by [edges](#edge).
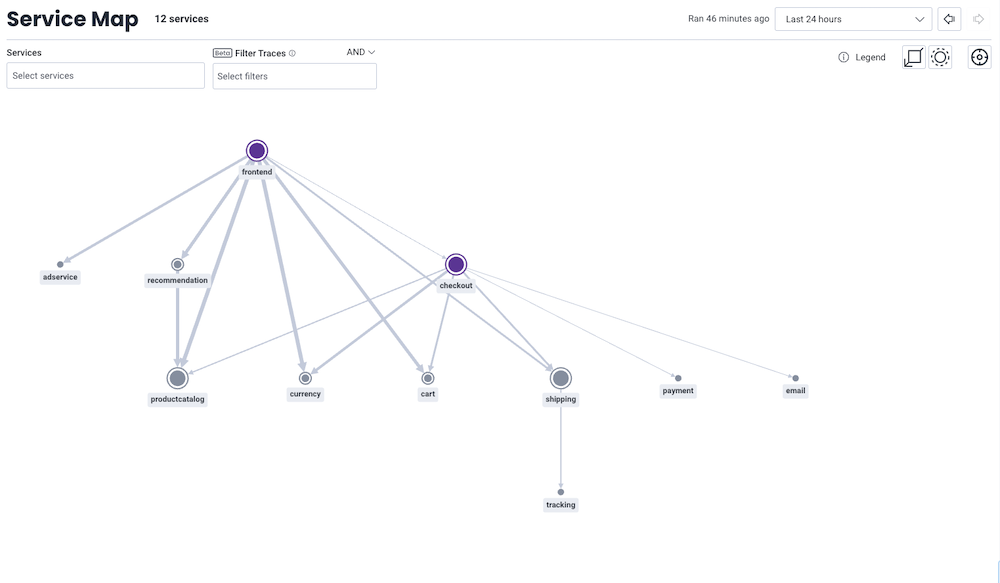 Use the [**Services**](#select-services) and [**Filter Traces**](#filter-traces) dropdowns in the top left corner to modify and show a specific view of your Service Map based on entered service names or specific fields.
Service Map will display a maximum of 300 services.
If your map is larger than 300 services, apply [filters](#filter-traces) to focus on a set of services important to you.
The [**Gateways**](#gateways) and [**Entry Services**](#entry-services) buttons in the top right corner highlight their respective service type.
Use your mouse or trackpad to magnify and view parts of the map in detail.
Use the **Recenter** button in the top right corner to reset the map display to an overview magnification level.
Select the **Show Legend** icon () to translate symbol meanings.
Select a service to trigger a hover box with service name and `p95` duration information.
Select **Isolate** in the hover box to activate [Isolate Mode](#isolate-mode).
Hovering on a service also highlights that service's dependencies within the Service Map.
The [right side panel](#right-side-panel) displays details about services and lists a sample of related traces.
Use the [**Services**](#select-services) and [**Filter Traces**](#filter-traces) dropdowns in the top left corner to modify and show a specific view of your Service Map based on entered service names or specific fields.
Service Map will display a maximum of 300 services.
If your map is larger than 300 services, apply [filters](#filter-traces) to focus on a set of services important to you.
The [**Gateways**](#gateways) and [**Entry Services**](#entry-services) buttons in the top right corner highlight their respective service type.
Use your mouse or trackpad to magnify and view parts of the map in detail.
Use the **Recenter** button in the top right corner to reset the map display to an overview magnification level.
Select the **Show Legend** icon () to translate symbol meanings.
Select a service to trigger a hover box with service name and `p95` duration information.
Select **Isolate** in the hover box to activate [Isolate Mode](#isolate-mode).
Hovering on a service also highlights that service's dependencies within the Service Map.
The [right side panel](#right-side-panel) displays details about services and lists a sample of related traces.
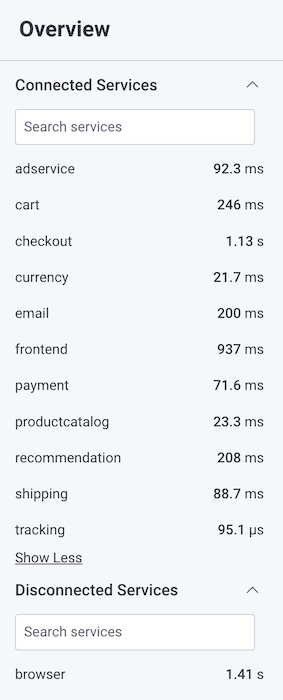 Use the collapsible [right side panel](#right-side-panel) to:
* view details about the entire map in Overview, or about a selected service or edge
* access a sample of traces
### Service
Each **Service** is represented by a circular node.
The size of the service represent the relative volume of requests that the service receives compared to other services in your environment.
Services in purple have the highest number of dependencies, or combined incoming and outgoing services.
The service's labels display the `service.name` value and its `p95` duration.
Disconnected services display separately from the main set of connected services.
Disconnected services are services that do not communicate to or reference other services.
Select a service to populate its details in the [right side panel](#right-side-panel).
### Edge
An **Edge**, or line, represent communication between two services.
The thickness of the edge represents the relative volume of requests between the two services compared to other services.
When it appears, the edge's label displays its `p95` duration.
Select an edge to populate its details in the [right side panel](#right-side-panel).
### Right Side Panel
The right side panel displays details about services, lists a sample of related traces, and provides the ability to filter and highlight.
The panel's title indicates if it summarizes the **Overall** Service Map, a specific service by its name, or a selected edge.
The panel displays an **Overall** view when the map initially loads, or when no service or edge is selected.
All services are displayed in an alphabetized list with their `p95` durations.
**Disconnected** appears in the Services list with the total of disconnected services present.
Disconnected services are services that do not communicate to or reference other services.
When a Service is selected, the side panel displays:
* Service Name
* Service `p95` Latency: The `p95` duration for this service to respond to requests
* [Traces](#traces): a sample of five related traces within the selected time range
* Incoming Services: a list of services that send requests to this service, and the `p95` duration between the selected service and the incoming service
* Outgoing Services: a list of services that this service sends requests to, and the `p95` duration between the selected service and the outgoing service
When an Edge is selected, the side panel displays:
* Edge `p95` Latency: The `p95` duration for the receiving service to respond to the requesting service
* [Traces](#traces): a sample of five related traces within the selected time range
* The requesting service and its overall `p95` latency
* The receiving service and its overall `p95` latency
#### Search Services
In the right side panel, use **Search services** to enter terms and search for a specific service.
As you type, Honeycomb updates the list of displayed services.
Use the collapsible [right side panel](#right-side-panel) to:
* view details about the entire map in Overview, or about a selected service or edge
* access a sample of traces
### Service
Each **Service** is represented by a circular node.
The size of the service represent the relative volume of requests that the service receives compared to other services in your environment.
Services in purple have the highest number of dependencies, or combined incoming and outgoing services.
The service's labels display the `service.name` value and its `p95` duration.
Disconnected services display separately from the main set of connected services.
Disconnected services are services that do not communicate to or reference other services.
Select a service to populate its details in the [right side panel](#right-side-panel).
### Edge
An **Edge**, or line, represent communication between two services.
The thickness of the edge represents the relative volume of requests between the two services compared to other services.
When it appears, the edge's label displays its `p95` duration.
Select an edge to populate its details in the [right side panel](#right-side-panel).
### Right Side Panel
The right side panel displays details about services, lists a sample of related traces, and provides the ability to filter and highlight.
The panel's title indicates if it summarizes the **Overall** Service Map, a specific service by its name, or a selected edge.
The panel displays an **Overall** view when the map initially loads, or when no service or edge is selected.
All services are displayed in an alphabetized list with their `p95` durations.
**Disconnected** appears in the Services list with the total of disconnected services present.
Disconnected services are services that do not communicate to or reference other services.
When a Service is selected, the side panel displays:
* Service Name
* Service `p95` Latency: The `p95` duration for this service to respond to requests
* [Traces](#traces): a sample of five related traces within the selected time range
* Incoming Services: a list of services that send requests to this service, and the `p95` duration between the selected service and the incoming service
* Outgoing Services: a list of services that this service sends requests to, and the `p95` duration between the selected service and the outgoing service
When an Edge is selected, the side panel displays:
* Edge `p95` Latency: The `p95` duration for the receiving service to respond to the requesting service
* [Traces](#traces): a sample of five related traces within the selected time range
* The requesting service and its overall `p95` latency
* The receiving service and its overall `p95` latency
#### Search Services
In the right side panel, use **Search services** to enter terms and search for a specific service.
As you type, Honeycomb updates the list of displayed services.
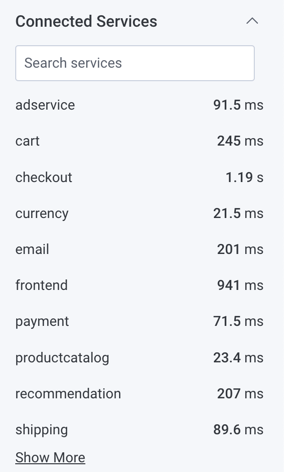 #### Traces
In the right side panel, Service Map provides sample traces that correspond to the Service Map.
When selecting a service or edge, the right side panel updates to display a list of five traces that contain the selected service(s).
#### Traces
In the right side panel, Service Map provides sample traces that correspond to the Service Map.
When selecting a service or edge, the right side panel updates to display a list of five traces that contain the selected service(s).
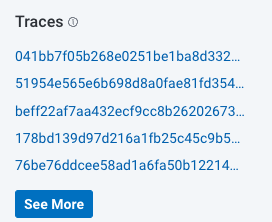 Select **See More** for a longer list of traces in [Query Builder](/investigate/query/build/) and the ability to explore related traces in detail.
For a service, **See More** creates a query with a filter where `service.name = `.
For an edge, **See More** creates a query with a filter where ` calls = true`.
This unique filter includes a custom-created Honeycomb [calculated field](/configure/environments/calculated-fields/), specific for this query, to isolate traces where the requesting service (``) calls the receiving service (``).
If any [filter](#filter-traces) is applied to Service Map, **See More** creates a query as described above and includes an additional [calculated field](/configure/environments/calculated-fields/)-based filter where the applied filter's conditions are also met.
### Select Services
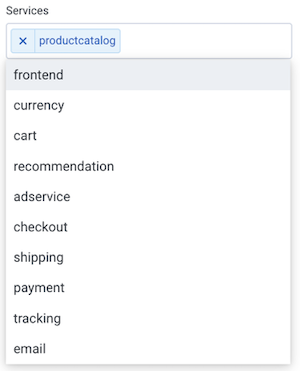
In the **Services** dropdown, enter one or more service names to modify the Service Map display and show only the entered service(s).
As you type, Honeycomb autocomplete prompts with selectable service names.
Select **See More** for a longer list of traces in [Query Builder](/investigate/query/build/) and the ability to explore related traces in detail.
For a service, **See More** creates a query with a filter where `service.name = `.
For an edge, **See More** creates a query with a filter where ` calls = true`.
This unique filter includes a custom-created Honeycomb [calculated field](/configure/environments/calculated-fields/), specific for this query, to isolate traces where the requesting service (``) calls the receiving service (``).
If any [filter](#filter-traces) is applied to Service Map, **See More** creates a query as described above and includes an additional [calculated field](/configure/environments/calculated-fields/)-based filter where the applied filter's conditions are also met.
### Select Services
In the **Services** dropdown, enter one or more service names to modify the Service Map display and show only the entered service(s).
As you type, Honeycomb autocomplete prompts with selectable service names.
 ### Filter Traces
In the **Filter Traces** dropdown, enter fields to modify the Service Map display and show only services with traces that contain at least one span that matches the entered criteria.
To define a filter, enter a field name, operator, and field value.
As you enter terms, Honeycomb autocomplete prompts with selectable field options.
### Filter Traces
In the **Filter Traces** dropdown, enter fields to modify the Service Map display and show only services with traces that contain at least one span that matches the entered criteria.
To define a filter, enter a field name, operator, and field value.
As you enter terms, Honeycomb autocomplete prompts with selectable field options.
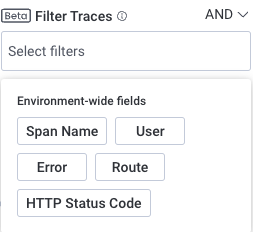 Use the environment-wide fields that appear as a prompt to start defining a filter.
For example, use the `Route` preset to filter for all routes that contains `/checkout`.
The following environment-wide preset filters are available and based on each dataset's [dataset definitions](/configure/datasets/definitions/):
* Name
* User
* Error
* Route
* Status Code
### Isolate Mode
**Isolate Mode** focuses the map to display a single service and its immediate dependents.
Use the environment-wide fields that appear as a prompt to start defining a filter.
For example, use the `Route` preset to filter for all routes that contains `/checkout`.
The following environment-wide preset filters are available and based on each dataset's [dataset definitions](/configure/datasets/definitions/):
* Name
* User
* Error
* Route
* Status Code
### Isolate Mode
**Isolate Mode** focuses the map to display a single service and its immediate dependents.
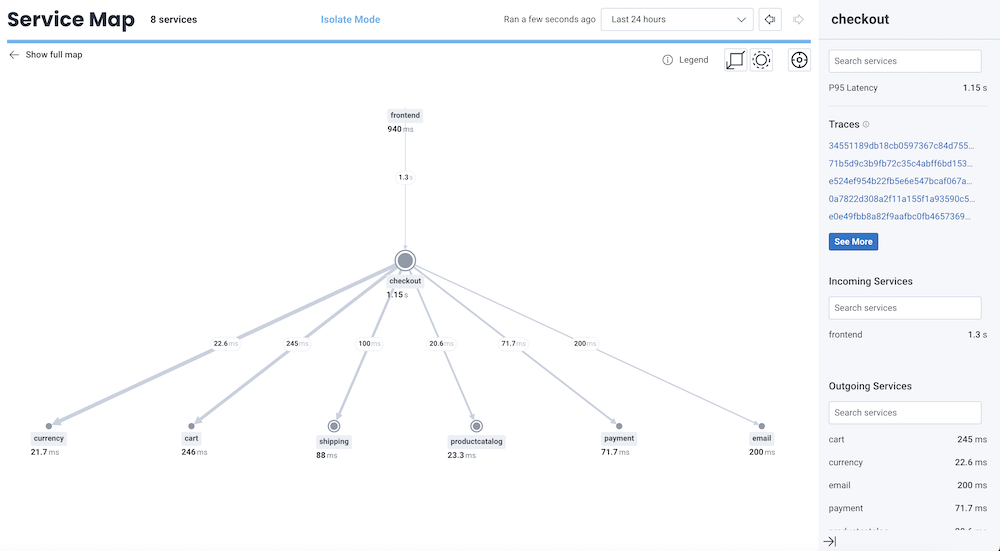 When activated, "Isolate Mode" appears at the top of the Service Map display to indicate its status.
The map updates to show only the target service, the **Incoming Services** that send requests to the target service, and **Outgoing Services** that the target service sends request to.
Select **Show full map** at the top left to leave Isolate Mode and return to the overall map.
### Gateways
Use **Gateways** to illustrate which services communicate to another through a known gateway.
When activated, "Isolate Mode" appears at the top of the Service Map display to indicate its status.
The map updates to show only the target service, the **Incoming Services** that send requests to the target service, and **Outgoing Services** that the target service sends request to.
Select **Show full map** at the top left to leave Isolate Mode and return to the overall map.
### Gateways
Use **Gateways** to illustrate which services communicate to another through a known gateway.
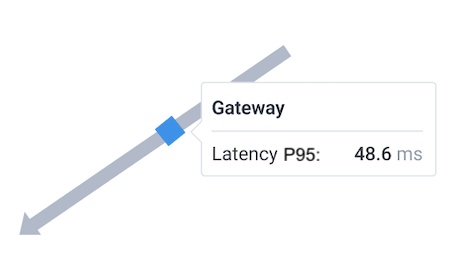
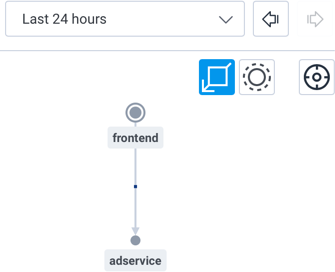 When toggled on, any **Gateway** appears as a blue square on an edge.
Hover over the blue square to see the Gateway's name and its `p95` latency.
When toggled on, any **Gateway** appears as a blue square on an edge.
Hover over the blue square to see the Gateway's name and its `p95` latency.
 [Learn more about instrumenting gateways](/observe/service-map/#instrument-for-gateways).
### Entry Services
Use **Entry Services** to highlight which services are in the root span of any trace.
[Learn more about instrumenting gateways](/observe/service-map/#instrument-for-gateways).
### Entry Services
Use **Entry Services** to highlight which services are in the root span of any trace.
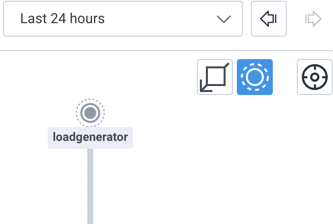 Toggle **Entry Services** in the top right corner of the Service Map to modify the Service Map display.
When activated, any Entry Service appears with an additional dashed circle around its circular node.
Toggle **Entry Services** in the top right corner of the Service Map to modify the Service Map display.
When activated, any Entry Service appears with an additional dashed circle around its circular node.