> ## Documentation Index
> Fetch the complete documentation index at: https://docs.honeycomb.io/llms.txt
> Use this file to discover all available pages before exploring further.
# Board Detail
> Reference for the Board Detail page in the Honeycomb UI, which shows a single Board's queries, SLOs, and options for editing and sharing.
export const HnyIcon = ({alias, path, size = 16, iconColor}) => {
const iconMap = {
"home": "house.svg",
"marker": "caretFilledDown.svg",
"show-marker-options": "chatTextLeft.svg",
"download": "arrowLineDown.svg",
"trace-waterfall": "trace.svg",
"show-query-details": "listDashes.svg",
"table": "table.svg",
"log-lines": "logLines.svg",
"chart": "chartLine.svg",
"show-settings": "gear.svg",
"add": "plus.svg",
"remove": "delete.svg",
"persist": "caretDown.svg",
"close": "close.svg",
"copy": "copy.svg",
"zoom-in": "magnifyingGlassPlus.svg",
"zoom-out": "magnifyingGlassMinus.svg",
"color-assignment": "drop.svg",
"drag": "dots-six-vertical.svg",
"drawer": "drawer.svg",
"show-actions": "dotsThree.svg",
"edit": "pencil.svg",
"delete": "trash.svg",
"move": "arrowsOutCardinal.svg",
"show-legend": "circleInfo.svg",
"usage-ok": "usageGood.svg",
"usage-warning": "usageWarning.svg",
"usage-danger": "usageDanger.svg",
"open-query-builder": "query.svg",
"home-menu": "house.svg",
"query-menu": "query.svg",
"boards-menu": "board.svg",
"triggers-menu": "bell.svg",
"slos-menu": "handshake.svg",
"service-map-menu": "serviceMap.svg",
"history-menu": "clockCounterClockwise.svg",
"manage-data-menu": "cube.svg",
"usage-menu": "usageGood.svg",
"canvas-menu": "sparkle.svg",
"anomalies-menu": "anomalies.svg",
"show-details": "dotsThreeVertical.svg",
"resize-handle": "board-panel-resize-handle.png",
"standard-dataset": "cube.svg",
"trace-dataset": "cubeChat.svg",
"all-datasets": "linkedSquares.svg",
"share": "arrowBentRight.svg",
"run-in-query-builder": "arrowSquareUpRight.svg",
"link": "link.svg",
"text": "text.svg",
"receive": "arrowLineDown.svg",
"process": "lightning.svg",
"sample": "drop.svg",
"send": "arrowLineUp.svg",
"submit": "arrowUp.svg",
"canvas-menu": "sparkle.svg",
"canvas": "sparkle.svg",
"chat-about-this-page": "sparkle.svg",
"private": "lockKey.svg",
"shared": "people.svg",
"expand": "caretDown.svg",
"previous": "caretLeft.svg",
"next": "caretRight.svg",
"expand-chat": "caretLeft.svg",
"minimize-chat": "caretRight.svg",
"open-in-canvas": "arrowSquareUpRight.svg"
};
const iconBasePath = "/_assets/icons/";
const iconPath = path || (alias ? `${iconBasePath}${iconMap[alias]}` : undefined);
return ;
};
Explore an individual workspace using the **Board Detail** page.
## What is the Board Detail page?
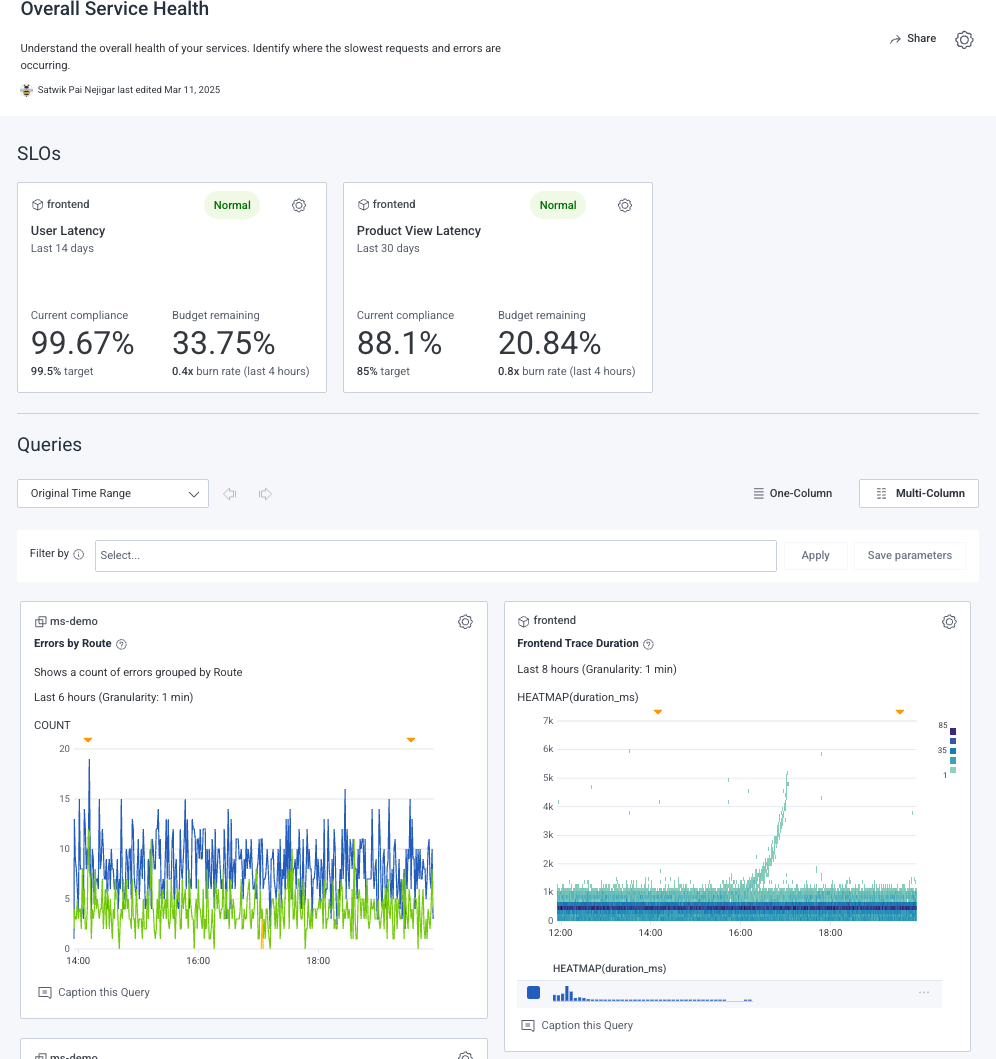
The **Board Detail** page provides a focused view of a single Board, including its associated queries and Service Level Objectives (SLOs).
Use this page to review key information, analyze data, and manage settings for an individual Board.
## Layout and Components
The **Board Detail** page is divided into these sections:
* **Board Details and Actions**: Displays key information about the Board and provides management options.
* **SLOs**: Shows Service Level Objectives (SLOs) added to the Board, along with their current status and compliance metrics.
* **Queries**: Shows queries added to the Board, allowing you to explore and customize data analysis.
 ## Board Details and Actions
This section provides key information about the Board and tools to manage it.
Use this section to keep your board organized and up to date.
## Board Details and Actions
This section provides key information about the Board and tools to manage it.
Use this section to keep your board organized and up to date.
 ### Board Details
This section provides essential information about the Board, including:
* **Board name**: Assigned title of the Board.
* **Board description**: Brief explanation of the Board's purpose or contents.
* **Last edited by and date**: Name of the last person who modified the Board and when.
* **Tags**: Key:value pairs assigned to the Board. Valid on Flexible Boards only.
### Board Actions
Manage your Board using these options:
* **Share** (): Share the Board and manage collaborator access.
* **Manage Board settings** (): Access key actions:
* **Add query**: Attach a new or existing query.
* **Add SLO**: Attach a new or existing Service Level Objective (SLO).
* **Duplicate**: Create a copy of the Board.
* **Delete board**: Permanently remove the Board.
## SLOs Section
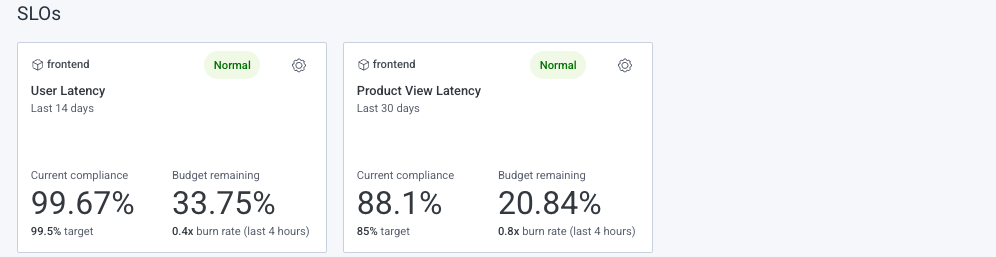
If at least one Service Level Objective (SLO) has been added to the Board, then the **SLOs** section appears.
The **SLOs** section contains panels, each of which displays compliance and performance metrics for a single SLO.
### Board Details
This section provides essential information about the Board, including:
* **Board name**: Assigned title of the Board.
* **Board description**: Brief explanation of the Board's purpose or contents.
* **Last edited by and date**: Name of the last person who modified the Board and when.
* **Tags**: Key:value pairs assigned to the Board. Valid on Flexible Boards only.
### Board Actions
Manage your Board using these options:
* **Share** (): Share the Board and manage collaborator access.
* **Manage Board settings** (): Access key actions:
* **Add query**: Attach a new or existing query.
* **Add SLO**: Attach a new or existing Service Level Objective (SLO).
* **Duplicate**: Create a copy of the Board.
* **Delete board**: Permanently remove the Board.
## SLOs Section
If at least one Service Level Objective (SLO) has been added to the Board, then the **SLOs** section appears.
The **SLOs** section contains panels, each of which displays compliance and performance metrics for a single SLO.
 ### SLO Panel
Each Service Level Objective (SLO) panel represents an individual SLO.
It displays the SLO's details and setting options.
### SLO Panel
Each Service Level Objective (SLO) panel represents an individual SLO.
It displays the SLO's details and setting options.
 #### SLO Details
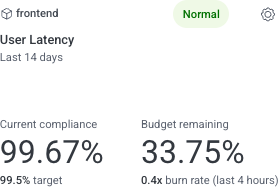
Each Service Level Objective (SLO) panel includes:
* **Applicable dataset**: Dataset associated with the SLO, including its name and an associated type icon. Icon options include:
| Icon | Description |
| ------------------------------------ | -------------------------------------------- |
| | All datasets in the environment. |
| | Single dataset that contains traces. |
| | Single dataset that does not contain traces. |
* **Status indicator**: Indicator that reflects the SLO's current state. Options include:
| Option | Description |
| ------ | --------------------------------- |
| Normal | Operating within expected limits. |
* **Name**: Title of the SLO.
* **Time period**: Timeframe over which compliance is measured.
* **Performance metrics**: Metric summaries, including:
* **Compliance summary**: Represents the overall percentage of requests that meet the defined SLO within the specified time period. Details include:
* **Current compliance percentage**: Proportion of requests meeting the defined SLO.
* **Compliance target**: Defined goal for compliance.
* **Error budget summary**: Represents the remaining allowable proportion of requests that can fail before the SLO is breached. Details include:
* **Remaining budget percentage**: Percentage of the error budget that is left.
* **Burn rate and time period**: Multiplier and time period indicating the rate at which the budget is being used.
#### SLO Settings
Use **Manage SLO** settings () to manage your Service Level Objective (SLO).
Options include:
| Option | Description |
| ---------- | ------------------------------ |
| Remove SLO | Detach the SLO from the Board. |
## Queries Section
Because every Board requires at least one query, this section is always present.
Use it to analyze data across different time ranges and customize query result displays.
#### SLO Details
Each Service Level Objective (SLO) panel includes:
* **Applicable dataset**: Dataset associated with the SLO, including its name and an associated type icon. Icon options include:
| Icon | Description |
| ------------------------------------ | -------------------------------------------- |
| | All datasets in the environment. |
| | Single dataset that contains traces. |
| | Single dataset that does not contain traces. |
* **Status indicator**: Indicator that reflects the SLO's current state. Options include:
| Option | Description |
| ------ | --------------------------------- |
| Normal | Operating within expected limits. |
* **Name**: Title of the SLO.
* **Time period**: Timeframe over which compliance is measured.
* **Performance metrics**: Metric summaries, including:
* **Compliance summary**: Represents the overall percentage of requests that meet the defined SLO within the specified time period. Details include:
* **Current compliance percentage**: Proportion of requests meeting the defined SLO.
* **Compliance target**: Defined goal for compliance.
* **Error budget summary**: Represents the remaining allowable proportion of requests that can fail before the SLO is breached. Details include:
* **Remaining budget percentage**: Percentage of the error budget that is left.
* **Burn rate and time period**: Multiplier and time period indicating the rate at which the budget is being used.
#### SLO Settings
Use **Manage SLO** settings () to manage your Service Level Objective (SLO).
Options include:
| Option | Description |
| ---------- | ------------------------------ |
| Remove SLO | Detach the SLO from the Board. |
## Queries Section
Because every Board requires at least one query, this section is always present.
Use it to analyze data across different time ranges and customize query result displays.
 ### Section Controls
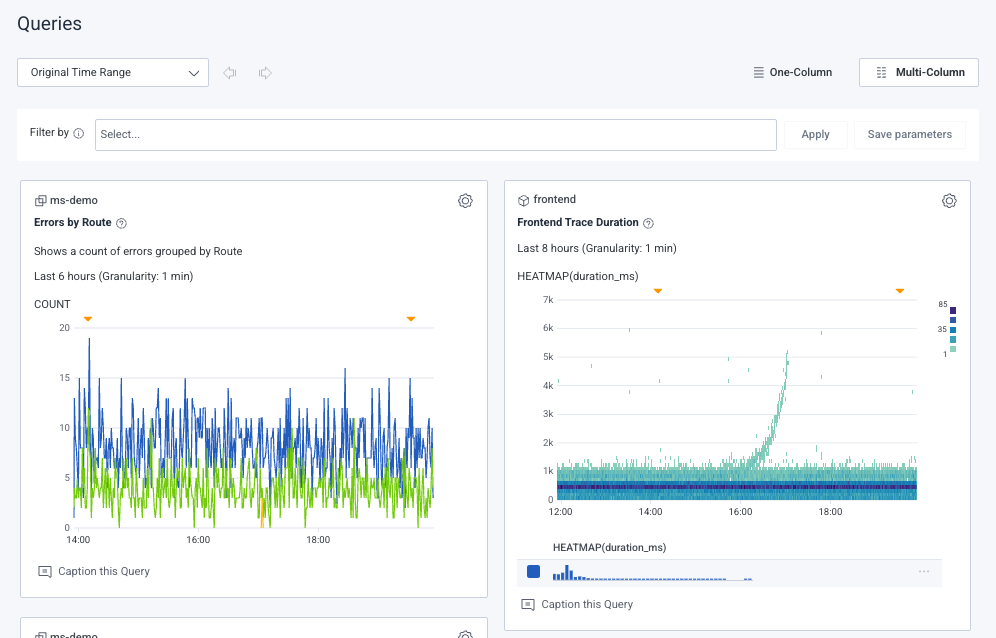
Adjust how query panels appear across the entire **Queries** section using these controls:
* **Time range & granularity**:
* **Original time range**: Use the default time setting.
* **Relative time ranges**: Dynamically adjust the timeframe based on preset dynamic time ranges (for example, `Last 10 minutes`, `Last 2 hours`, `Last 28 days`).
* **Custom time range**: Manually select a specific timeframe.
* **Granularity**: Define how detailed the data points are.
* **Time navigation**:
* **Previous time range**: Step back to an earlier time window.
* **Next time range**: Advance to a later time window.
* **Column layout**:
* **One-Column**: Stack query panels vertically in a single column.
* **Multi-Column**: Display panels side by side, adjusting to the width of your browser window.
* **Filters**:
* **Filter field**: Enter text to filter queries.
* **Apply**: Apply selected filters to query results.
* **Save Parameters**: Save filters so they persist for all users of the Board.
### Query Panel
Each query panel represents an individual query and displays its settings, details, and visualization.
### Section Controls
Adjust how query panels appear across the entire **Queries** section using these controls:
* **Time range & granularity**:
* **Original time range**: Use the default time setting.
* **Relative time ranges**: Dynamically adjust the timeframe based on preset dynamic time ranges (for example, `Last 10 minutes`, `Last 2 hours`, `Last 28 days`).
* **Custom time range**: Manually select a specific timeframe.
* **Granularity**: Define how detailed the data points are.
* **Time navigation**:
* **Previous time range**: Step back to an earlier time window.
* **Next time range**: Advance to a later time window.
* **Column layout**:
* **One-Column**: Stack query panels vertically in a single column.
* **Multi-Column**: Display panels side by side, adjusting to the width of your browser window.
* **Filters**:
* **Filter field**: Enter text to filter queries.
* **Apply**: Apply selected filters to query results.
* **Save Parameters**: Save filters so they persist for all users of the Board.
### Query Panel
Each query panel represents an individual query and displays its settings, details, and visualization.
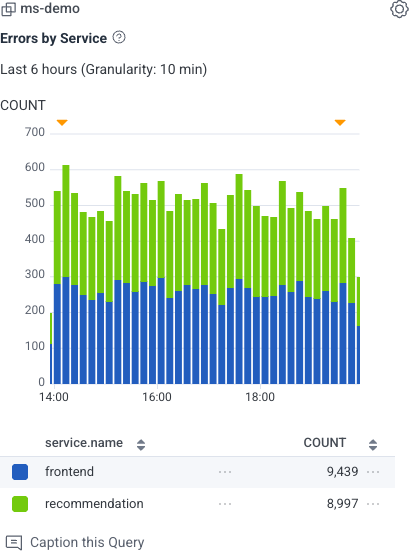 #### Query Details
Each query includes:
* **Applicable dataset**: Dataset from which the query retrieves data, including its name and an associated type icon. Icon options include:
| Icon | Description |
| ------------------------------------ | -------------------------------------------- |
| | All datasets in the environment. |
| | Single dataset that contains traces. |
| | Single dataset that does not contain traces. |
* **Name**: Title of the query.
* **Description**: Brief summary of what the query does.
* **Time range**: Time period covered by the query.
* **Granularity**: Level of data aggregation.
* **Visualization preview**:
* **Graph**: Visual representation of the data.
* **Table**: Structured, tabular view of the data. If using a heatmap visualization, the table contains a histogram.
#### Query Settings
Use **Settings** () to manage your query:
* **Display settings**: Choose the display format. Options include:
| Option | Description |
| --------------------- | ----------------------------------------------- |
| Display Graph Only | Show only the visualization. |
| Display Graph & Table | Show both the visualization and the data table. |
| Display Table Only | Show only the data table. |
#### Query Details
Each query includes:
* **Applicable dataset**: Dataset from which the query retrieves data, including its name and an associated type icon. Icon options include:
| Icon | Description |
| ------------------------------------ | -------------------------------------------- |
| | All datasets in the environment. |
| | Single dataset that contains traces. |
| | Single dataset that does not contain traces. |
* **Name**: Title of the query.
* **Description**: Brief summary of what the query does.
* **Time range**: Time period covered by the query.
* **Granularity**: Level of data aggregation.
* **Visualization preview**:
* **Graph**: Visual representation of the data.
* **Table**: Structured, tabular view of the data. If using a heatmap visualization, the table contains a histogram.
#### Query Settings
Use **Settings** () to manage your query:
* **Display settings**: Choose the display format. Options include:
| Option | Description |
| --------------------- | ----------------------------------------------- |
| Display Graph Only | Show only the visualization. |
| Display Graph & Table | Show both the visualization and the data table. |
| Display Table Only | Show only the data table. |