> ## Documentation Index
> Fetch the complete documentation index at: https://docs.honeycomb.io/llms.txt
> Use this file to discover all available pages before exploring further.
# Get Started with Anomaly Detection
> Enable monitoring for a service, adjust sensitivity, and choose who gets notified when an anomaly is detected.
export const HnyIcon = ({alias, path, size = 16, iconColor}) => {
const iconMap = {
"home": "house.svg",
"marker": "caretFilledDown.svg",
"show-marker-options": "chatTextLeft.svg",
"download": "arrowLineDown.svg",
"trace-waterfall": "trace.svg",
"show-query-details": "listDashes.svg",
"table": "table.svg",
"log-lines": "logLines.svg",
"chart": "chartLine.svg",
"show-settings": "gear.svg",
"add": "plus.svg",
"remove": "delete.svg",
"persist": "caretDown.svg",
"close": "close.svg",
"copy": "copy.svg",
"zoom-in": "magnifyingGlassPlus.svg",
"zoom-out": "magnifyingGlassMinus.svg",
"color-assignment": "drop.svg",
"drag": "dots-six-vertical.svg",
"drawer": "drawer.svg",
"show-actions": "dotsThree.svg",
"edit": "pencil.svg",
"delete": "trash.svg",
"move": "arrowsOutCardinal.svg",
"show-legend": "circleInfo.svg",
"usage-ok": "usageGood.svg",
"usage-warning": "usageWarning.svg",
"usage-danger": "usageDanger.svg",
"open-query-builder": "query.svg",
"home-menu": "house.svg",
"query-menu": "query.svg",
"boards-menu": "board.svg",
"triggers-menu": "bell.svg",
"slos-menu": "handshake.svg",
"service-map-menu": "serviceMap.svg",
"history-menu": "clockCounterClockwise.svg",
"manage-data-menu": "cube.svg",
"usage-menu": "usageGood.svg",
"canvas-menu": "sparkle.svg",
"anomalies-menu": "anomalies.svg",
"show-details": "dotsThreeVertical.svg",
"resize-handle": "board-panel-resize-handle.png",
"standard-dataset": "cube.svg",
"trace-dataset": "cubeChat.svg",
"all-datasets": "linkedSquares.svg",
"share": "arrowBentRight.svg",
"run-in-query-builder": "arrowSquareUpRight.svg",
"link": "link.svg",
"text": "text.svg",
"receive": "arrowLineDown.svg",
"process": "lightning.svg",
"sample": "drop.svg",
"send": "arrowLineUp.svg",
"submit": "arrowUp.svg",
"canvas-menu": "sparkle.svg",
"canvas": "sparkle.svg",
"chat-about-this-page": "sparkle.svg",
"private": "lockKey.svg",
"shared": "people.svg",
"expand": "caretDown.svg",
"previous": "caretLeft.svg",
"next": "caretRight.svg",
"expand-chat": "caretLeft.svg",
"minimize-chat": "caretRight.svg",
"open-in-canvas": "arrowSquareUpRight.svg",
"send-test": "EnvelopeSimple.svg"
};
const iconBasePath = "/_assets/icons/";
const iconPath = path || (alias ? `${iconBasePath}${iconMap[alias]}` : undefined);
return ;
};
Beta
Honeycomb automatically identifies eligible services for Anomaly Detection and begins monitoring them without extra setup.
You turn on the signals you want to track, adjust sensitivity, and choose who gets notified.
## Exploring your services
Check which services Honeycomb already monitors and how each one is performing.
1. Select **Anomalies** () from the navigation menu.
2. Use the search bar to find a service by name, status, or signal, or select a column header to sort the list.
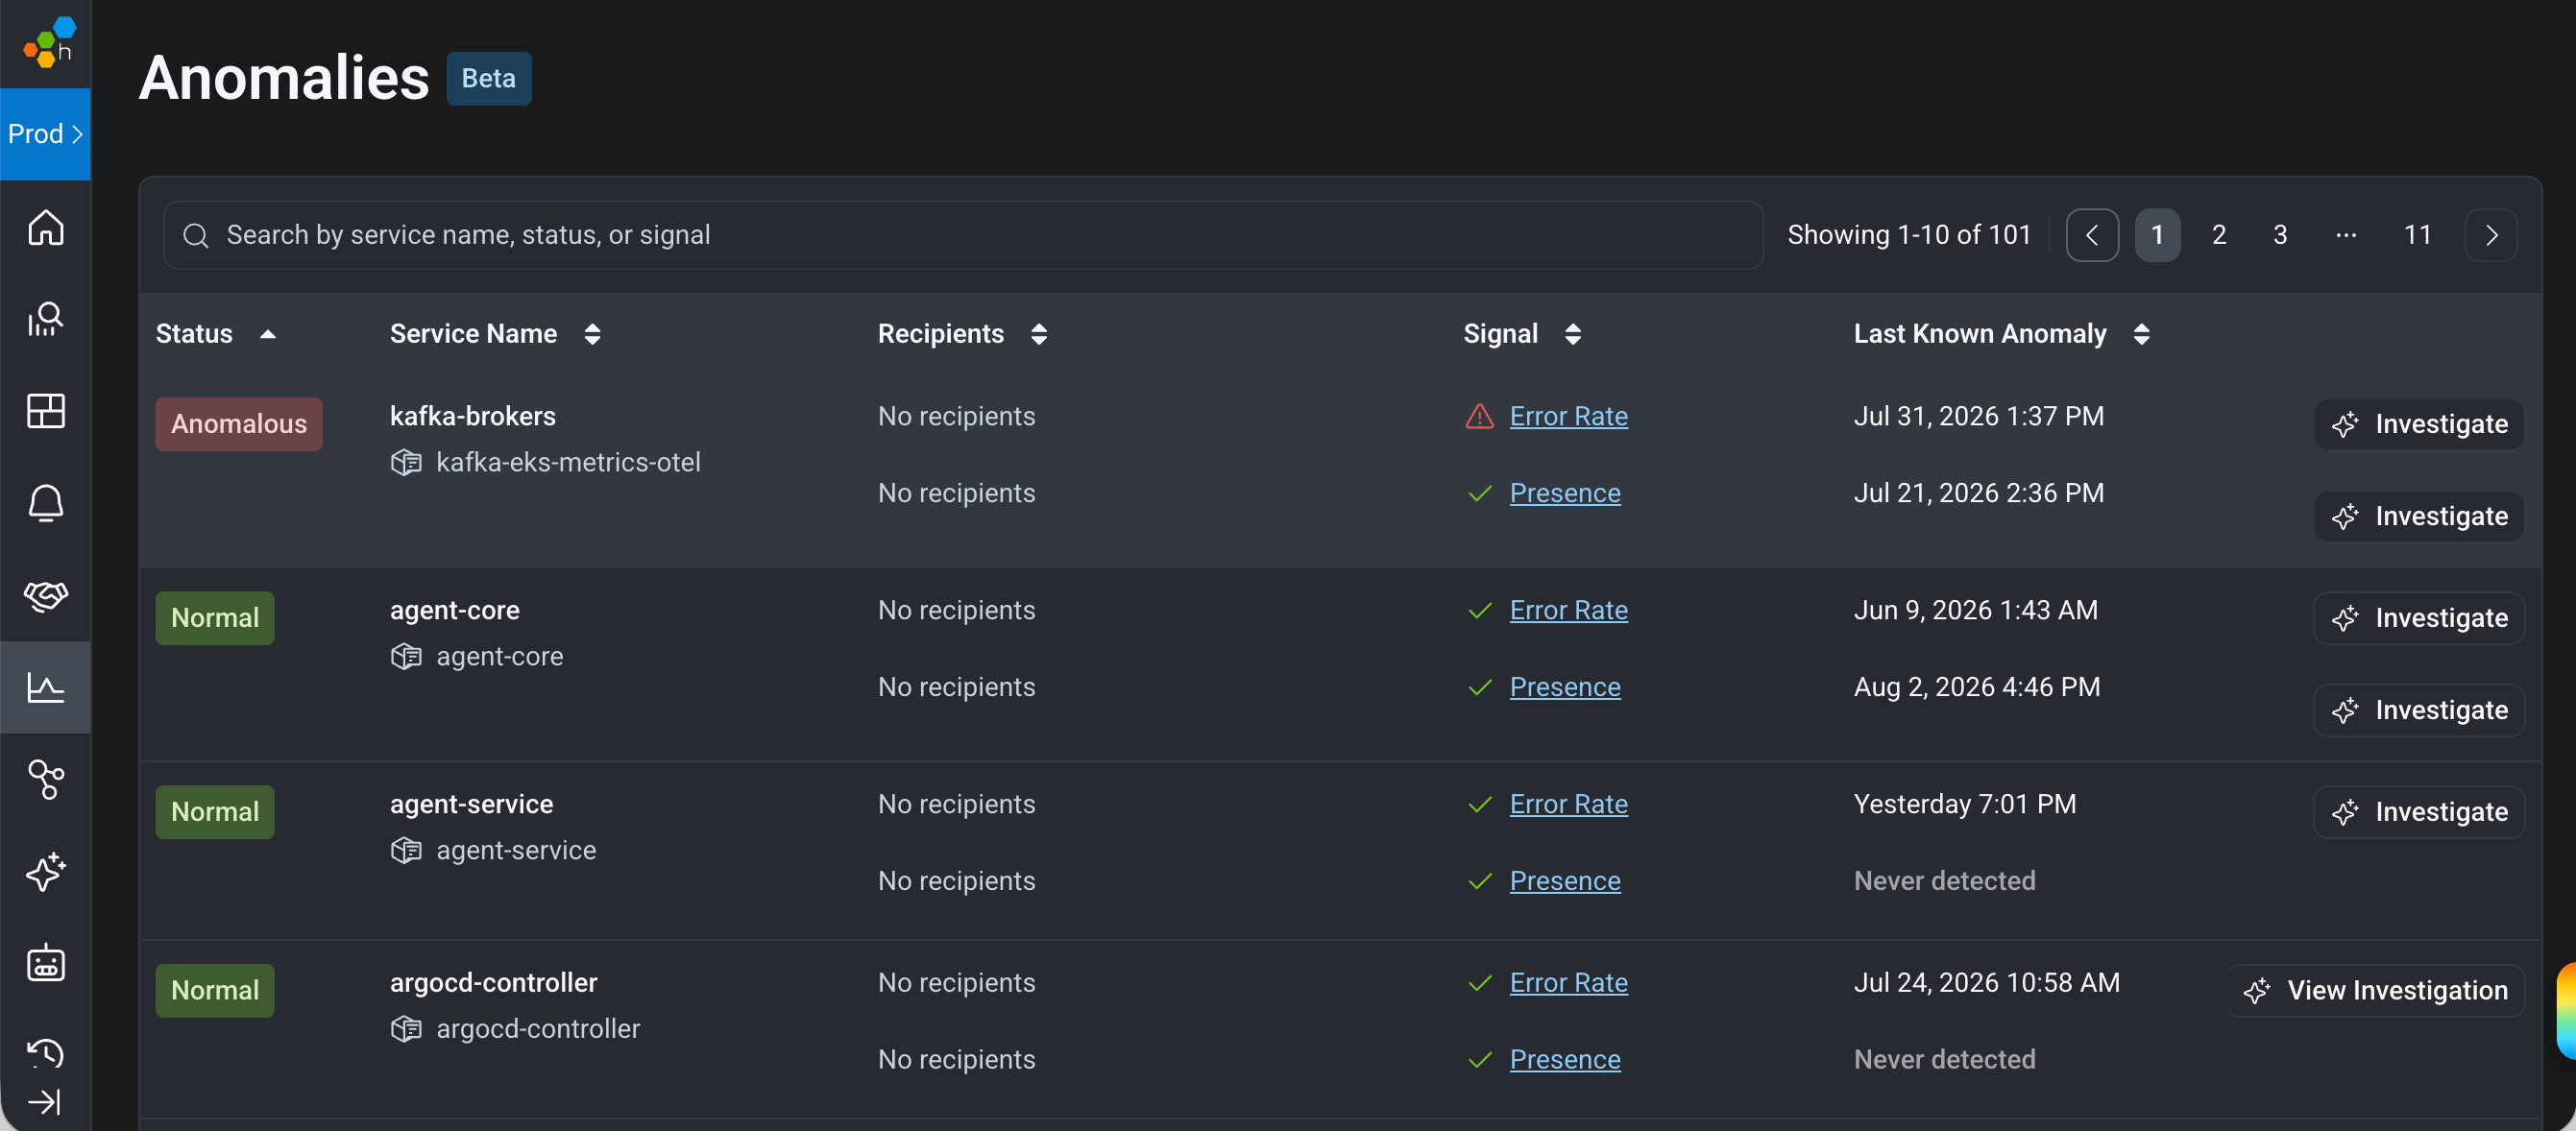 Each row shows a service's current status, configured recipients, monitored signals, and the last known anomaly for each signal.
Selecting a service opens its detail page.
## Enabling a signal
Turn on a signal to start building a baseline for a service.
1. From the Anomalies list, select a service to open its detail page.
2. Select the **Error Rate** or **Presence** view.
3. Use the **Enable** toggle to turn monitoring on.
Each row shows a service's current status, configured recipients, monitored signals, and the last known anomaly for each signal.
Selecting a service opens its detail page.
## Enabling a signal
Turn on a signal to start building a baseline for a service.
1. From the Anomalies list, select a service to open its detail page.
2. Select the **Error Rate** or **Presence** view.
3. Use the **Enable** toggle to turn monitoring on.
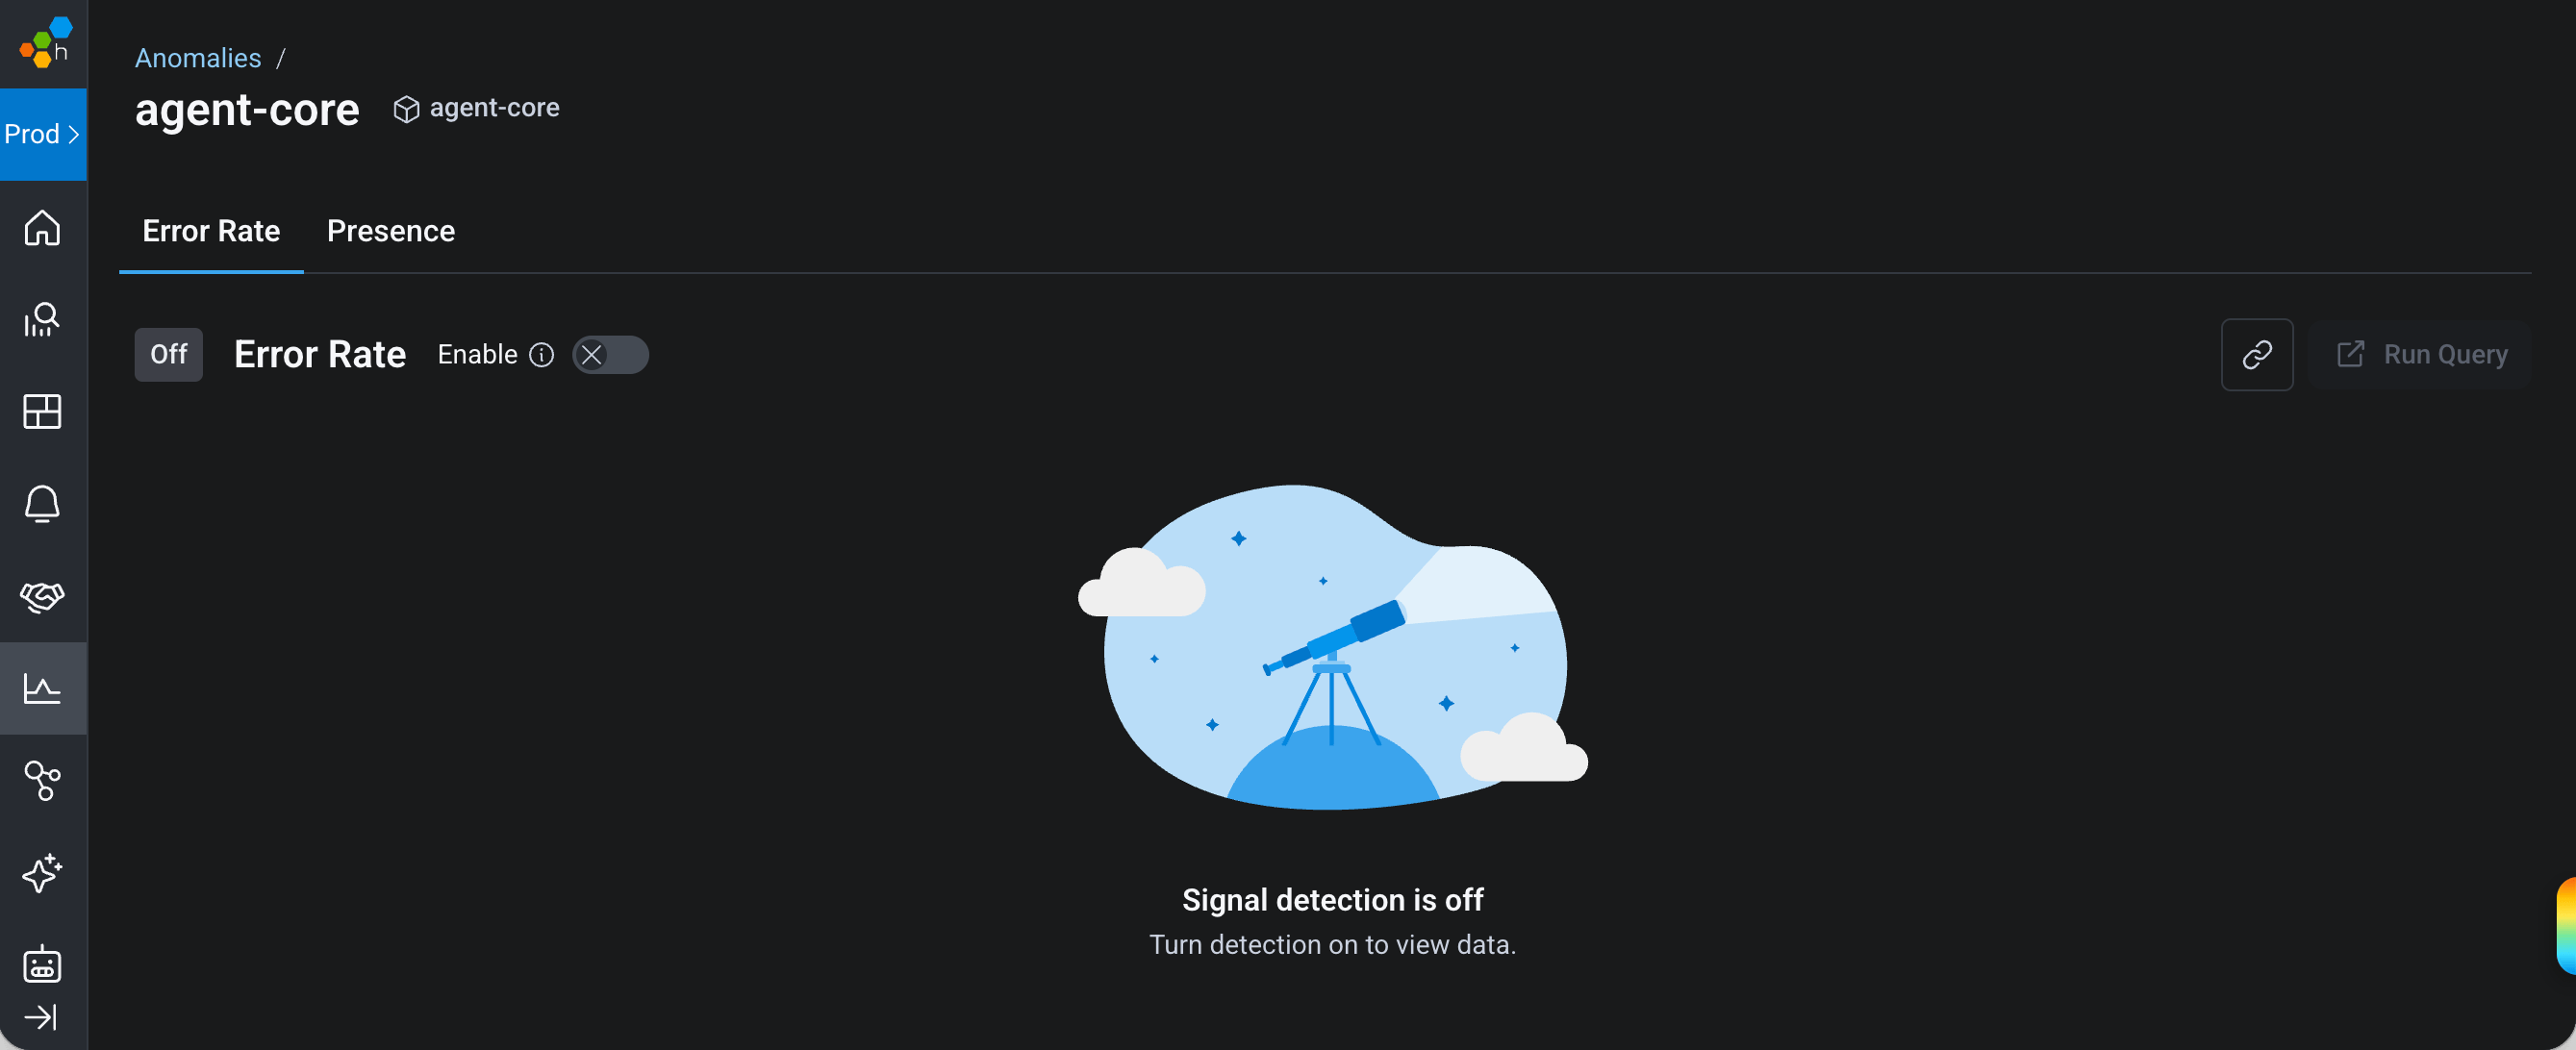 The service moves into **Training** while Honeycomb accumulates enough data to build a baseline, then into **Normal** once detection is active.
## Investigating an anomaly
When a service shows as **Anomalous**, start here to explore the data behind it.
1. From the Anomalies list, find the service.
2. Open the investigation:
* To launch a new investigation, select **Investigate**.
* If an investigation is already underway, select **View Investigation**.
3. Review the chart and any linked Canvas investigation to see what changed.
Canvas surfaces a likely cause automatically when you turn on [auto-investigate](#turning-on-automatic-canvas-investigations) for that service.
## Adjusting the sensitivity threshold
Adjust sensitivity when a signal is too noisy or too quiet for a given service.
### Error rate
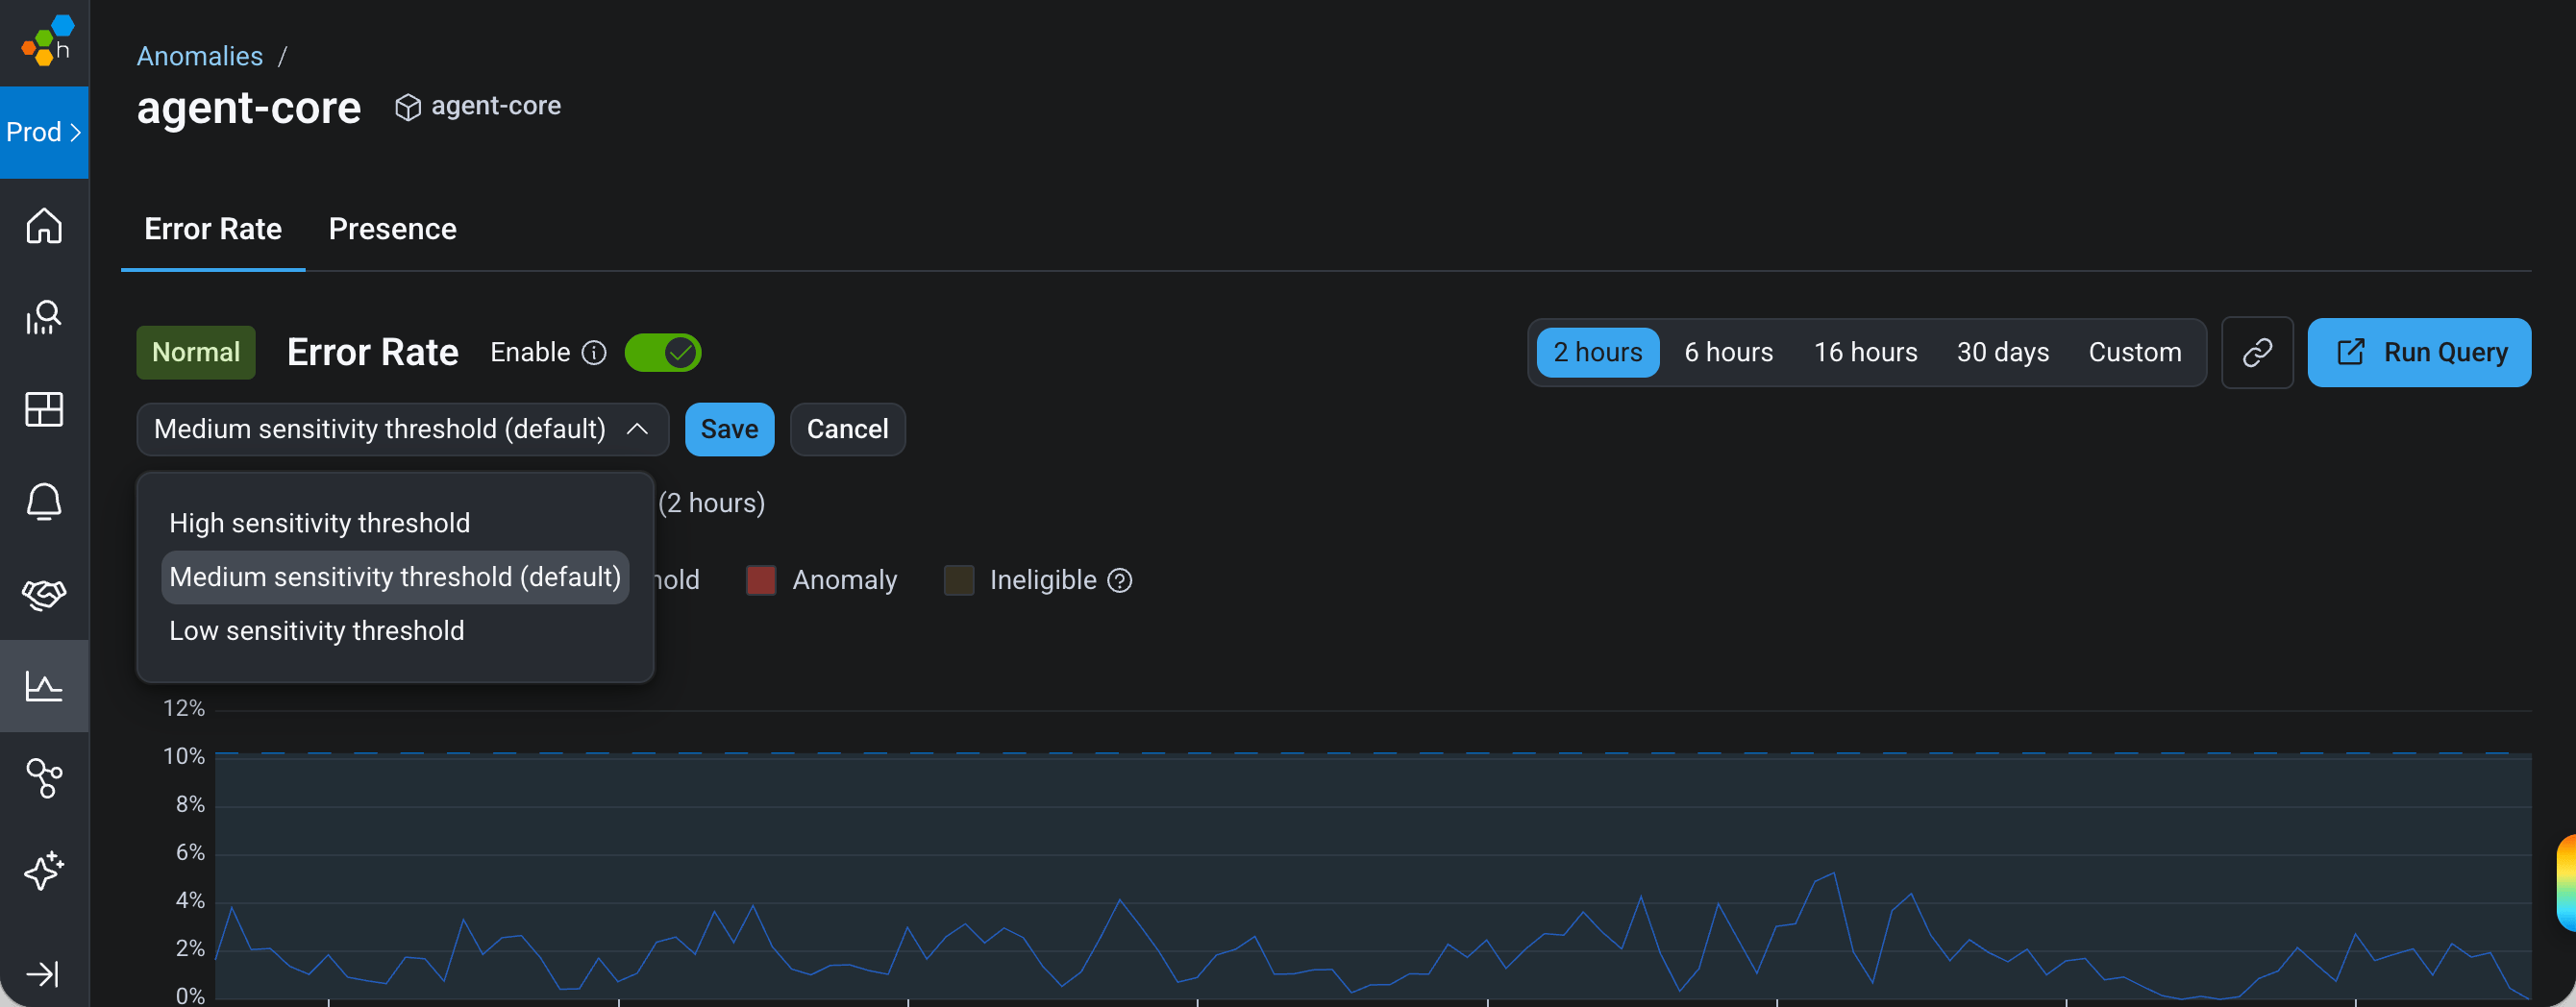
1. Select the **Error Rate** view.
2. Locate the sensitivity threshold and select **Change**.
3. Select the sensitivity dropdown, and choose a level.
4. Select **Save**.
The service moves into **Training** while Honeycomb accumulates enough data to build a baseline, then into **Normal** once detection is active.
## Investigating an anomaly
When a service shows as **Anomalous**, start here to explore the data behind it.
1. From the Anomalies list, find the service.
2. Open the investigation:
* To launch a new investigation, select **Investigate**.
* If an investigation is already underway, select **View Investigation**.
3. Review the chart and any linked Canvas investigation to see what changed.
Canvas surfaces a likely cause automatically when you turn on [auto-investigate](#turning-on-automatic-canvas-investigations) for that service.
## Adjusting the sensitivity threshold
Adjust sensitivity when a signal is too noisy or too quiet for a given service.
### Error rate
1. Select the **Error Rate** view.
2. Locate the sensitivity threshold and select **Change**.
3. Select the sensitivity dropdown, and choose a level.
4. Select **Save**.
 ### Presence
The Presence view shows a sensitivity threshold in minutes, set to 5 minutes by default.
This is the maximum gap in a service's data stream before Honeycomb flags it as an anomaly.
Higher sensitivity flags smaller deviations and produces more notifications; lower sensitivity flags only larger deviations.
## Managing recipients
Anomaly Detection surfaces anomalies in the product on its own, but reaching your team requires at least one configured recipient.
Error Rate and Presence each have their own recipient list, so a recipient added on one signal's tab doesn't automatically notify on the other.
### Adding a recipient
Add a recipient so Honeycomb notifies someone when an anomalous period starts or ends.
1. From a service's detail page, select the **Error Rate** or **Presence** view.
2. Select **Add Recipient**.
3. Choose a provider.
Before adding Slack and PagerDuty recipients, configure them in the [Integration Center](/notify/).
4. Enter the recipient, such as an email address or Slack channel.
For PagerDuty, also set the severity.
To send a test notification, select the Send icon () next to the recipient.
Use the **Mute** toggle to delay notifications for a configured recipient until you are ready to send them.
5. Select **Save**.
Use the **Mute** toggle to configure a recipient and delay their notifications until you are ready to send them.
Honeycomb always shows the anomaly in the Anomalies list and on the service's detail page; external notifications go out only when you configure a recipient.
### Editing a recipient
1. From the recipient list, select the Edit icon () next to the recipient.
2. Update the fields and select **Save**.
### Removing a recipient
1. From the recipient list, select the Remove icon () next to the recipient.
2. Select **Remove** to confirm.
## Turning on automatic Canvas investigations
Turn on auto-investigation to let Canvas start investigating as soon as Honeycomb detects an anomaly, before your team opens the product.
To learn how to set up auto-investigation, visit [Auto-investigate Anomalies](/investigate/canvas/auto-investigate#anomaly-detections).
## Pausing monitoring for a service
Pause a signal to stop notifications temporarily while keeping your configuration intact.
Use the **Enable** toggle on a signal's tab to turn monitoring off.
Honeycomb preserves your on/off intent and resumes monitoring only on signals you left enabled, even if the service later becomes ineligible and then eligible again.
## Best practices
Once you've enabled a service, use these recommendations to tune Anomaly Detection for real-world traffic.
* **Start with the signals you have.** Error rate and presence deliver value on their own, even before request rate and latency ship.
* **Lower sensitivity before turning a signal off.** If a service is noisy, set it to Low sensitivity instead of disabling monitoring entirely.
* **Treat an ineligible service as useful information.** A service that can't produce reliable detections yet is telling you something about its data coverage, which is often worth investigating on its own.
* **Add a recipient before you need one.** Make sure Honeycomb can notify someone as soon as an anomaly occurs.
* **Pair Anomaly Detection with Canvas where you already use Slack.** Auto-investigate works best where a Slack channel is already configured as a recipient, since Canvas can join the thread directly.
## Troubleshooting
If you experience difficulties when working with Anomaly Detection, explore these solutions to common issues.
### Monitoring status
#### A service shows as Ineligible
Honeycomb bases eligibility on a rolling data coverage window.
A service that recently changed traffic patterns, or that sends data intermittently, can drop below the coverage Honeycomb needs for a reliable baseline.
Monitoring resumes automatically once the service's data coverage recovers; you don't need to re-enable it.
To check why a service is ineligible:
1. Select **Anomalies** () from the navigation menu.
2. Select the service.
3. Review the coverage stat next to the service's status, which shows its current data coverage against the threshold Honeycomb requires.
#### A service stays in Training longer than expected
Training reflects how much historical data Honeycomb has accumulated for the service so far.
A service with sparse or irregular data takes longer to build a reliable baseline than one with continuous traffic.
To check a service's training progress:
1. Select **Anomalies** () from the navigation menu.
2. Select the service.
3. Select the **Error Rate** or **Presence** view to explore its current state and how much data Honeycomb has collected so far.
#### Anomaly Detection flags a normal, expected traffic pattern
The baseline assumes relatively stable traffic.
A service with a strong daily or weekly cycle, such as a predictable weekday spike or weekend drop, can trigger false positives, since the current algorithm doesn't yet model seasonality.
To reduce false positives until seasonality support ships, lower the service's sensitivity threshold:
1. Select **Anomalies** () from the navigation menu.
2. Select the service.
3. Select the **Error Rate** view.
4. Select the sensitivity dropdown and choose **Low**.
5. Select **Save**.
### Notifications
#### I am not getting notified about an anomaly
On the service's detail page, check that:
* The signal is enabled
* At least one recipient is configured
* The recipient isn't muted
Honeycomb still shows the anomaly in the Anomalies list and on the service's detail page even when no recipient is configured.
#### A signal didn't resume monitoring after a service became eligible again
Honeycomb preserves your on/off intent for each signal.
If you turned a signal off before the service became ineligible, Honeycomb keeps it off rather than resuming it automatically.
To resume monitoring:
1. Select **Anomalies** () from the navigation menu.
2. Select the service.
3. Locate the **Enable** toggle and turn monitoring back on.
### Presence
The Presence view shows a sensitivity threshold in minutes, set to 5 minutes by default.
This is the maximum gap in a service's data stream before Honeycomb flags it as an anomaly.
Higher sensitivity flags smaller deviations and produces more notifications; lower sensitivity flags only larger deviations.
## Managing recipients
Anomaly Detection surfaces anomalies in the product on its own, but reaching your team requires at least one configured recipient.
Error Rate and Presence each have their own recipient list, so a recipient added on one signal's tab doesn't automatically notify on the other.
### Adding a recipient
Add a recipient so Honeycomb notifies someone when an anomalous period starts or ends.
1. From a service's detail page, select the **Error Rate** or **Presence** view.
2. Select **Add Recipient**.
3. Choose a provider.
Before adding Slack and PagerDuty recipients, configure them in the [Integration Center](/notify/).
4. Enter the recipient, such as an email address or Slack channel.
For PagerDuty, also set the severity.
To send a test notification, select the Send icon () next to the recipient.
Use the **Mute** toggle to delay notifications for a configured recipient until you are ready to send them.
5. Select **Save**.
Use the **Mute** toggle to configure a recipient and delay their notifications until you are ready to send them.
Honeycomb always shows the anomaly in the Anomalies list and on the service's detail page; external notifications go out only when you configure a recipient.
### Editing a recipient
1. From the recipient list, select the Edit icon () next to the recipient.
2. Update the fields and select **Save**.
### Removing a recipient
1. From the recipient list, select the Remove icon () next to the recipient.
2. Select **Remove** to confirm.
## Turning on automatic Canvas investigations
Turn on auto-investigation to let Canvas start investigating as soon as Honeycomb detects an anomaly, before your team opens the product.
To learn how to set up auto-investigation, visit [Auto-investigate Anomalies](/investigate/canvas/auto-investigate#anomaly-detections).
## Pausing monitoring for a service
Pause a signal to stop notifications temporarily while keeping your configuration intact.
Use the **Enable** toggle on a signal's tab to turn monitoring off.
Honeycomb preserves your on/off intent and resumes monitoring only on signals you left enabled, even if the service later becomes ineligible and then eligible again.
## Best practices
Once you've enabled a service, use these recommendations to tune Anomaly Detection for real-world traffic.
* **Start with the signals you have.** Error rate and presence deliver value on their own, even before request rate and latency ship.
* **Lower sensitivity before turning a signal off.** If a service is noisy, set it to Low sensitivity instead of disabling monitoring entirely.
* **Treat an ineligible service as useful information.** A service that can't produce reliable detections yet is telling you something about its data coverage, which is often worth investigating on its own.
* **Add a recipient before you need one.** Make sure Honeycomb can notify someone as soon as an anomaly occurs.
* **Pair Anomaly Detection with Canvas where you already use Slack.** Auto-investigate works best where a Slack channel is already configured as a recipient, since Canvas can join the thread directly.
## Troubleshooting
If you experience difficulties when working with Anomaly Detection, explore these solutions to common issues.
### Monitoring status
#### A service shows as Ineligible
Honeycomb bases eligibility on a rolling data coverage window.
A service that recently changed traffic patterns, or that sends data intermittently, can drop below the coverage Honeycomb needs for a reliable baseline.
Monitoring resumes automatically once the service's data coverage recovers; you don't need to re-enable it.
To check why a service is ineligible:
1. Select **Anomalies** () from the navigation menu.
2. Select the service.
3. Review the coverage stat next to the service's status, which shows its current data coverage against the threshold Honeycomb requires.
#### A service stays in Training longer than expected
Training reflects how much historical data Honeycomb has accumulated for the service so far.
A service with sparse or irregular data takes longer to build a reliable baseline than one with continuous traffic.
To check a service's training progress:
1. Select **Anomalies** () from the navigation menu.
2. Select the service.
3. Select the **Error Rate** or **Presence** view to explore its current state and how much data Honeycomb has collected so far.
#### Anomaly Detection flags a normal, expected traffic pattern
The baseline assumes relatively stable traffic.
A service with a strong daily or weekly cycle, such as a predictable weekday spike or weekend drop, can trigger false positives, since the current algorithm doesn't yet model seasonality.
To reduce false positives until seasonality support ships, lower the service's sensitivity threshold:
1. Select **Anomalies** () from the navigation menu.
2. Select the service.
3. Select the **Error Rate** view.
4. Select the sensitivity dropdown and choose **Low**.
5. Select **Save**.
### Notifications
#### I am not getting notified about an anomaly
On the service's detail page, check that:
* The signal is enabled
* At least one recipient is configured
* The recipient isn't muted
Honeycomb still shows the anomaly in the Anomalies list and on the service's detail page even when no recipient is configured.
#### A signal didn't resume monitoring after a service became eligible again
Honeycomb preserves your on/off intent for each signal.
If you turned a signal off before the service became ineligible, Honeycomb keeps it off rather than resuming it automatically.
To resume monitoring:
1. Select **Anomalies** () from the navigation menu.
2. Select the service.
3. Locate the **Enable** toggle and turn monitoring back on.