

This feature is available in the Honeycomb Enterprise and Pro plans.
Key Concepts
Key concepts help you understand the building blocks of Service Level Objectives (SLOs). These terms define how SLOs are structured and how they interact with one another.- Service Level Indicator (SLI): A per-event measurement that defines whether your system succeeded or failed.
- Service Level Objective (SLO): The target proportion, expressed as a percentage or ratio, of successful SLIs over a rolling time window. Example: “99.9% for any given 30 days”.
- Error Budget: The allowable amount of failure within the SLO window, measured by events or by time. Example: At 99.9% compliance with 1 million events in 30 days, you can tolerate 1,000 failed events. Viewed as downtime, with uniform traffic and no brownouts or partial failures, 99% availability allows ~7 hours of downtime in 30 days, while 99.9% allows ~44 minutes.
- Budget Burndown: The remaining portion of the error budget within the current time window. Example: If 550 failed events occurred in 30 days at 99.9%, then you have 45% of the budget left.
-
Burn Rate: How quickly you are consuming the error budget compared to the target.
Burn rate helps you understand the severity of issues in your SLO.
A burn rate of
1.0consumes the budget evenly and depletes the error budget exactly within the SLO window. A burn rate of2.0depletes it twice as fast. - Burn Alert: An alert triggered when the error budget is consumed unusually quickly.
How SLOs Work
SLOs let you define measurable reliability goals for your services and track them automatically in Honeycomb. Each SLO uses a Service Level Indicator (SLI) to measure success at the event level, and calculates:- Error Budget: How many failures your service can tolerate within the SLO window.
- Budget Burndown: How much of the error budget remains at any point in time.
- Burn Rate: How quickly the error budget is being consumed.
Burn Alerts
Burn alerts notify you when your error budget is depleting faster than expected, helping you prioritize incidents and prevent SLO violations.Multiple Services
You can apply a single SLO across multiple services, aggregating events from selected services to get a holistic view of system reliability. Multi-service SLOs work with environment-level Calculated Fields for consistent measurement.Notifications
When a burn alert fires, it alerts you via the configured method(s). Supported methods include:Tags
Tags help you stay organized as your Team creates more SLOs. Use them to group related SLOs by team, project, service, or any other category that fits your workflow. Tags make it easy to filter and find the SLOs you need, especially in shared or busy environments. Because tags are flexible and customizable, you can organize SLOs in the way that works best for you.Why Implement SLOs?
SLOs do more that set reliability targets. They provide shared context for decision-making across teams:- On-call engineers can prioritize incidents effectively.
- Management can measure and report on service quality with precision.
- Product and engineering teams can balance new feature work against infrastructure needs.
Designing Effective SLOs
Designing effective SLOs means choosing objectives that reflect what matters most to your users. This involves aligning reliability goals with business priorities, selecting clear SLIs, and setting thresholds that balance risk and user experience.What to Track
When deciding what to measure:- Measure close to the user: Track signals at the system’s edge, then use BubbleUp to pinpoint issues.
- Design around user workflows: Prioritize user outcomes over team or service boundaries. Expect some triage challenge if ownership is spread across teams or instrumentation is incomplete, and be prepared to revisit and adjust as needed.
- Alert only on actionable issues: Exclude known/expected failures (for example, invalid credentials or user disconnects) to avoid noise. Missing rare cases in SLOs is more efficient than depleting budgets with constant, non-actionable alerts. Use normalcy Triggers to detect unusual patterns like sudden traffic drops to critical endpoints.
- Normalize load-dependent metrics: Identify load-dependent measures that remain consistent with increased output. Example: For upload endpoints that may receive large files, SLOs will be more reliable if their success is independent of payload size. Use transfer speed instead of response time to ensure fair measurement.
- Favor broad, meaningful SLOs: A single comprehensive objective often provides more insight and ease of use than many fragmented ones or filtering various unrelated spans within a single calculated field. Example: Aim for 500 ms response times for “normal” interactive endpoints but allow a few more seconds on authentication endpoints that intentionally slow down when hashing passwords. This way, the load can still impact your infrastructure and having both types of signal within the same service level indicator (SLI) can uncover weirder interactions.
-
Filter selectively: Exclude specific customers or known problematic traffic (for example, pen-testing) when it does not reflect true service health.
Use filtering when:
- You are aware of the problem, and the customer is informed.
- No immediate fix or SLO refinement is available.
- You still want to be made aware of issues affecting the rest of the data.
Structuring SLOs
Keep these guidelines in mind:- Iterate: Start with an initial signal, reduce noise, and refine over time.
- Include new code paths: Add them to existing SLOs when traffic volume is significant. Use separate SLOs only for low-volume but critical paths.
- Separate concerns: Create distinct SLOs for performance vs. availability when needed.
- Set and tune targets: Test by injecting failures and faults to ensure alerts trigger appropriately. Adjust sensitivity iteratively based on team feedback.
- Organize around user features: Focus on user-facing outcomes, not code structure. For additional insights, visit our blog post: Data Availability Isn’t Observability.
- Document details: Capture exceptions and SLI intricacies within the SLO description, which allows for more extended comments than the SLI page.
Multi-Service SLOs
Shared SLOs across datasets and services require the Environments and Services data model.
To use this feature, migrate from Honeycomb Classic if needed.
How Multi-Service SLOs Work
Multi-service SLOs let you define reliability targets that cover multiple services, capturing the combined user experience across related systems. This ensures that issues in any critical part of a workflow are reflected in the overall objective. Key characteristics include:- Share a single error budget across up to 10 services.
- Only events from included services are evaluated.
- Traffic from all included services is weighted equally.
- SLIs are defined as environment-level calculated fields.
Use Cases
While most SLOs are best defined on a single edge service (the service that is closest to your end user), multi-service SLOs are useful for:| Use Case | Description |
|---|---|
| Multiple edge services | Users connect from many locations rather than from one centralized place (for example, service meshes or API Gateways). |
| Migrating from a monolith to microservices | During gradual migration, create SLOs that cover both legacy and new components. |
| Hot paths for critical flows | Define SLOs across services that form essential user workflows. |
Evaluating Your Use Case
Follow these guidelines to determine whether a multi-service SLO is appropriate for your scenario.Can success/failure be defined from a single event?
Honeycomb classifies individual events as successful or failed. SLOs that require relationships across multiple events are not supported.-
Supported scenario: SLO includes
frontendandcartservices. SLI defines success as events withduration_ms < 50 ms.Because events can be categorized as successful or failed, Honeycomb supports this use case.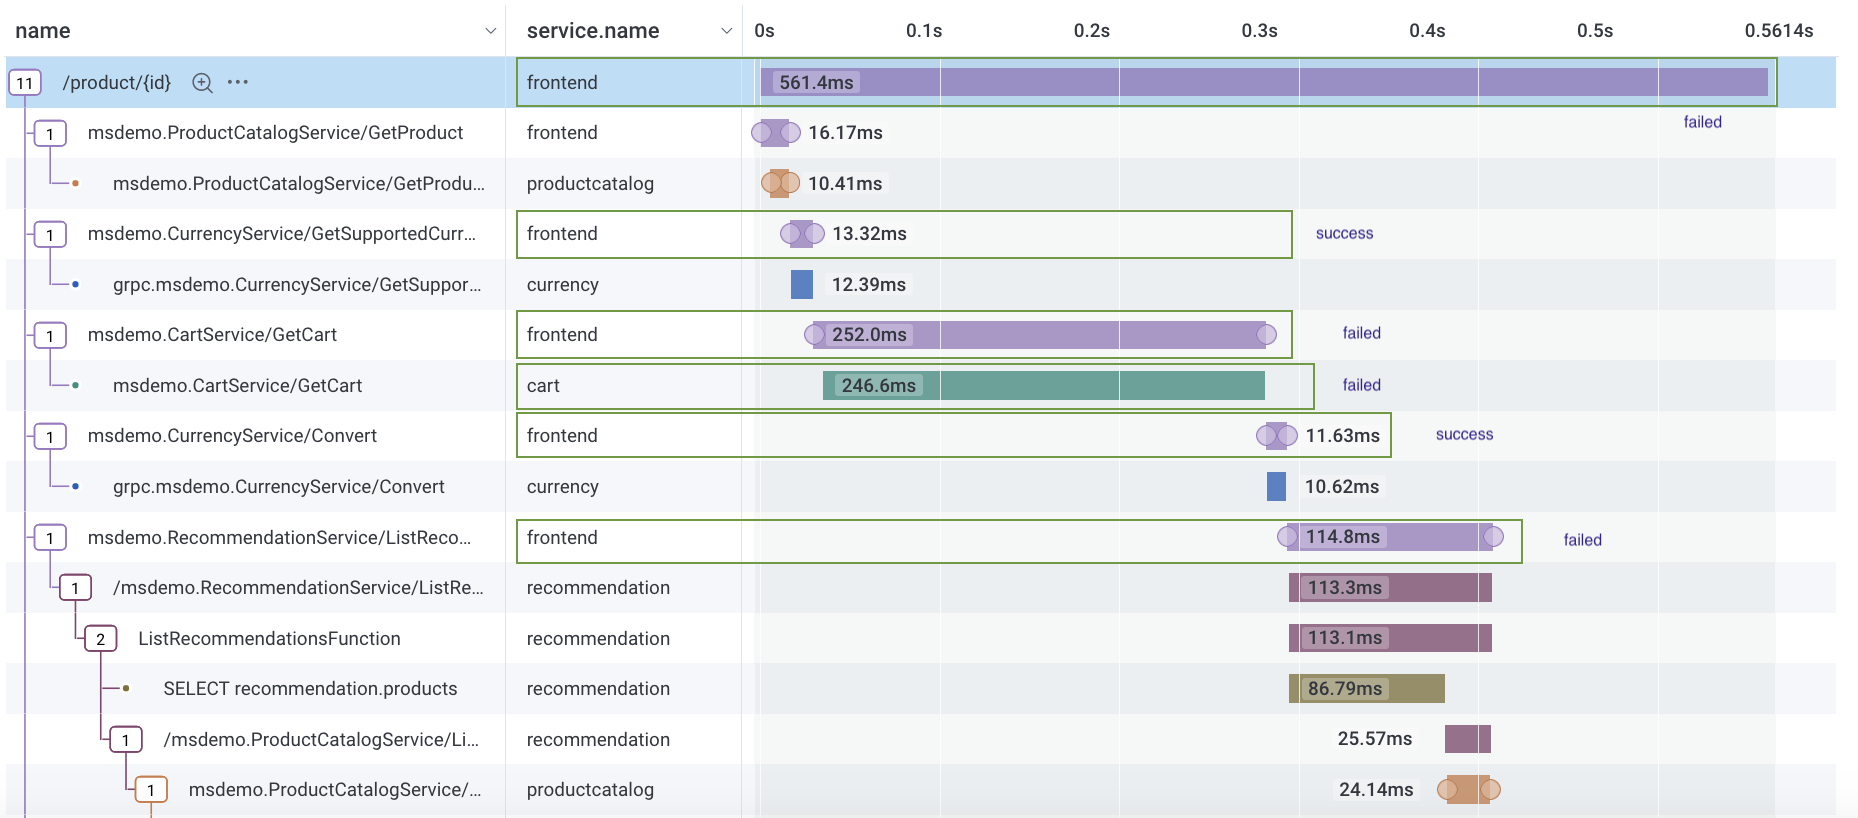
-
Unsupported scenario: SLO includes
frontendandcartservices, but success depends on acartevent being a child of afrontendevent: events withduration_ms < 50 msoncartevents that are a child span offrontend.This scenario requires combining two events to determine success or failure, so Honeycomb does not support this use case.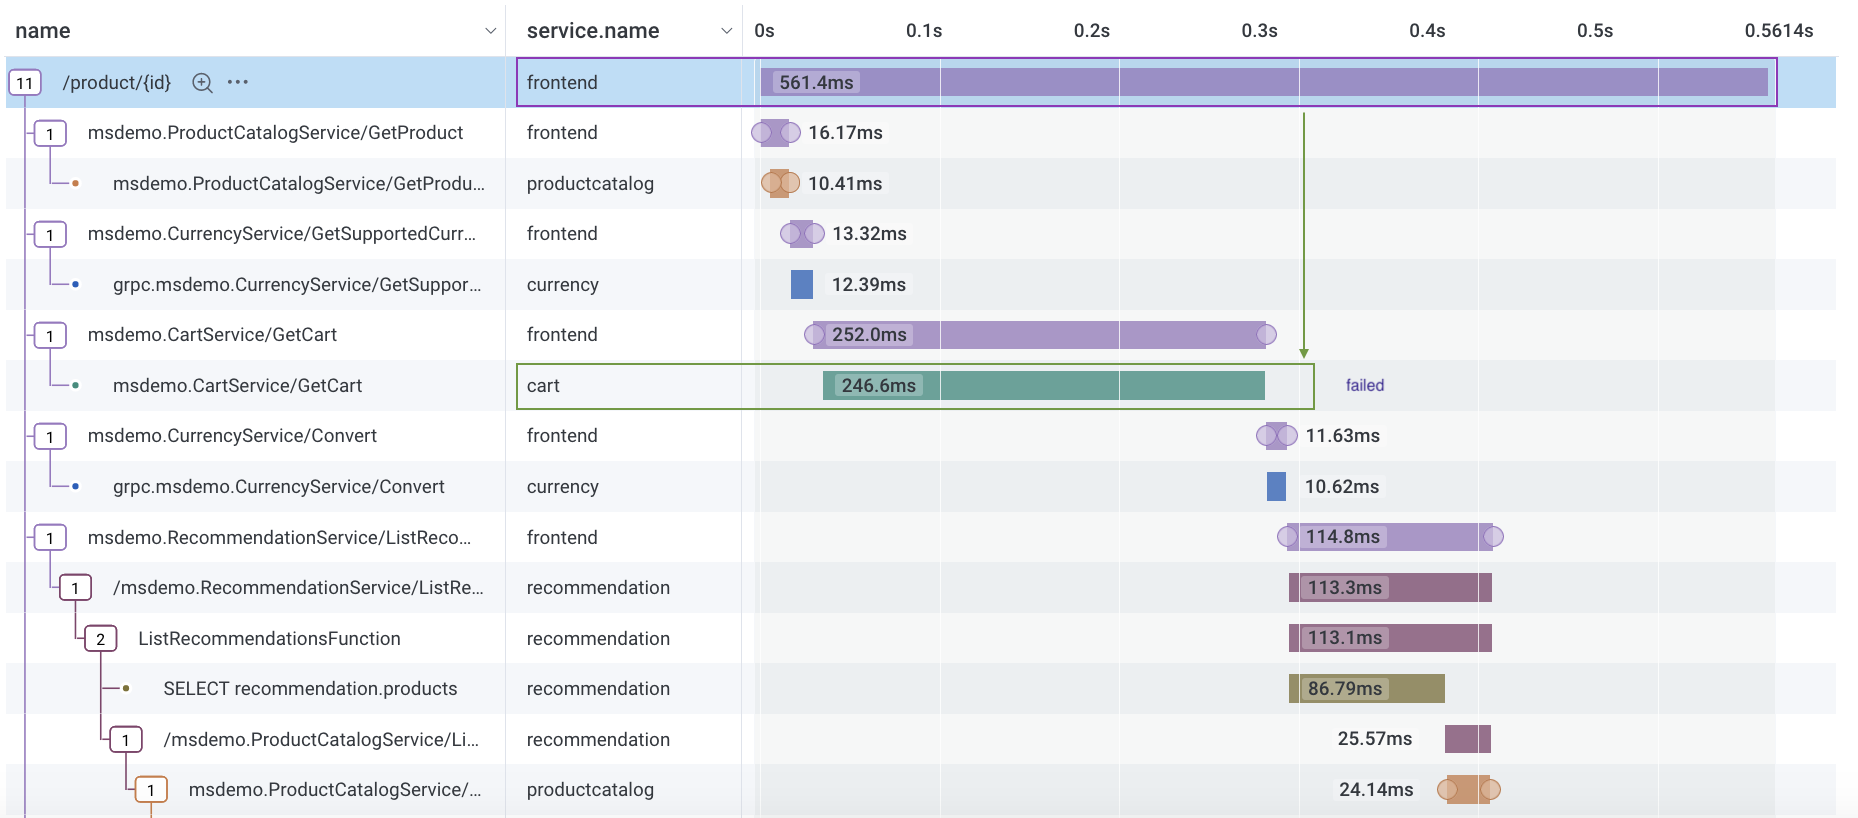
Do you want an SLO across all services in your environment?
Honeycomb does not support a single SLO that covers all services in an environment. Instead, we recommend grouping related SLOs by team, product area, or critical path.Calculating Multi-Service SLOs
When applied to multiple services:- Events from excluded services are ignored.
- SLIs apply equally to all included services.
- Events are not weighted by traffic.
Identify Outliers with Multi-Service SLOs
You can use BubbleUp with multi-service SLOs in the same way as with single-service SLOs, with a few important differences:- Clicking through the SLO Heatmap to the Query Builder loads an Environment query with a WHERE clause that filters by service names included in your multi-service SLO.
- The service name field used in the Environment query comes from the Service Name field defined in your dataset definitions.
- The SLO Heatmap and Query Builder heatmap may not match exactly, depending on how the service name is defined:
- For the heatmaps to align, the service name must match the dataset name.
- If your dataset definitions include multiple fields for service name (for example,
service.nameandservice_name), Honeycomb will run an environment-wide query without filtering by service name.
Limitations
- You cannot create a single SLO that applies to all services in your environment.
- Multi-service SLOs do not support team activity logs.