> ## Documentation Index
> Fetch the complete documentation index at: https://docs.honeycomb.io/llms.txt
> Use this file to discover all available pages before exploring further.
# Investigate Log Data in Honeycomb
> Analyze log data in Honeycomb to monitor system health, query structured and unstructured logs with high cardinality, and troubleshoot problems faster.
export const CalloutExample = ({children}) => {
return
{children}
;
};
Once your log data is in Honeycomb, you can use it to analyze and explore your systems in novel ways.
## Before You Begin
Before beginning this guide, you should have:
* [sent your log data to Honeycomb](/send-data/logs/)
* [enhanced your log data, so you can get the most out of Honeycomb](/send-data/standardize/add-context/)
## Explore Your Data
In Honeycomb, you can slice and dice your data from your [Home view](#slice-and-dice-your-data), or create [Boards](#create-a-board) to save relevant queries and visualizations.
Either way, you will want to leverage Honeycomb's features to create [Triggers](#create-triggers) and [explore outliers](#investigate-unusual-behavior) using BubbleUp and Correlations.
### Slice and Dice Your Data
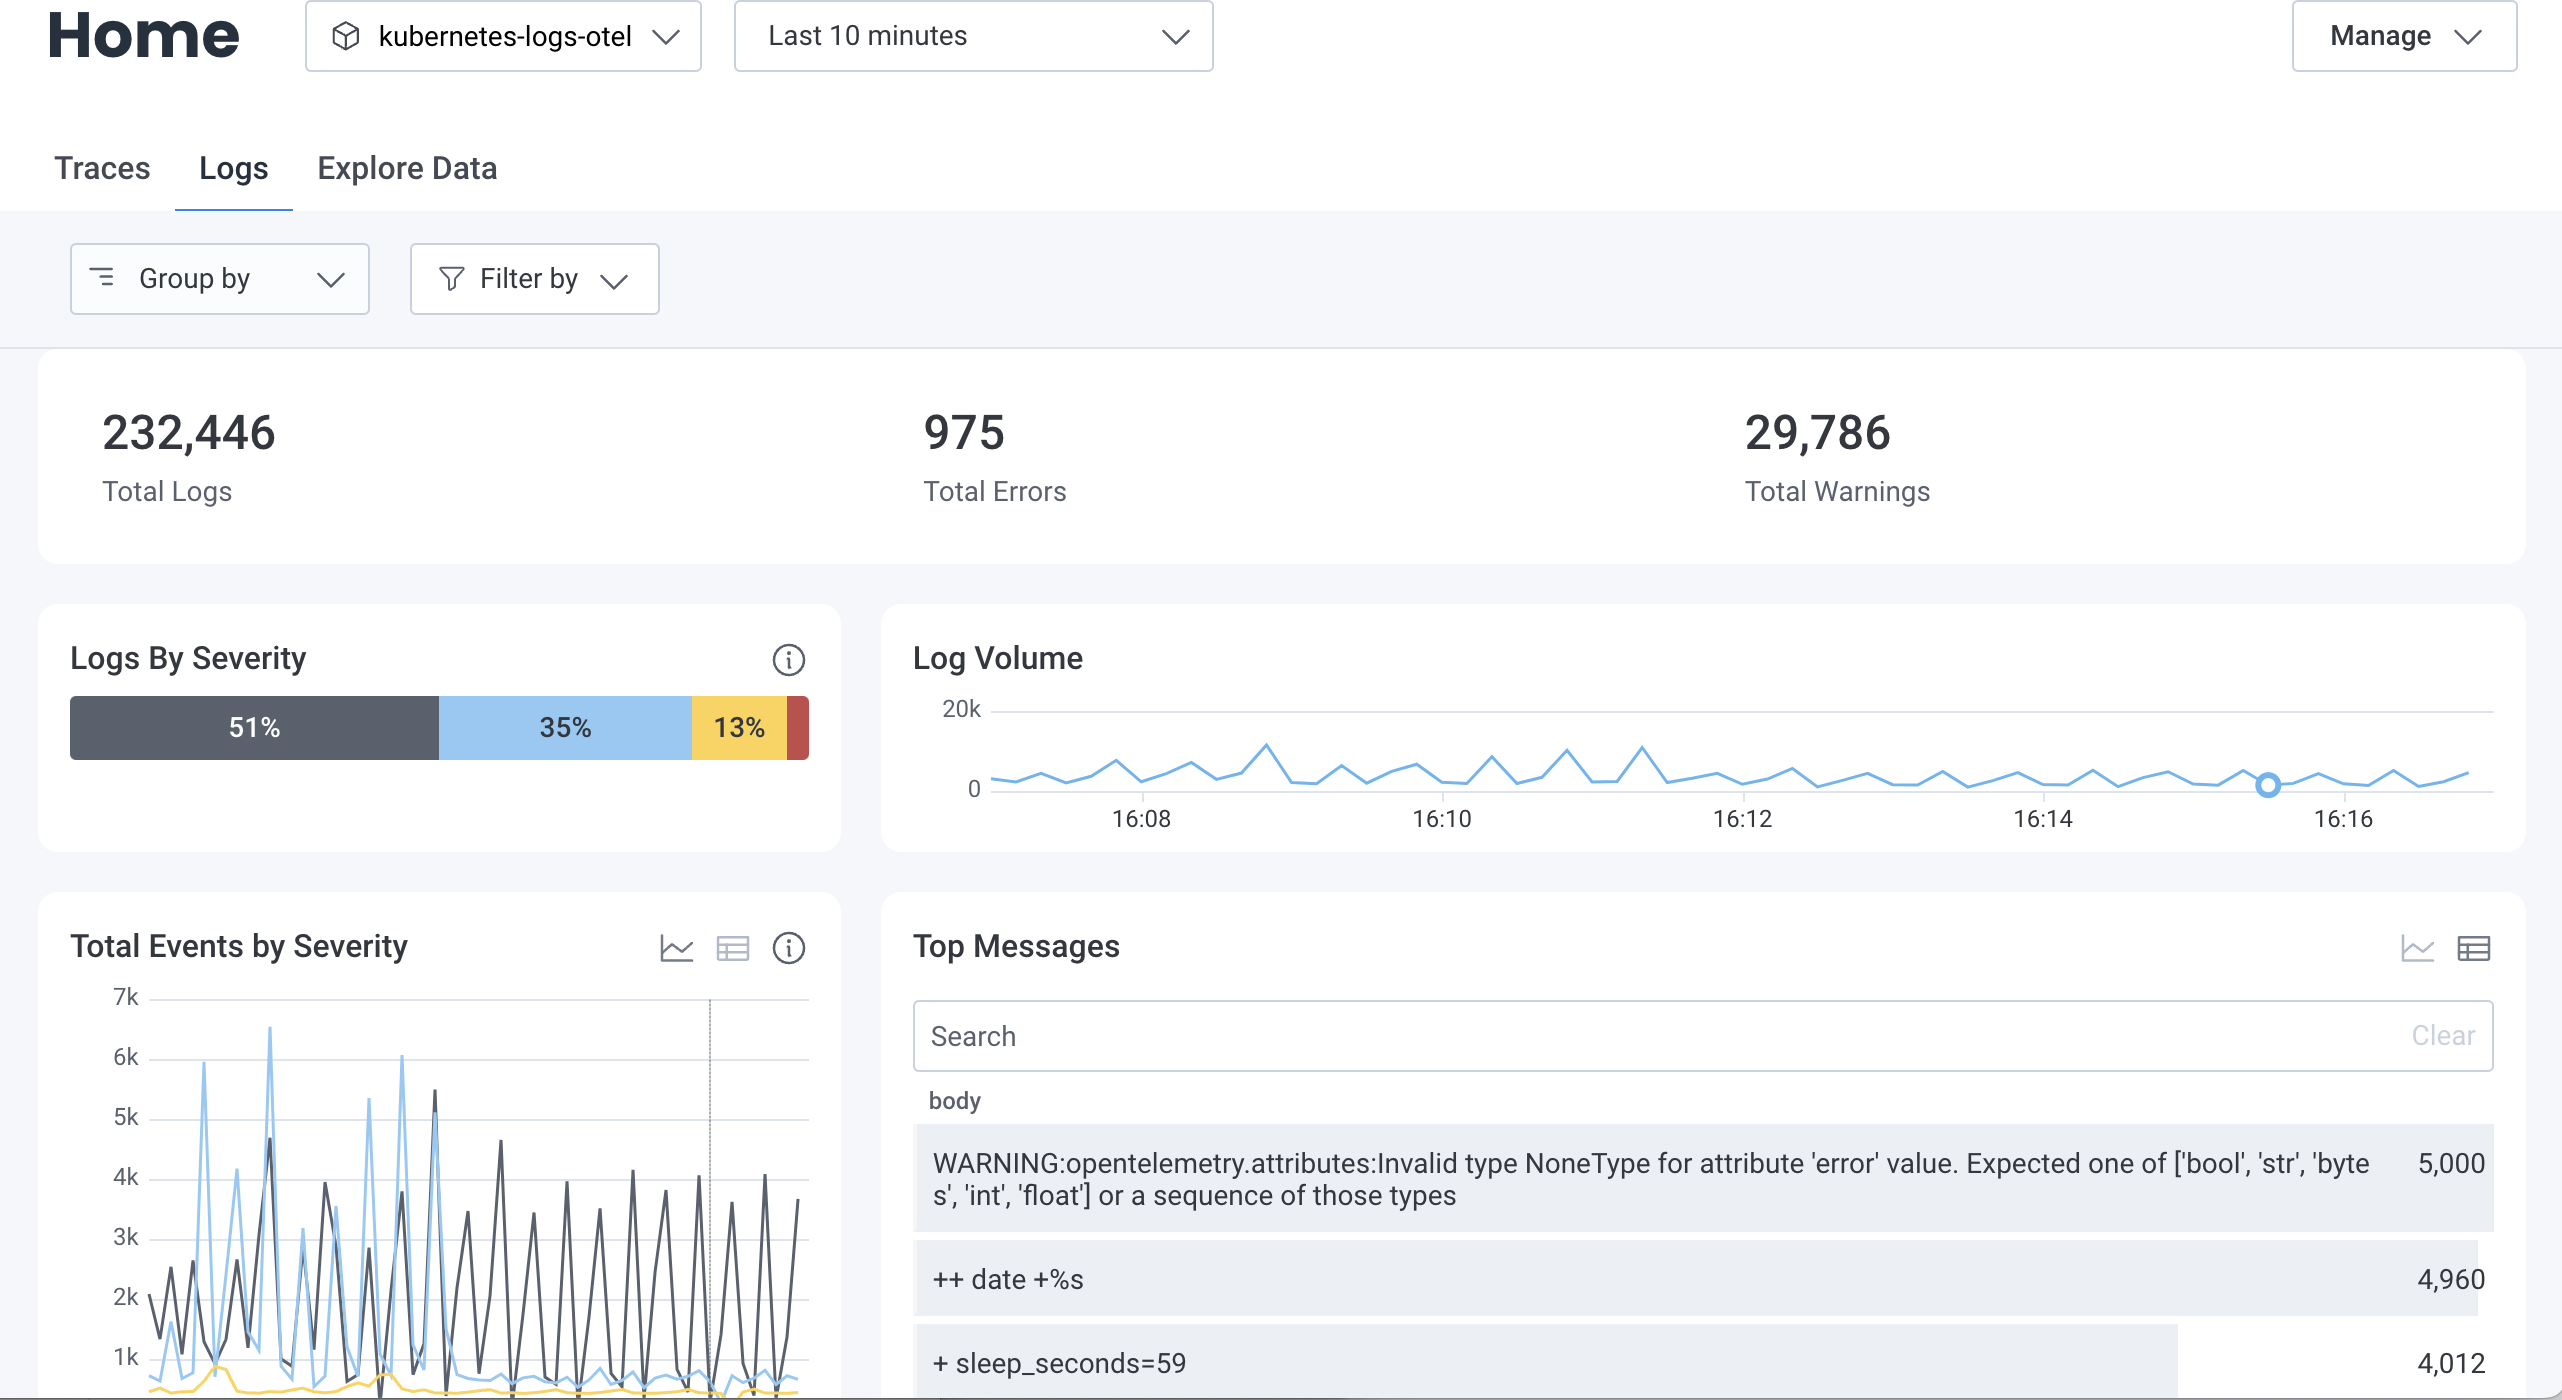
Once you have log data in Honeycomb, navigate to the [Home view](/observe/honeycomb-home/) and select your log dataset to begin exploring your data.
The **Logs** view contains [visualizations specially designed for exploring log data](/observe/honeycomb-home/#logs-visualizations).
 In addition, when you [view events](/investigate/analyze/explore-events/#view-events) in the **Explore Data** view, you can [change your data display to present data as log lines](/investigate/analyze/explore-events/#change-data-display).
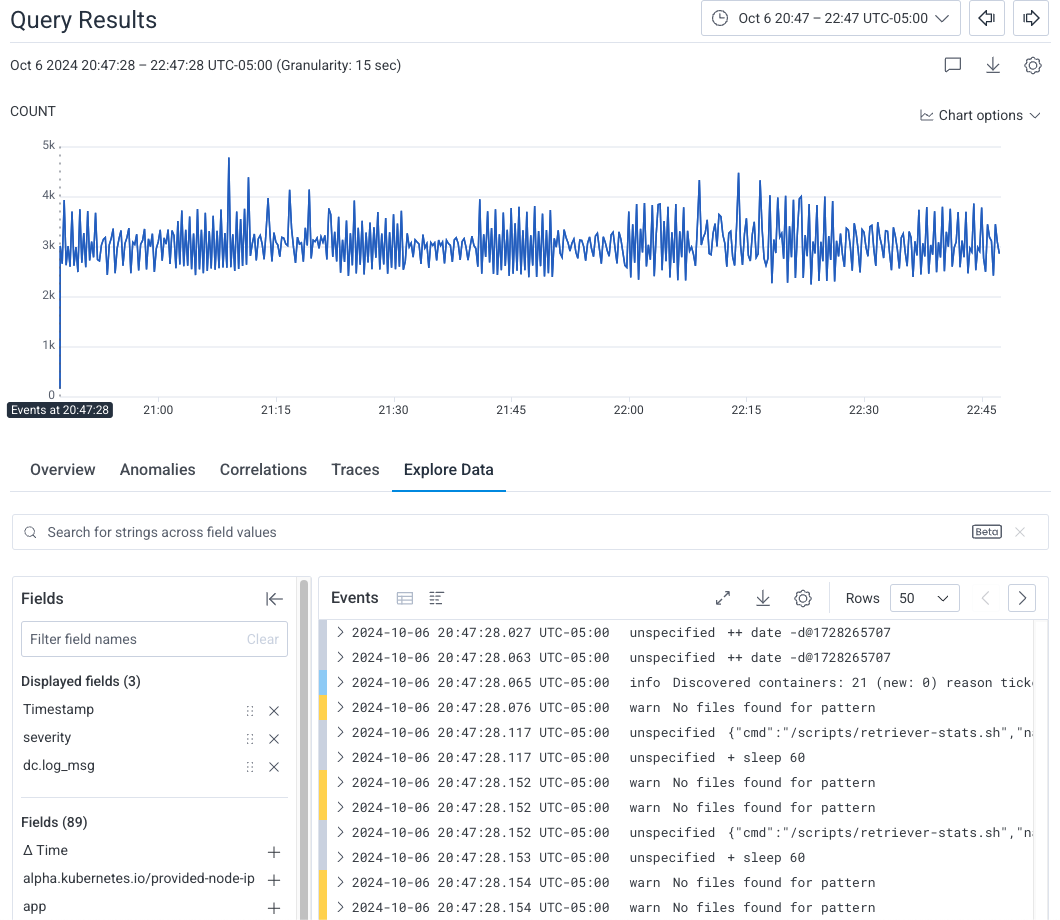 To learn more about the log lines display, visit [Explore Events: Events View](/investigate/analyze/explore-events/#events-view).
### Create a Board
For quick reference over time, you should create a [Board](/observe/boards/) that you can customize to show log-specific items of interest.
### Create Triggers
Once you have created a Board, you will likely want to configure some Triggers, so you can receive notifications when your data in Honeycomb crosses defined thresholds.
To create a [Trigger](/notify/triggers/):
1. On your Board, locate a Query from which you want to create a Trigger.
2. Select the query to open it in the Query Builder display.
3. Select the three-dot overflow menu, located to the left of **Run Query**, and select **Make Trigger**.
4. Configure the trigger by defining trigger details, an alert threshold, and your notification preferences.
### Investigate Unusual Behavior
Simplify debugging by using the [core analysis loop](/get-started/honeycomb/core-analysis-loop)--Honeycomb BubbleUp, Correlations, and rich queryable data--to dig in to application behavior.
## Identify Commonalities in Structured Logs
Examine what a subset of logs might have in common using [BubbleUp](/investigate/analyze/identify-outliers/).
**Scenario**:
You have structured MySQL slow query logs and want to discover specific queries that are running slower than expected.
**Solution:**
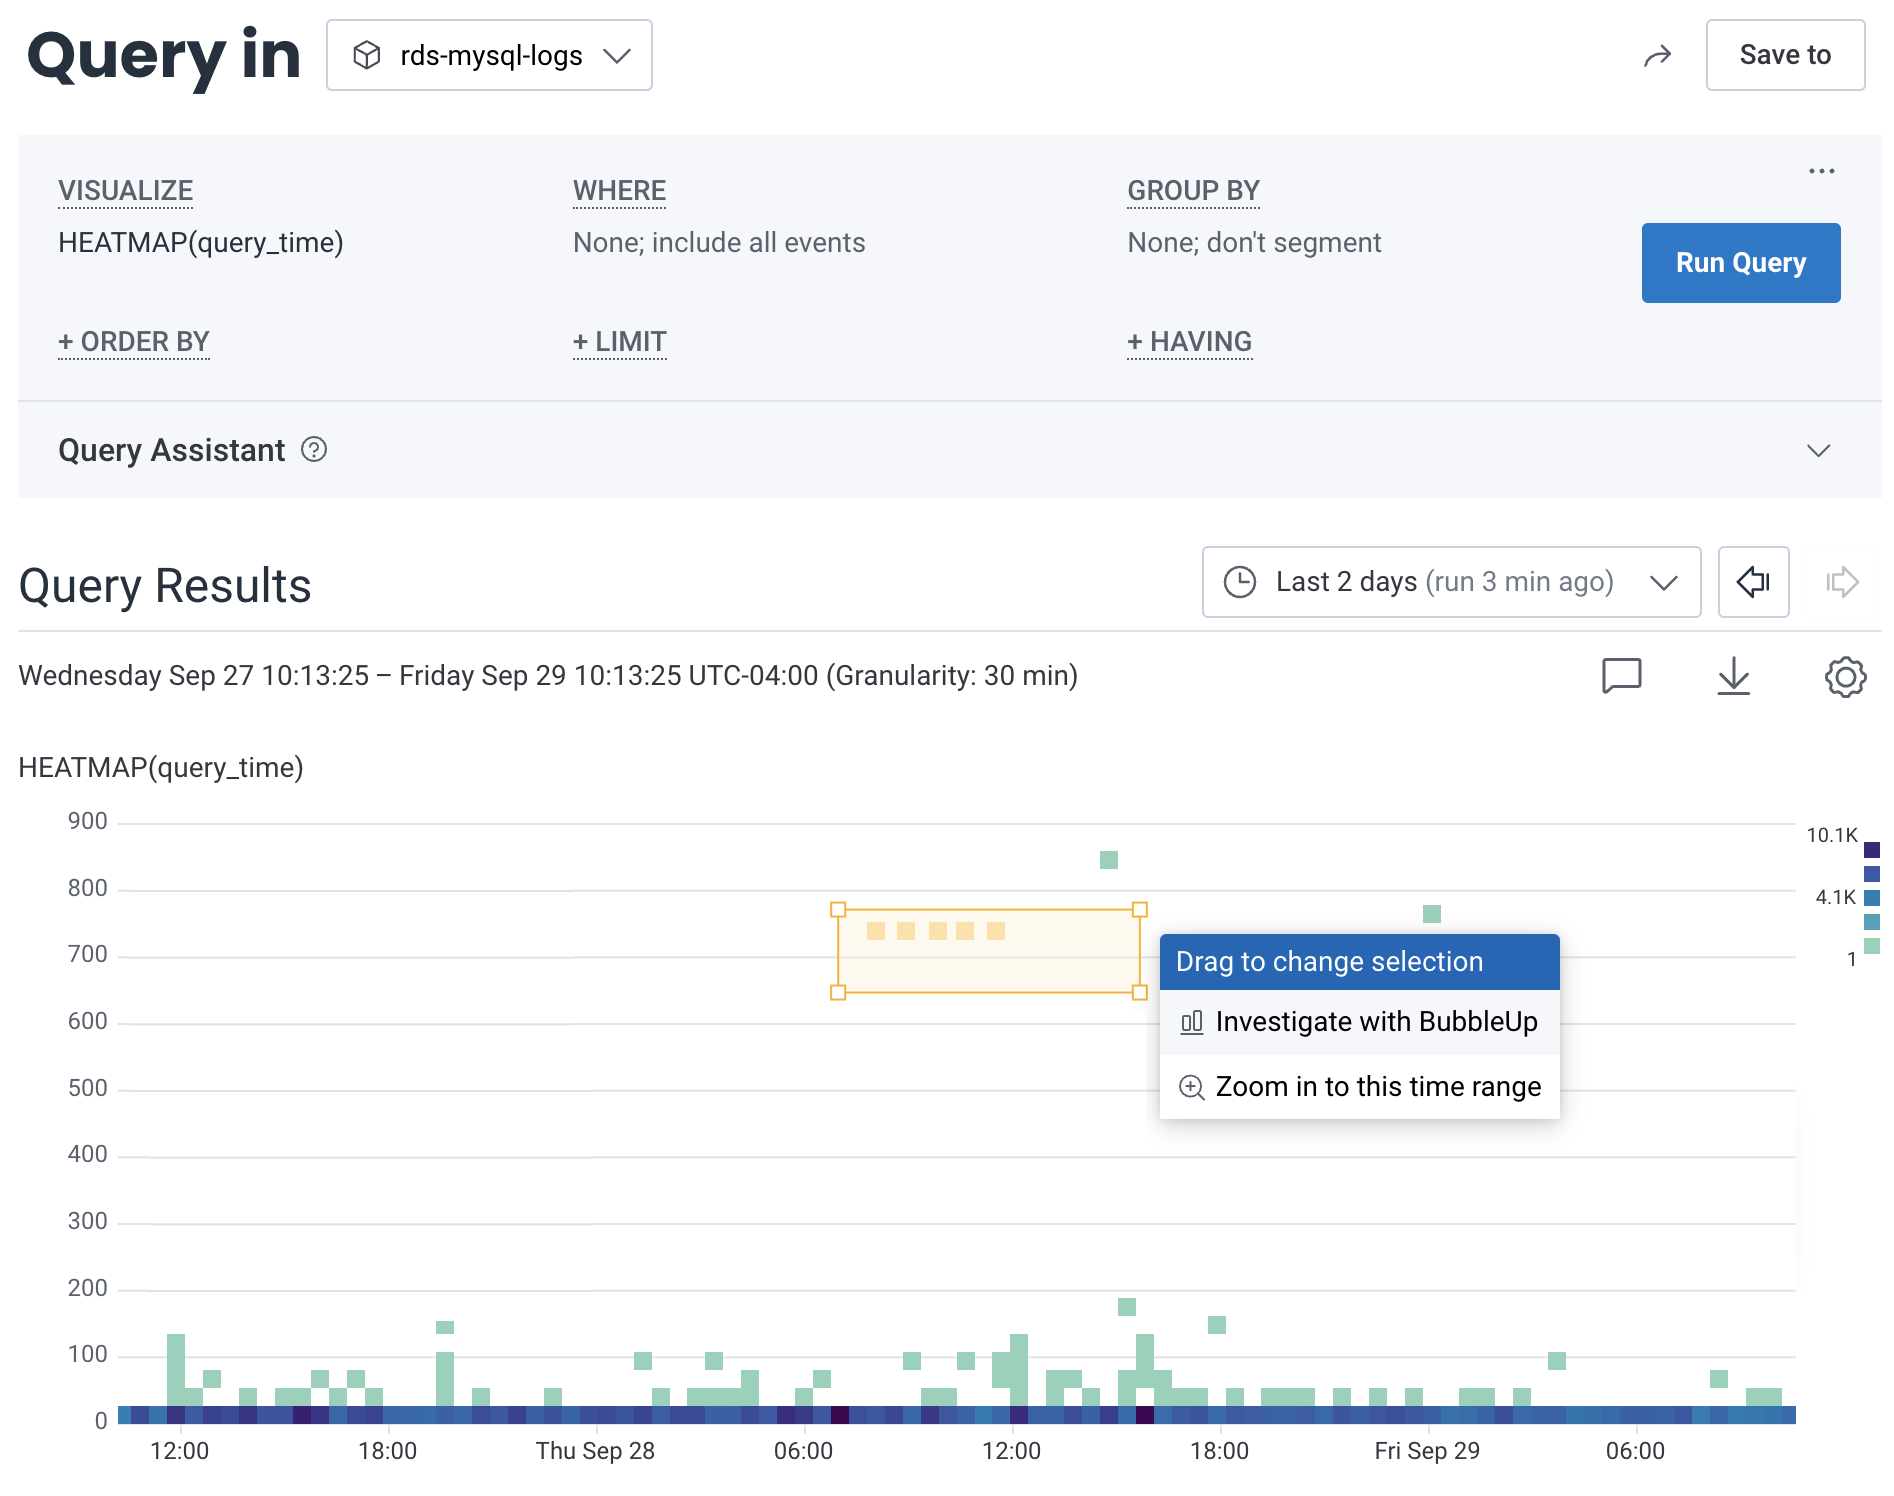
Run a query that visualizes a heatmap on `query_time`, then use BubbleUp to identify similarities between the slow queries.
1. Navigate to the Query Builder.
2. Build the following query:
| VISUALIZE |
| --------------------- |
| `HEATMAP(query_time)` |
3. Select **Run Query**.
4. In the **Query Results** section, locate the heatmap, and draw a box around logs that have a longer duration than you prefer.
5. From the context menu, select **BubbleUp Outliers**.
To learn more about the log lines display, visit [Explore Events: Events View](/investigate/analyze/explore-events/#events-view).
### Create a Board
For quick reference over time, you should create a [Board](/observe/boards/) that you can customize to show log-specific items of interest.
### Create Triggers
Once you have created a Board, you will likely want to configure some Triggers, so you can receive notifications when your data in Honeycomb crosses defined thresholds.
To create a [Trigger](/notify/triggers/):
1. On your Board, locate a Query from which you want to create a Trigger.
2. Select the query to open it in the Query Builder display.
3. Select the three-dot overflow menu, located to the left of **Run Query**, and select **Make Trigger**.
4. Configure the trigger by defining trigger details, an alert threshold, and your notification preferences.
### Investigate Unusual Behavior
Simplify debugging by using the [core analysis loop](/get-started/honeycomb/core-analysis-loop)--Honeycomb BubbleUp, Correlations, and rich queryable data--to dig in to application behavior.
## Identify Commonalities in Structured Logs
Examine what a subset of logs might have in common using [BubbleUp](/investigate/analyze/identify-outliers/).
**Scenario**:
You have structured MySQL slow query logs and want to discover specific queries that are running slower than expected.
**Solution:**
Run a query that visualizes a heatmap on `query_time`, then use BubbleUp to identify similarities between the slow queries.
1. Navigate to the Query Builder.
2. Build the following query:
| VISUALIZE |
| --------------------- |
| `HEATMAP(query_time)` |
3. Select **Run Query**.
4. In the **Query Results** section, locate the heatmap, and draw a box around logs that have a longer duration than you prefer.
5. From the context menu, select **BubbleUp Outliers**.
 6. Locate the **BubbleUp** view, and use the charts to examine the attributes that that logs inside your selection have in common.
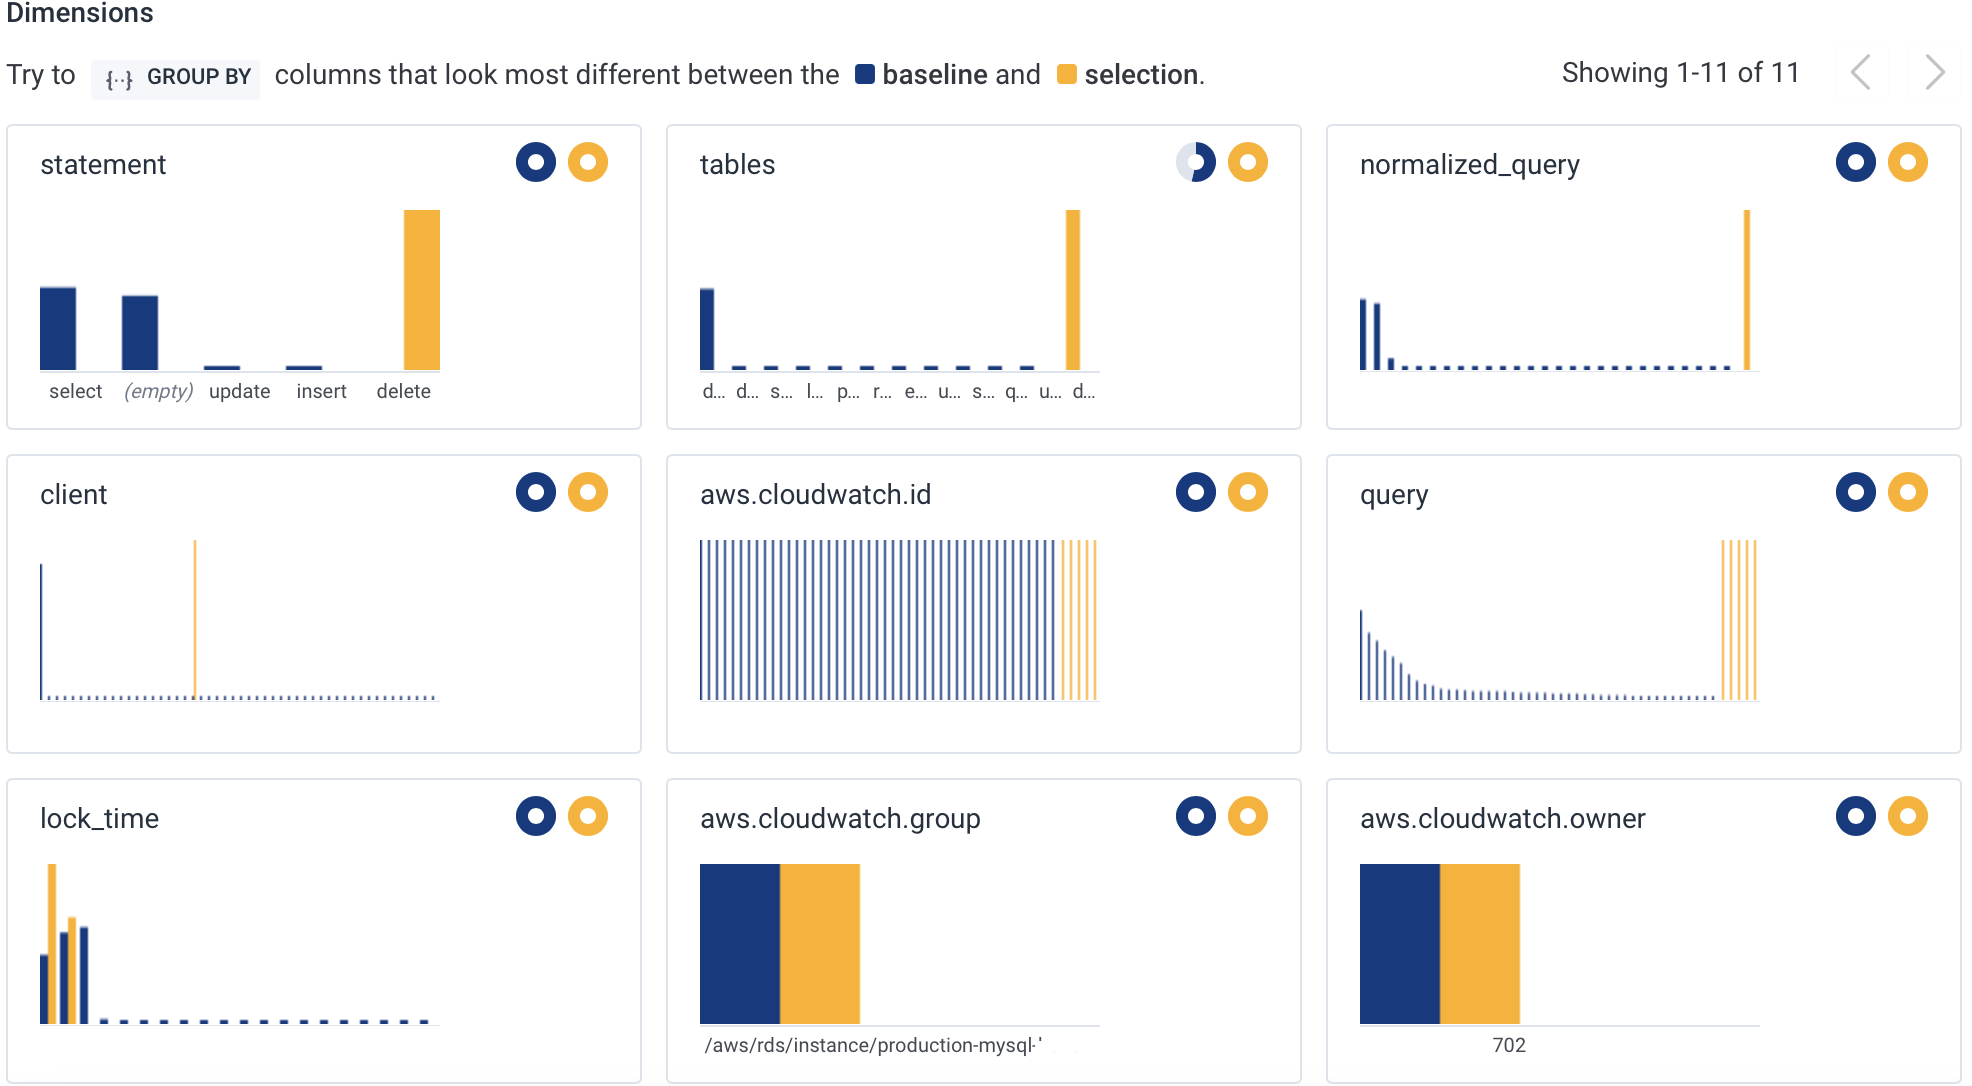 Notice the `statement` chart; each of the problematic logs contains the same `DELETE` statement.
You can now use the `normalized_query` chart to see the exact shape of the query that you need to optimize.
If your team has [Honeycomb Intelligence](/security-compliance/honeycomb-intelligence/) enabled, [BubbleUp Insights](/investigate/analyze/identify-outliers/#bubbleup-insights) appears below the heatmap for your seelction and highlights which fields are most worth investigating first.
## Parse Unstructured Logs
Because of the [shape of unstructured log data](/send-data/logs/) in Honeycomb, unstructured logs can be hard to query.
To improve the experience and make unstructured logs more useful, use [calculated fields](/send-data/standardize/transform-data/) to parse meaningful information out of the `message` attribute.
1. [Create a calculated field](/send-data/standardize/transform-data/#creating-calculated-fields).
2. Leverage the [`REG_VALUE` operation](/reference/calculated-field-expression/string/#reg_value) to parse log data using regular expressions.
Notice the `statement` chart; each of the problematic logs contains the same `DELETE` statement.
You can now use the `normalized_query` chart to see the exact shape of the query that you need to optimize.
If your team has [Honeycomb Intelligence](/security-compliance/honeycomb-intelligence/) enabled, [BubbleUp Insights](/investigate/analyze/identify-outliers/#bubbleup-insights) appears below the heatmap for your seelction and highlights which fields are most worth investigating first.
## Parse Unstructured Logs
Because of the [shape of unstructured log data](/send-data/logs/) in Honeycomb, unstructured logs can be hard to query.
To improve the experience and make unstructured logs more useful, use [calculated fields](/send-data/standardize/transform-data/) to parse meaningful information out of the `message` attribute.
1. [Create a calculated field](/send-data/standardize/transform-data/#creating-calculated-fields).
2. Leverage the [`REG_VALUE` operation](/reference/calculated-field-expression/string/#reg_value) to parse log data using regular expressions.