> ## Documentation Index
> Fetch the complete documentation index at: https://docs.honeycomb.io/llms.txt
> Use this file to discover all available pages before exploring further.
# Ask Questions with Canvas
> Query and investigate your telemetry in a collaborative, AI-powered workspace.
export const HnyIcon = ({alias, path, size = 16, iconColor}) => {
const iconMap = {
"home": "house.svg",
"marker": "caretFilledDown.svg",
"show-marker-options": "chatTextLeft.svg",
"download": "arrowLineDown.svg",
"trace-waterfall": "trace.svg",
"show-query-details": "listDashes.svg",
"table": "table.svg",
"log-lines": "logLines.svg",
"chart": "chartLine.svg",
"show-settings": "gear.svg",
"add": "plus.svg",
"remove": "delete.svg",
"persist": "caretDown.svg",
"close": "close.svg",
"copy": "copy.svg",
"zoom-in": "magnifyingGlassPlus.svg",
"zoom-out": "magnifyingGlassMinus.svg",
"color-assignment": "drop.svg",
"drag": "dots-six-vertical.svg",
"drawer": "drawer.svg",
"show-actions": "dotsThree.svg",
"edit": "pencil.svg",
"delete": "trash.svg",
"move": "arrowsOutCardinal.svg",
"show-legend": "circleInfo.svg",
"usage-ok": "usageGood.svg",
"usage-warning": "usageWarning.svg",
"usage-danger": "usageDanger.svg",
"open-query-builder": "query.svg",
"home-menu": "house.svg",
"query-menu": "query.svg",
"boards-menu": "board.svg",
"triggers-menu": "bell.svg",
"slos-menu": "handshake.svg",
"service-map-menu": "serviceMap.svg",
"history-menu": "clockCounterClockwise.svg",
"manage-data-menu": "cube.svg",
"usage-menu": "usageGood.svg",
"canvas-menu": "sparkle.svg",
"anomalies-menu": "anomalies.svg",
"show-details": "dotsThreeVertical.svg",
"resize-handle": "board-panel-resize-handle.png",
"standard-dataset": "cube.svg",
"trace-dataset": "cubeChat.svg",
"all-datasets": "linkedSquares.svg",
"share": "arrowBentRight.svg",
"run-in-query-builder": "arrowSquareUpRight.svg",
"link": "link.svg",
"text": "text.svg",
"receive": "arrowLineDown.svg",
"process": "lightning.svg",
"sample": "drop.svg",
"send": "arrowLineUp.svg",
"submit": "arrowUp.svg",
"canvas-menu": "sparkle.svg",
"canvas": "sparkle.svg",
"chat-about-this-page": "sparkle.svg",
"private": "lockKey.svg",
"shared": "people.svg",
"expand": "caretDown.svg",
"previous": "caretLeft.svg",
"next": "caretRight.svg",
"expand-chat": "caretLeft.svg",
"minimize-chat": "caretRight.svg",
"open-in-canvas": "arrowSquareUpRight.svg"
};
const iconBasePath = "/_assets/icons/";
const iconPath = path || (alias ? `${iconBasePath}${iconMap[alias]}` : undefined);
return ;
};
Honeycomb's Canvas is an AI-powered, collaborative investigation workspace.
Canvas combines conversational AI, Honeycomb's query engine, and a multiplayer infinite canvas to help you analyze observability data, understand your system's behavior, and debug application issues in Honeycomb.
With Canvas you can:
* Query traces, logs, and metrics without writing queries manually.
* [Chat about the page](/investigate/canvas/chat-about-a-page/) you are on to quickly understand queries, boards, and other views.
* [Automatically investigate](/investigate/canvas/auto-investigate/) alerts, anomalies, or why a Service Level Objective (SLO) alert fired.
* Analyze patterns across user cohorts or service dependencies as a team.
## How it works
### Technical integration
Canvas integrates directly with Honeycomb's query engine and has access to:
* Team information
* Environment and Dataset metadata
* Field schemas and sample values
* Query execution capabilities
* Trace visualization tools
* SLO and Trigger information
* BubbleUp for identifying outliers
Canvas translates natural language requests into structured queries using Honeycomb's API and presents results in an accessible format with appropriate visualizations.
### Query transparency
Canvas makes all generated queries available throughout your investigation.
You can examine the exact query syntax Canvas creates from your natural language questions and modify queries directly in the Query Builder.
### Persistent workspaces
Canvas auto-saves investigations as persistent workspaces that you can [revisit](#revisiting-a-canvas) and [share](#sharing-a-canvas-investigation) with Team members.
## Creating a Canvas investigation
Begin an investigation by creating a new Canvas or opening an existing query to use as context in Canvas.
To start a new Canvas investigation:
1. Select **Canvas** () from the navigation menu.
2. Enter your question or investigation goal as a prompt.
3. Submit () your prompt.
## Viewing past investigations
1. Select **Canvas** () from the navigation menu.
2. Look for a previous invesigation under **All Investigations**.
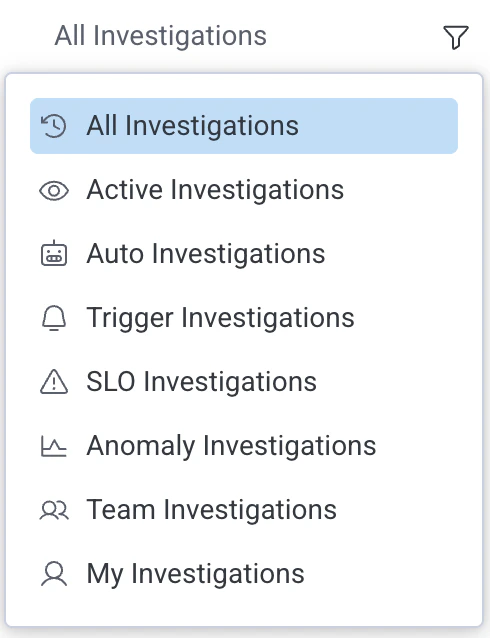
3. Optionally filter by investigation type by selecting the filter button to the right of **All Investigations**.
You can filter the all investigations view by:
* Active investigations
* Auto invesigations
* Trigger investigations
* SLO investigations
* Anomaly invesigations
* Team investigations
* Your (My) investigations
 ## Your chat and team chat
Each Canvas investigation has a **Your Chat** and **Team** chat tabs.
Each chat is your own agent, letting you and your team have separate conversations with Canvas in the same investigation.
You can view team chats by selecting the **Team** tab then choosing a teammate from the dropdown menu.
## Cursor chat
Cursor chat lets you send short messages that appear as bubbles near your cursor then fade away after a few seconds.
It's designed for quick, temporary communication during collaborative investigations.
During an investigation with your team, press `/` to open the chat input and type your message (up to 64 characters), and press `Enter` to send.
## Adding team-level instructions or context to Canvas
Team owners can [add custom skills](/investigate/canvas/skills/) to Canvas that are available to everyone on a team.
## Example prompts
You can reference specific Datasets, Environments, fields, or include links to queries in your chat prompts.
Use these examples as starting points to explore what's possible in Canvas:
* "What's causing the spike in database request volume?"
* "Investigate `/link/to/a/trace/`"
* "What SLOs would you recommend for `@my_dataset` based on fields prefixed with `my_prefix`?"
* "Which user cohorts are experiencing higher latency?"
* "What fields are available in the `frontend` dataset?"
* "Compare database query performance between `production` and `staging`."
### Effective question types
* Diagnostic questions to identify causes of specific issues: `Why did service X have high latency at 2pm yesterday?`
* Comparative questions to analyze differences between services or environments: `How does the error rate in production compare to staging?`
* Trend analysis questions to examine patterns over time: `Show me the pattern of database connections over the last week.`
* Correlation questions explore relationships between metrics: `Is there a relationship between cache miss rate and API latency?`
## Working with Canvas Results
Canvas displays the queries it generates from your natural language questions in visualization panels alongside your chat session.
### Interacting with visualizations
Interact with Canvas visualizations the same way you would with Query Results:
* Select data points to view traces or examine the underlying query.
* Hover over data points to explore details, such as timestamps and breakdowns of the selected dimension.
### Editing generated queries
Each visualization panel includes options to examine the query syntax:
* Select **View query**.
* Select **Open in new tab** from the options menu ().
Both options open the query in Query Builder, where you can modify it to refine results.
### Sharing a query
Share individual queries from a Canvas investigation by selecting the link icon () on any query panel.
This copies a shareable link to that specific query.
## Sharing a Canvas investigation
You can generate a shareable link to your Canvas investigation, so you can share it with your Team.
To share a non-private Canvas, select **Share** ().
## Best Practices
Follow these guidelines to get the most accurate and relevant results from Canvas.
* **Be specific in your prompts:**
* Include specific service names when applicable.
* Specify time ranges when looking at historical data.
* Mention particular metrics or dimensions of interest.
* State the relationship or pattern you are exploring.
* **Iterate on your investigation:**
* Start with a general question and refine based on initial results.
* Ask follow-up questions to dig deeper into patterns Canvas identifies.
* **Provide context:**
* If switching topics, give Canvas enough context to understand the new direction.
* Use mentions (`@`) to reference specific Datasets, Environments, or fields.
* **Ask for explanations:**
* Ask Canvas to explain query logic or data interpretation to deepen your understanding.
## Limitations
Canvas works within these boundaries:
* Complex analytical questions may require iterative refinement.
* Results are limited by the data retention policy of your Honeycomb account.
* Canvas can't modify your Honeycomb configuration or infrastructure.
## Your chat and team chat
Each Canvas investigation has a **Your Chat** and **Team** chat tabs.
Each chat is your own agent, letting you and your team have separate conversations with Canvas in the same investigation.
You can view team chats by selecting the **Team** tab then choosing a teammate from the dropdown menu.
## Cursor chat
Cursor chat lets you send short messages that appear as bubbles near your cursor then fade away after a few seconds.
It's designed for quick, temporary communication during collaborative investigations.
During an investigation with your team, press `/` to open the chat input and type your message (up to 64 characters), and press `Enter` to send.
## Adding team-level instructions or context to Canvas
Team owners can [add custom skills](/investigate/canvas/skills/) to Canvas that are available to everyone on a team.
## Example prompts
You can reference specific Datasets, Environments, fields, or include links to queries in your chat prompts.
Use these examples as starting points to explore what's possible in Canvas:
* "What's causing the spike in database request volume?"
* "Investigate `/link/to/a/trace/`"
* "What SLOs would you recommend for `@my_dataset` based on fields prefixed with `my_prefix`?"
* "Which user cohorts are experiencing higher latency?"
* "What fields are available in the `frontend` dataset?"
* "Compare database query performance between `production` and `staging`."
### Effective question types
* Diagnostic questions to identify causes of specific issues: `Why did service X have high latency at 2pm yesterday?`
* Comparative questions to analyze differences between services or environments: `How does the error rate in production compare to staging?`
* Trend analysis questions to examine patterns over time: `Show me the pattern of database connections over the last week.`
* Correlation questions explore relationships between metrics: `Is there a relationship between cache miss rate and API latency?`
## Working with Canvas Results
Canvas displays the queries it generates from your natural language questions in visualization panels alongside your chat session.
### Interacting with visualizations
Interact with Canvas visualizations the same way you would with Query Results:
* Select data points to view traces or examine the underlying query.
* Hover over data points to explore details, such as timestamps and breakdowns of the selected dimension.
### Editing generated queries
Each visualization panel includes options to examine the query syntax:
* Select **View query**.
* Select **Open in new tab** from the options menu ().
Both options open the query in Query Builder, where you can modify it to refine results.
### Sharing a query
Share individual queries from a Canvas investigation by selecting the link icon () on any query panel.
This copies a shareable link to that specific query.
## Sharing a Canvas investigation
You can generate a shareable link to your Canvas investigation, so you can share it with your Team.
To share a non-private Canvas, select **Share** ().
## Best Practices
Follow these guidelines to get the most accurate and relevant results from Canvas.
* **Be specific in your prompts:**
* Include specific service names when applicable.
* Specify time ranges when looking at historical data.
* Mention particular metrics or dimensions of interest.
* State the relationship or pattern you are exploring.
* **Iterate on your investigation:**
* Start with a general question and refine based on initial results.
* Ask follow-up questions to dig deeper into patterns Canvas identifies.
* **Provide context:**
* If switching topics, give Canvas enough context to understand the new direction.
* Use mentions (`@`) to reference specific Datasets, Environments, or fields.
* **Ask for explanations:**
* Ask Canvas to explain query logic or data interpretation to deepen your understanding.
## Limitations
Canvas works within these boundaries:
* Complex analytical questions may require iterative refinement.
* Results are limited by the data retention policy of your Honeycomb account.
* Canvas can't modify your Honeycomb configuration or infrastructure.