> ## Documentation Index
> Fetch the complete documentation index at: https://docs.honeycomb.io/llms.txt
> Use this file to discover all available pages before exploring further.
# Explore Traces
> Inspect the full context of a trace, span by span, to find exactly where latency, errors, or unexpected behavior occurred in your system.
export const HnyIcon = ({alias, path, size = 16, iconColor}) => {
const iconMap = {
"home": "house.svg",
"marker": "caretFilledDown.svg",
"show-marker-options": "chatTextLeft.svg",
"download": "arrowLineDown.svg",
"trace-waterfall": "trace.svg",
"show-query-details": "listDashes.svg",
"table": "table.svg",
"log-lines": "logLines.svg",
"chart": "chartLine.svg",
"show-settings": "gear.svg",
"add": "plus.svg",
"remove": "delete.svg",
"persist": "caretDown.svg",
"close": "close.svg",
"copy": "copy.svg",
"zoom-in": "magnifyingGlassPlus.svg",
"zoom-out": "magnifyingGlassMinus.svg",
"color-assignment": "drop.svg",
"drag": "dots-six-vertical.svg",
"drawer": "drawer.svg",
"show-actions": "dotsThree.svg",
"edit": "pencil.svg",
"delete": "trash.svg",
"move": "arrowsOutCardinal.svg",
"show-legend": "circleInfo.svg",
"usage-ok": "usageGood.svg",
"usage-warning": "usageWarning.svg",
"usage-danger": "usageDanger.svg",
"open-query-builder": "query.svg",
"home-menu": "house.svg",
"query-menu": "query.svg",
"boards-menu": "board.svg",
"triggers-menu": "bell.svg",
"slos-menu": "handshake.svg",
"service-map-menu": "serviceMap.svg",
"history-menu": "clockCounterClockwise.svg",
"manage-data-menu": "cube.svg",
"usage-menu": "usageGood.svg",
"canvas-menu": "sparkle.svg",
"anomalies-menu": "anomalies.svg",
"show-details": "dotsThreeVertical.svg",
"resize-handle": "board-panel-resize-handle.png",
"standard-dataset": "cube.svg",
"trace-dataset": "cubeChat.svg",
"all-datasets": "linkedSquares.svg",
"share": "arrowBentRight.svg",
"run-in-query-builder": "arrowSquareUpRight.svg",
"link": "link.svg",
"text": "text.svg",
"receive": "arrowLineDown.svg",
"process": "lightning.svg",
"sample": "drop.svg",
"send": "arrowLineUp.svg",
"submit": "arrowUp.svg",
"canvas-menu": "sparkle.svg",
"canvas": "sparkle.svg",
"chat-about-this-page": "sparkle.svg",
"private": "lockKey.svg",
"shared": "people.svg",
"expand": "caretDown.svg",
"previous": "caretLeft.svg",
"next": "caretRight.svg",
"expand-chat": "caretLeft.svg",
"minimize-chat": "caretRight.svg",
"open-in-canvas": "arrowSquareUpRight.svg"
};
const iconBasePath = "/_assets/icons/";
const iconPath = path || (alias ? `${iconBasePath}${iconMap[alias]}` : undefined);
return ;
};
**Traces** describe a complete unit of work for one or more services in an Environment.
Each trace is composed of multiple spans.
A span is a unit of instrumentation from a single location in your code.
A trace allows you to inspect the contextual data captured by each of its spans to discover how your systems performed in a given context.
Traces enable you to:
* understand how data flows through your systems
* identify errors
* find performance issues
## Access a Trace
The trace detail view is accessible through:
* points in a visualization
* the trace button ()
* directly with a permalink
1. In Query Builder, **SELECT** with any clause.
This creates the visualization below the Query Builder.
2. Select a point in the visualization.
Choose from a line graph or from a Heatmap.
From a line graph:
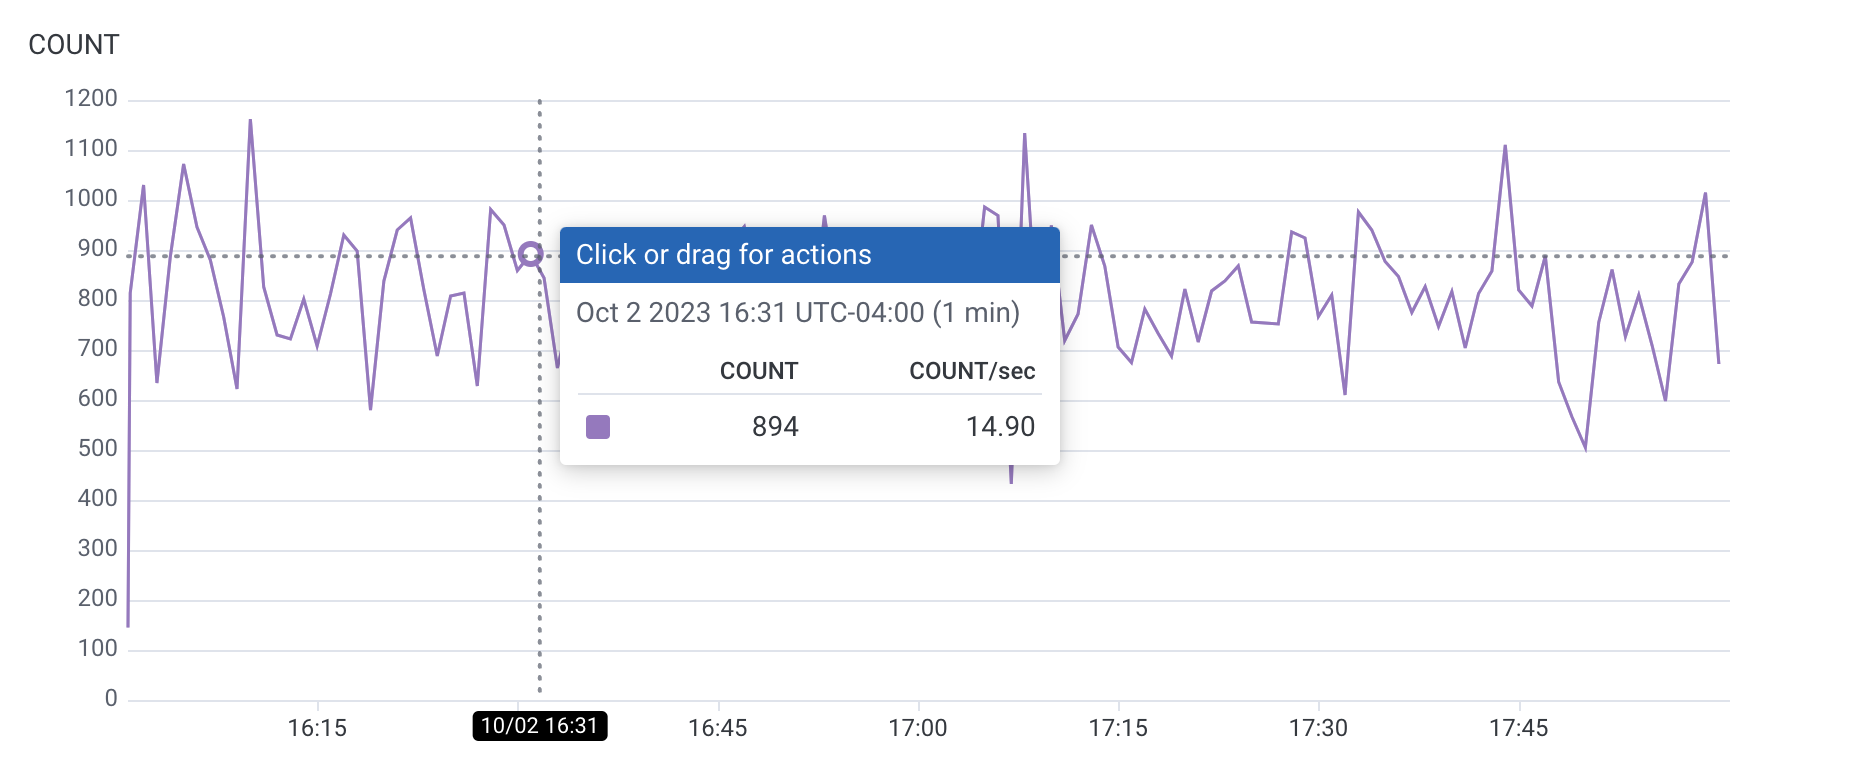 From a Heatmap:
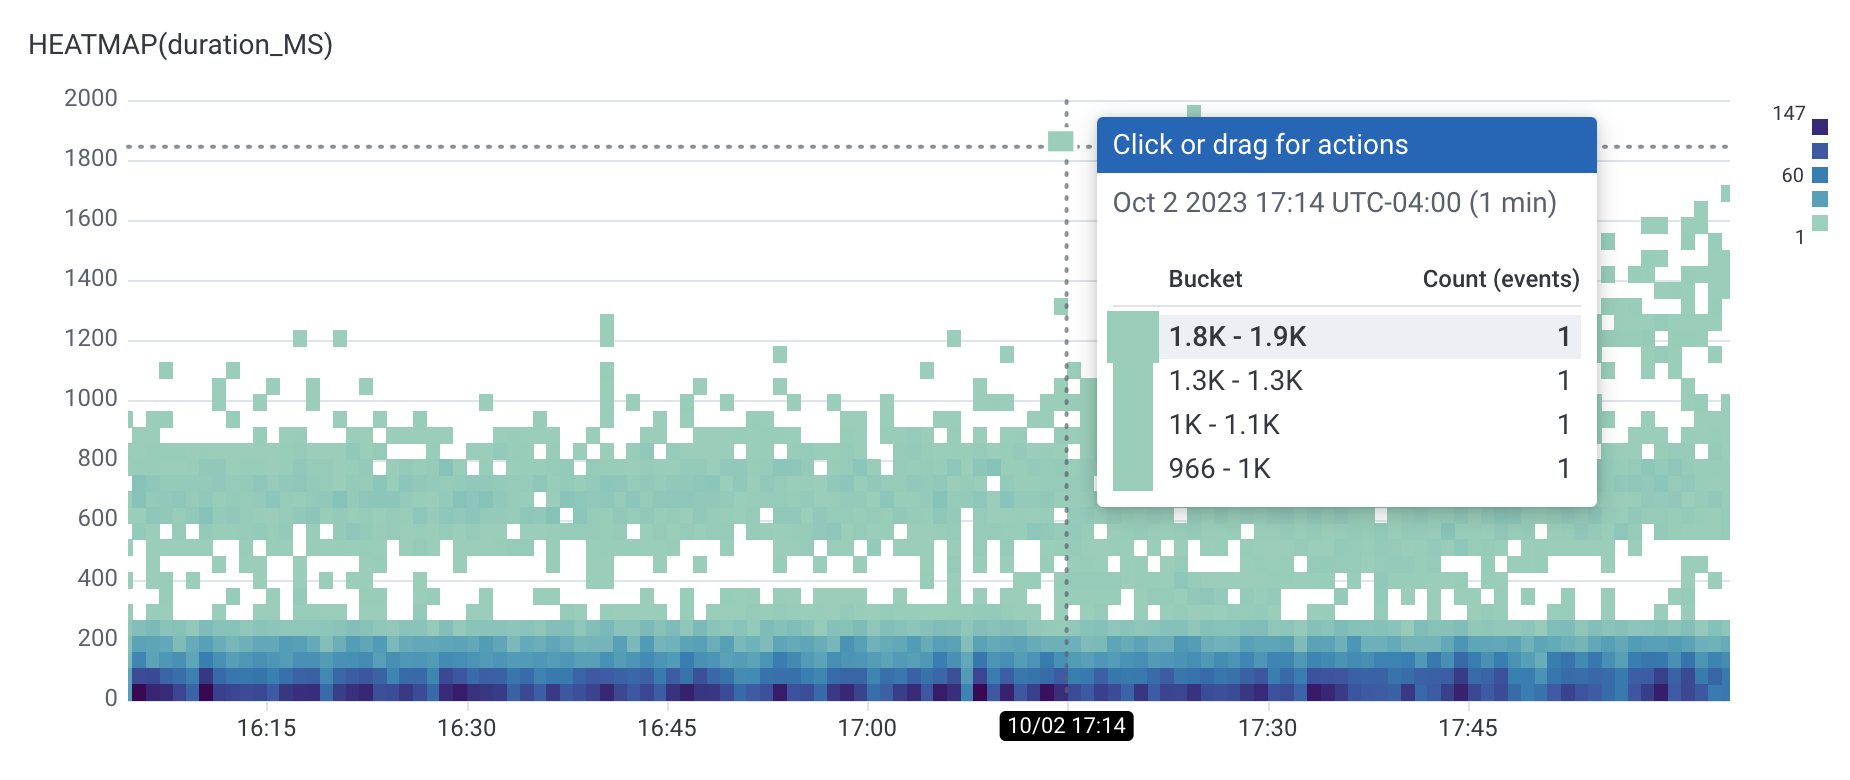 3. In the menu that appears, select **View trace**.
The next screen displays a trace detail view.
The displayed trace is the slowest trace with a child span and with a value is less than or equal to the value of your selected point.
Therefore, selecting a point on the `p90` graph gives a different trace than selecting a point on an overlaid `p10` graph.
You will be automatically taken to the first span in the trace waterfall that matches the query's filter criteria.
Selecting on a point in a graph with an empty **WHERE** clause will direct you to the root span in the trace waterfall.
1. Run a query in Query Builder.
2. Select the **Traces** tab that appears below any visualizations.
The Traces tab displays up to 10 traces with the slowest spans that match your query's filters.
3. In the menu that appears, select **View trace**.
The next screen displays a trace detail view.
The displayed trace is the slowest trace with a child span and with a value is less than or equal to the value of your selected point.
Therefore, selecting a point on the `p90` graph gives a different trace than selecting a point on an overlaid `p10` graph.
You will be automatically taken to the first span in the trace waterfall that matches the query's filter criteria.
Selecting on a point in a graph with an empty **WHERE** clause will direct you to the root span in the trace waterfall.
1. Run a query in Query Builder.
2. Select the **Traces** tab that appears below any visualizations.
The Traces tab displays up to 10 traces with the slowest spans that match your query's filters.
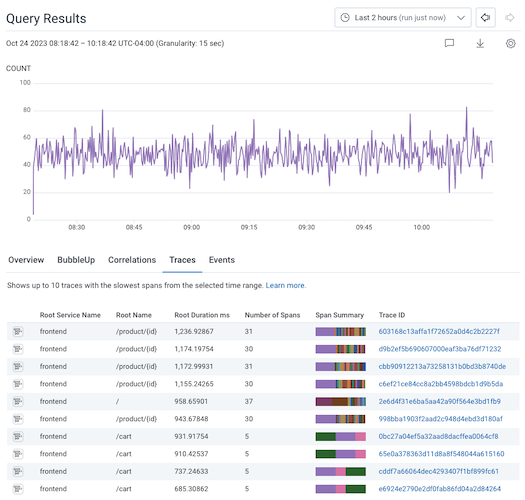 3. To be sent to a trace's trace detail view, select the trace's trace button () or its hyperlinked Trace ID.
1. Run a query in Query Builder.
2. Select the **Explore Data** tab that appears below any visualizations.
The Explore Data tab displays raw data for your current query, which ignores the query's aggregates, any **GROUP BY** fields, and any **ORDER BY** fields.
3. To be sent to a trace's trace detail view, select the trace's trace button () or its hyperlinked Trace ID.
1. Run a query in Query Builder.
2. Select the **Explore Data** tab that appears below any visualizations.
The Explore Data tab displays raw data for your current query, which ignores the query's aggregates, any **GROUP BY** fields, and any **ORDER BY** fields.
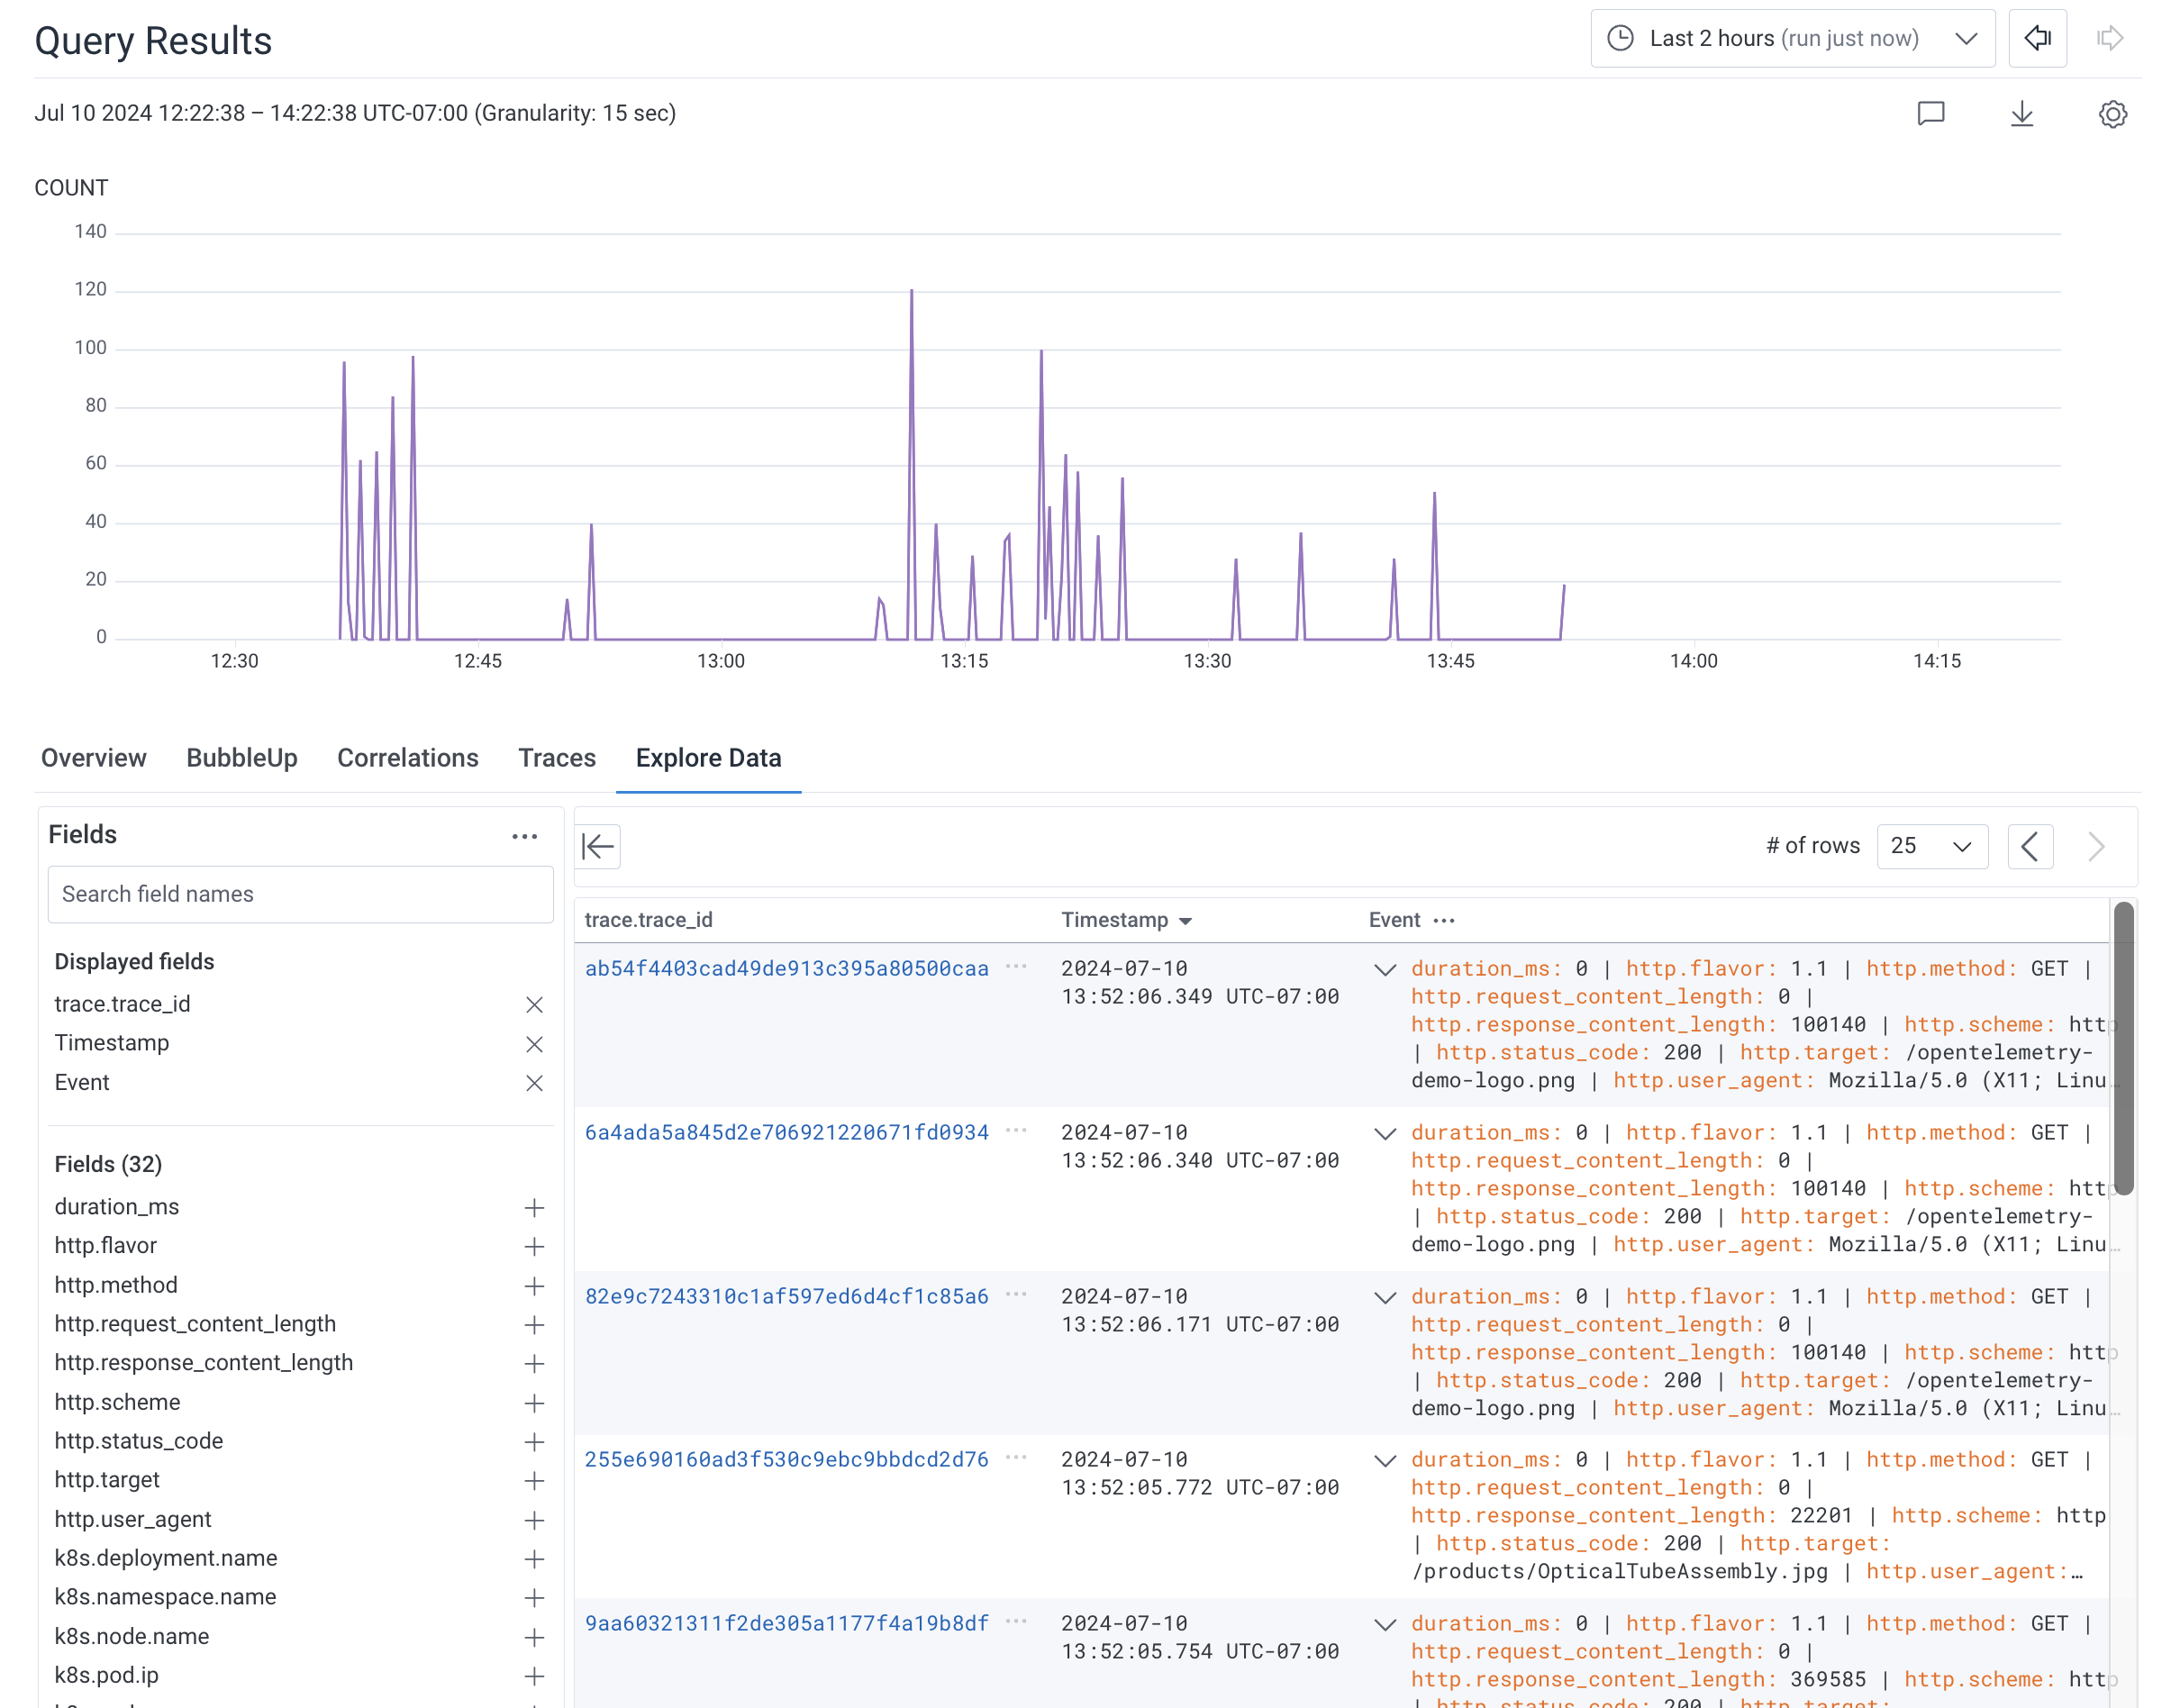 3. Select a trace ID hyperlink in the `trace.trace_id` column to display its trace waterfall view, which contains the span represented by that row.
## Interact with Traces
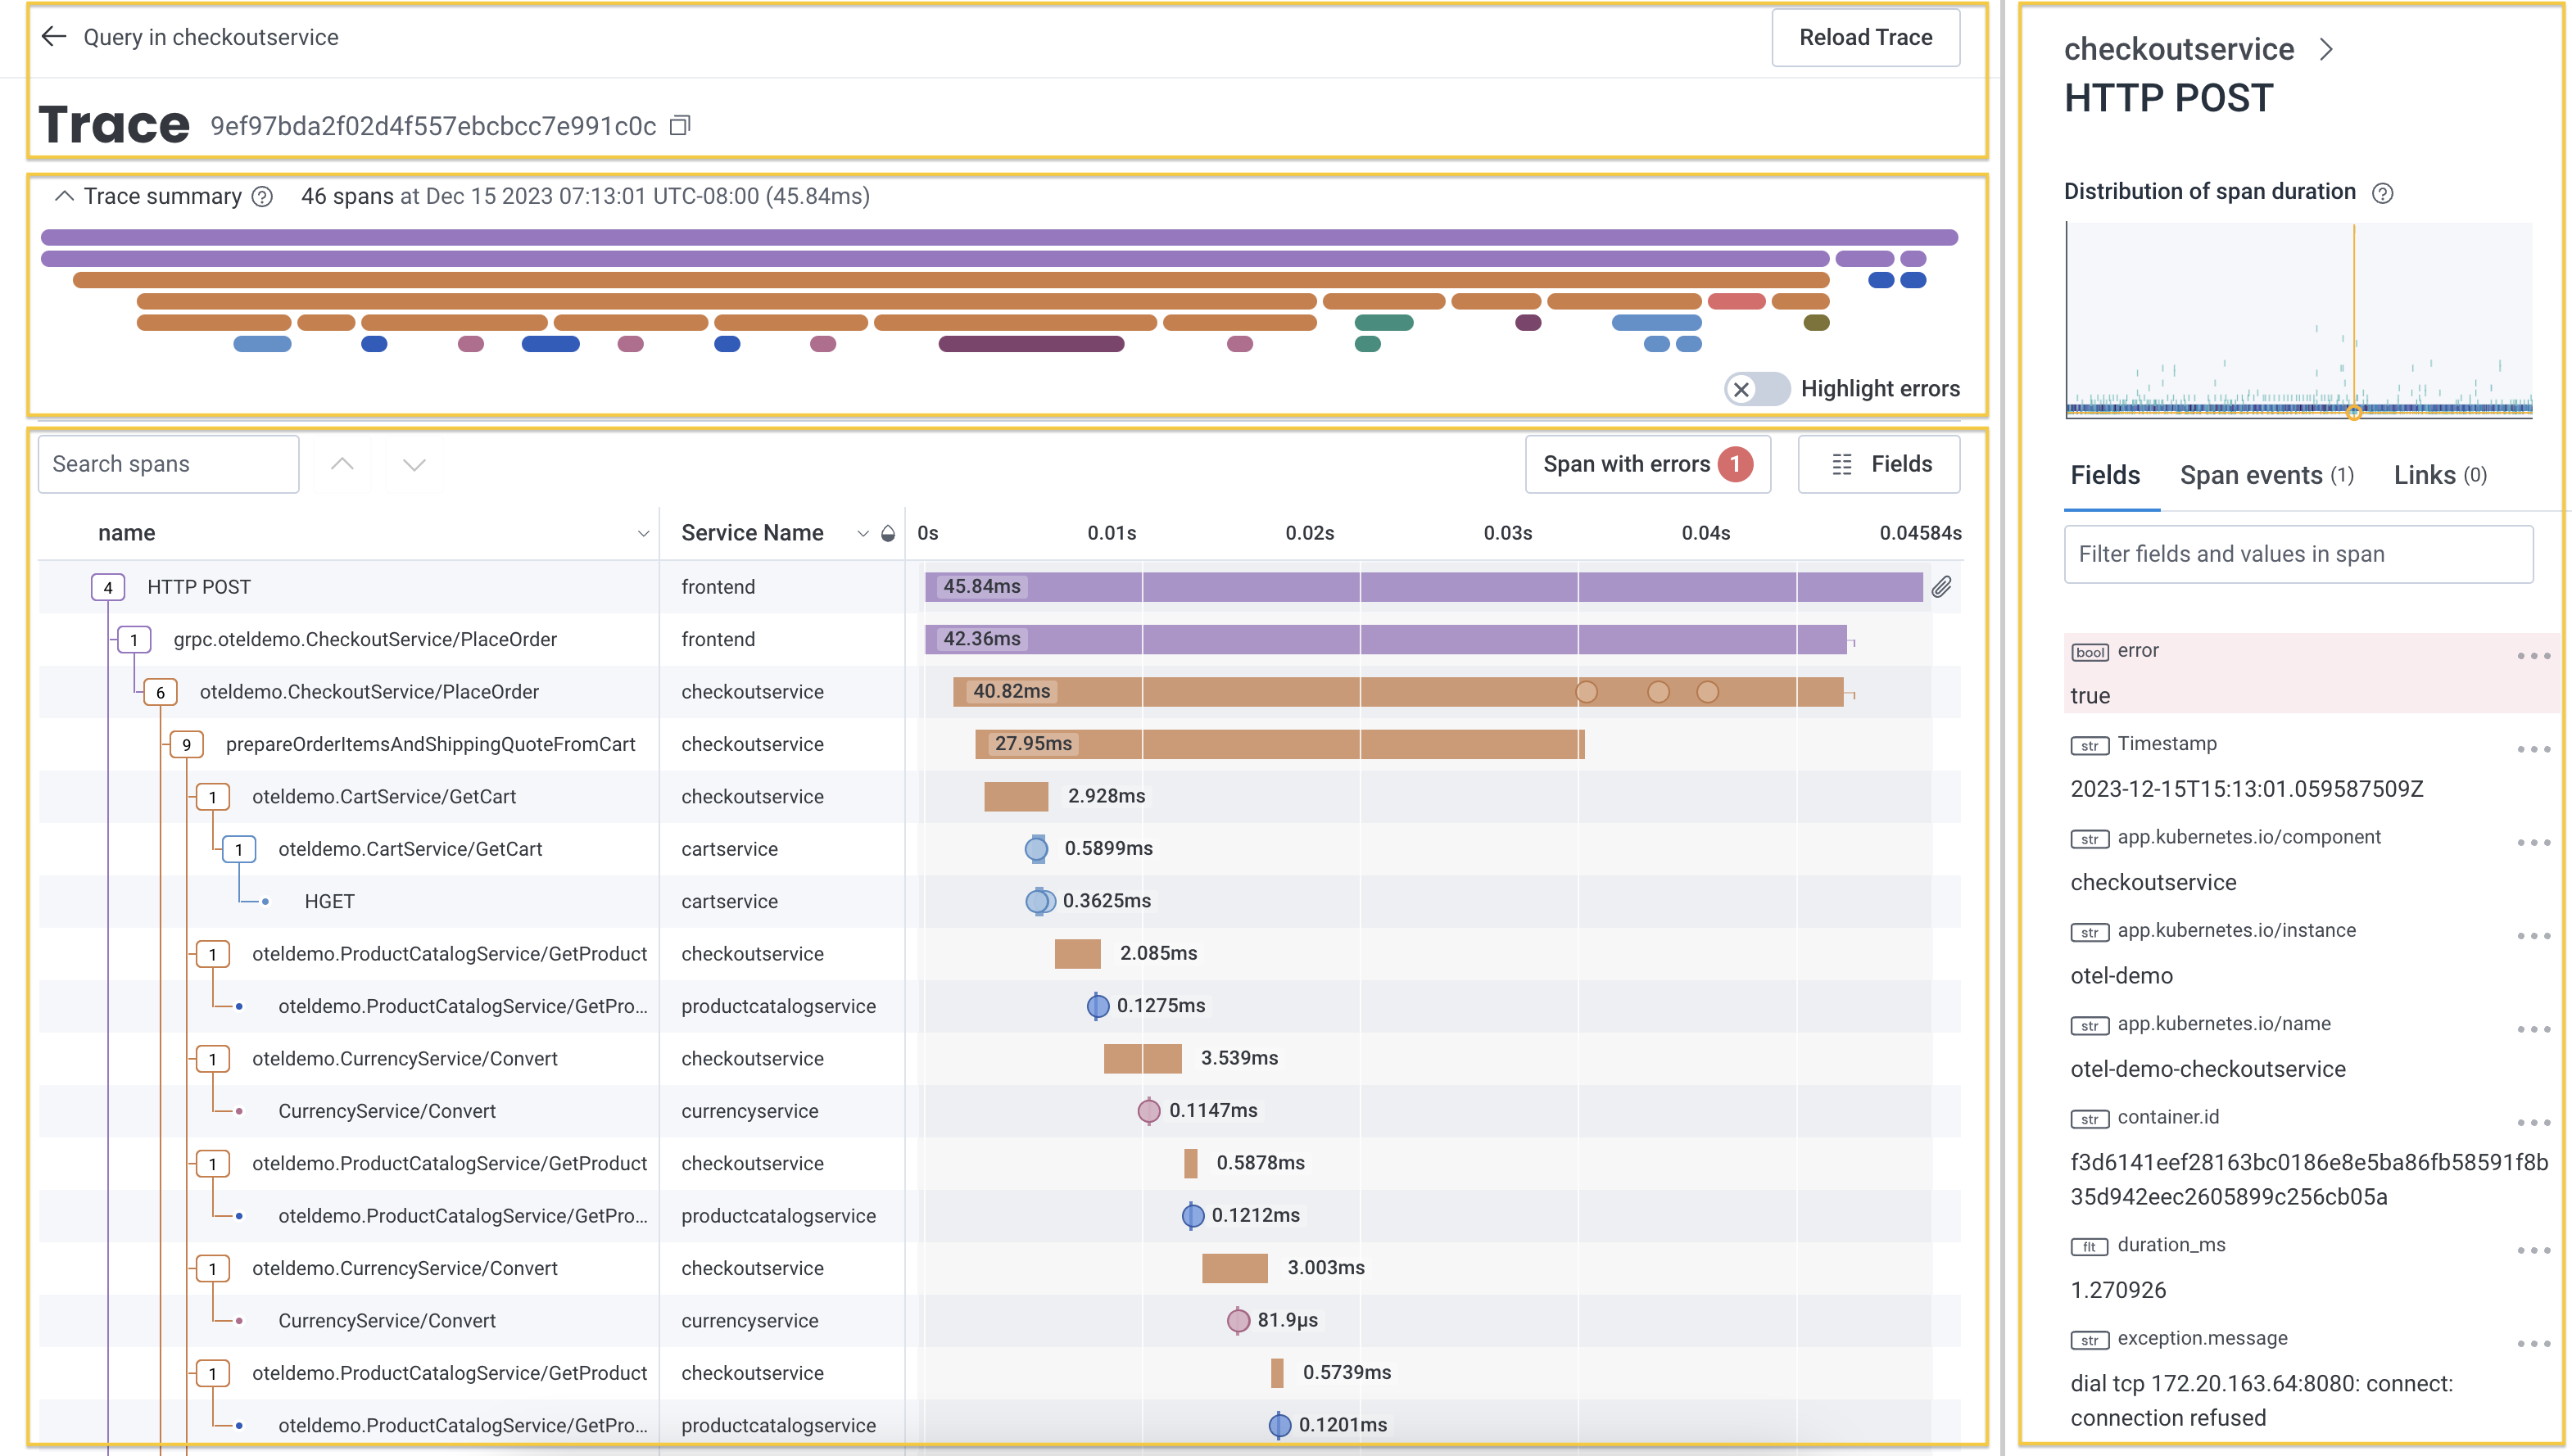
The trace detail view displays information in four areas:
* [trace identification](#trace-identification) with navigation and trace ID
* [trace summary](#trace-summary) with trace metadata
* [waterfall representation](#waterfall-representation) of spans with search and customization options
* [trace sidebar](#trace-sidebar) with details about the selected span
3. Select a trace ID hyperlink in the `trace.trace_id` column to display its trace waterfall view, which contains the span represented by that row.
## Interact with Traces
The trace detail view displays information in four areas:
* [trace identification](#trace-identification) with navigation and trace ID
* [trace summary](#trace-summary) with trace metadata
* [waterfall representation](#waterfall-representation) of spans with search and customization options
* [trace sidebar](#trace-sidebar) with details about the selected span
 ### Trace Identification
Each trace has a unique identifier presented at the top of page along side navigation elements.
### Trace Identification
Each trace has a unique identifier presented at the top of page along side navigation elements.
 The left-arrow navigates away from the trace view back to the visualization or results table where the trace was selected.
Honeycomb presents a trace when it has received the root span.
Each span has a unique identifier and datetime stamp of when it was created.
The **Reload Trace** button reloads the trace to ensure the waterfall representation contains all spans in the trace.
Traces may display a warning that it is missing spans with a link to resources to assist with [troubleshooting the missing spans](/troubleshoot/common-issues/data-in-honeycomb/#traces-have-a-missing-root-span-or-missing-spans).
The left-arrow navigates away from the trace view back to the visualization or results table where the trace was selected.
Honeycomb presents a trace when it has received the root span.
Each span has a unique identifier and datetime stamp of when it was created.
The **Reload Trace** button reloads the trace to ensure the waterfall representation contains all spans in the trace.
Traces may display a warning that it is missing spans with a link to resources to assist with [troubleshooting the missing spans](/troubleshoot/common-issues/data-in-honeycomb/#traces-have-a-missing-root-span-or-missing-spans).
 ### Trace Summary
The trace summary displays important metadata and provides a condensed view of the trace waterfall diagram.
Metadata about the trace includes its total number of spans, the timestamp of the root span, and the total trace duration.
Use this view to find long-running spans and spans with errors within your trace without scrolling through the entire trace waterfall.
Expand or collapse the summary view by selecting the directional caret.
### Trace Summary
The trace summary displays important metadata and provides a condensed view of the trace waterfall diagram.
Metadata about the trace includes its total number of spans, the timestamp of the root span, and the total trace duration.
Use this view to find long-running spans and spans with errors within your trace without scrolling through the entire trace waterfall.
Expand or collapse the summary view by selecting the directional caret.
 The trace summary displays up to 6 levels of span dependency.
The first level in the topmost row starts with the root span.
The second row shows the root span's dependent spans, and each following row displays a dependent span level, if applicable.
The width of the summary represents the whole duration of the trace.
Hover over any span to see the name of the longest running span at that depth and point in time. Select the span to view its highlighted location in the waterfall representation below.
The trace summary displays up to 6 levels of span dependency.
The first level in the topmost row starts with the root span.
The second row shows the root span's dependent spans, and each following row displays a dependent span level, if applicable.
The width of the summary represents the whole duration of the trace.
Hover over any span to see the name of the longest running span at that depth and point in time. Select the span to view its highlighted location in the waterfall representation below.
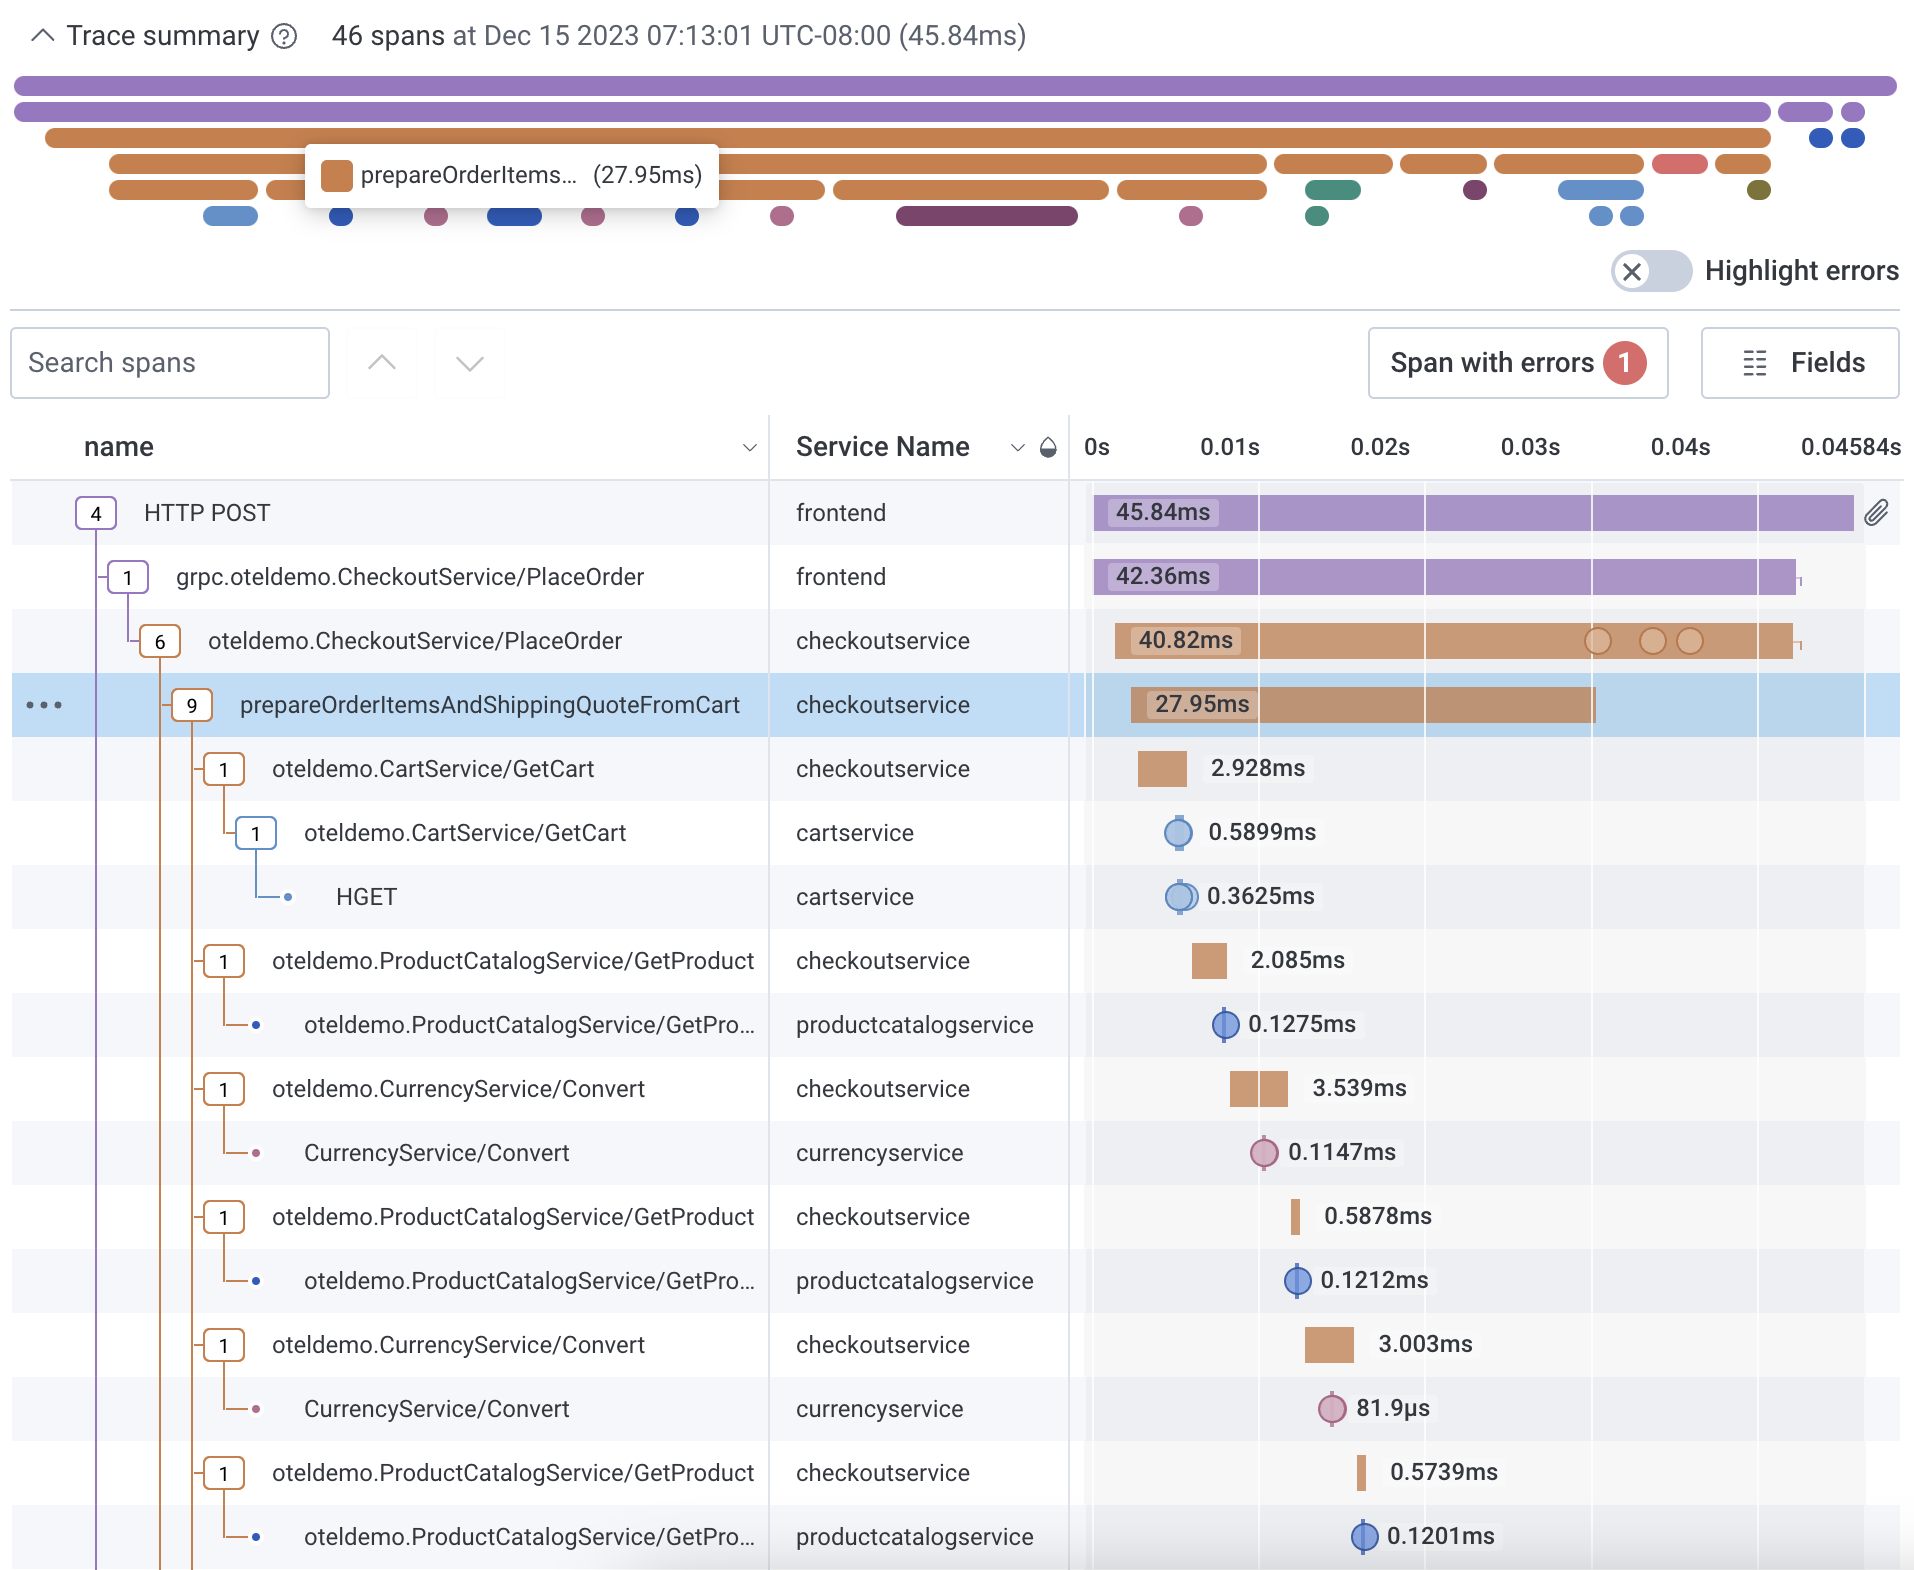 Use **Highlight errors** to toggle span error highlighting on and off.
Spans with errors appear in red.
Select a span with an error to view its location in the waterfall representation below and additional metadata in the trace sidebar.
Use **Highlight errors** to toggle span error highlighting on and off.
Spans with errors appear in red.
Select a span with an error to view its location in the waterfall representation below and additional metadata in the trace sidebar.
 ### Waterfall Representation
Honeycomb uses the metadata from each span to reconstruct the relationships between them and generate a trace diagram.
This is also called a **waterfall diagram** because it shows how the order of operations cascades across the total execution time.
### Waterfall Representation
Honeycomb uses the metadata from each span to reconstruct the relationships between them and generate a trace diagram.
This is also called a **waterfall diagram** because it shows how the order of operations cascades across the total execution time.
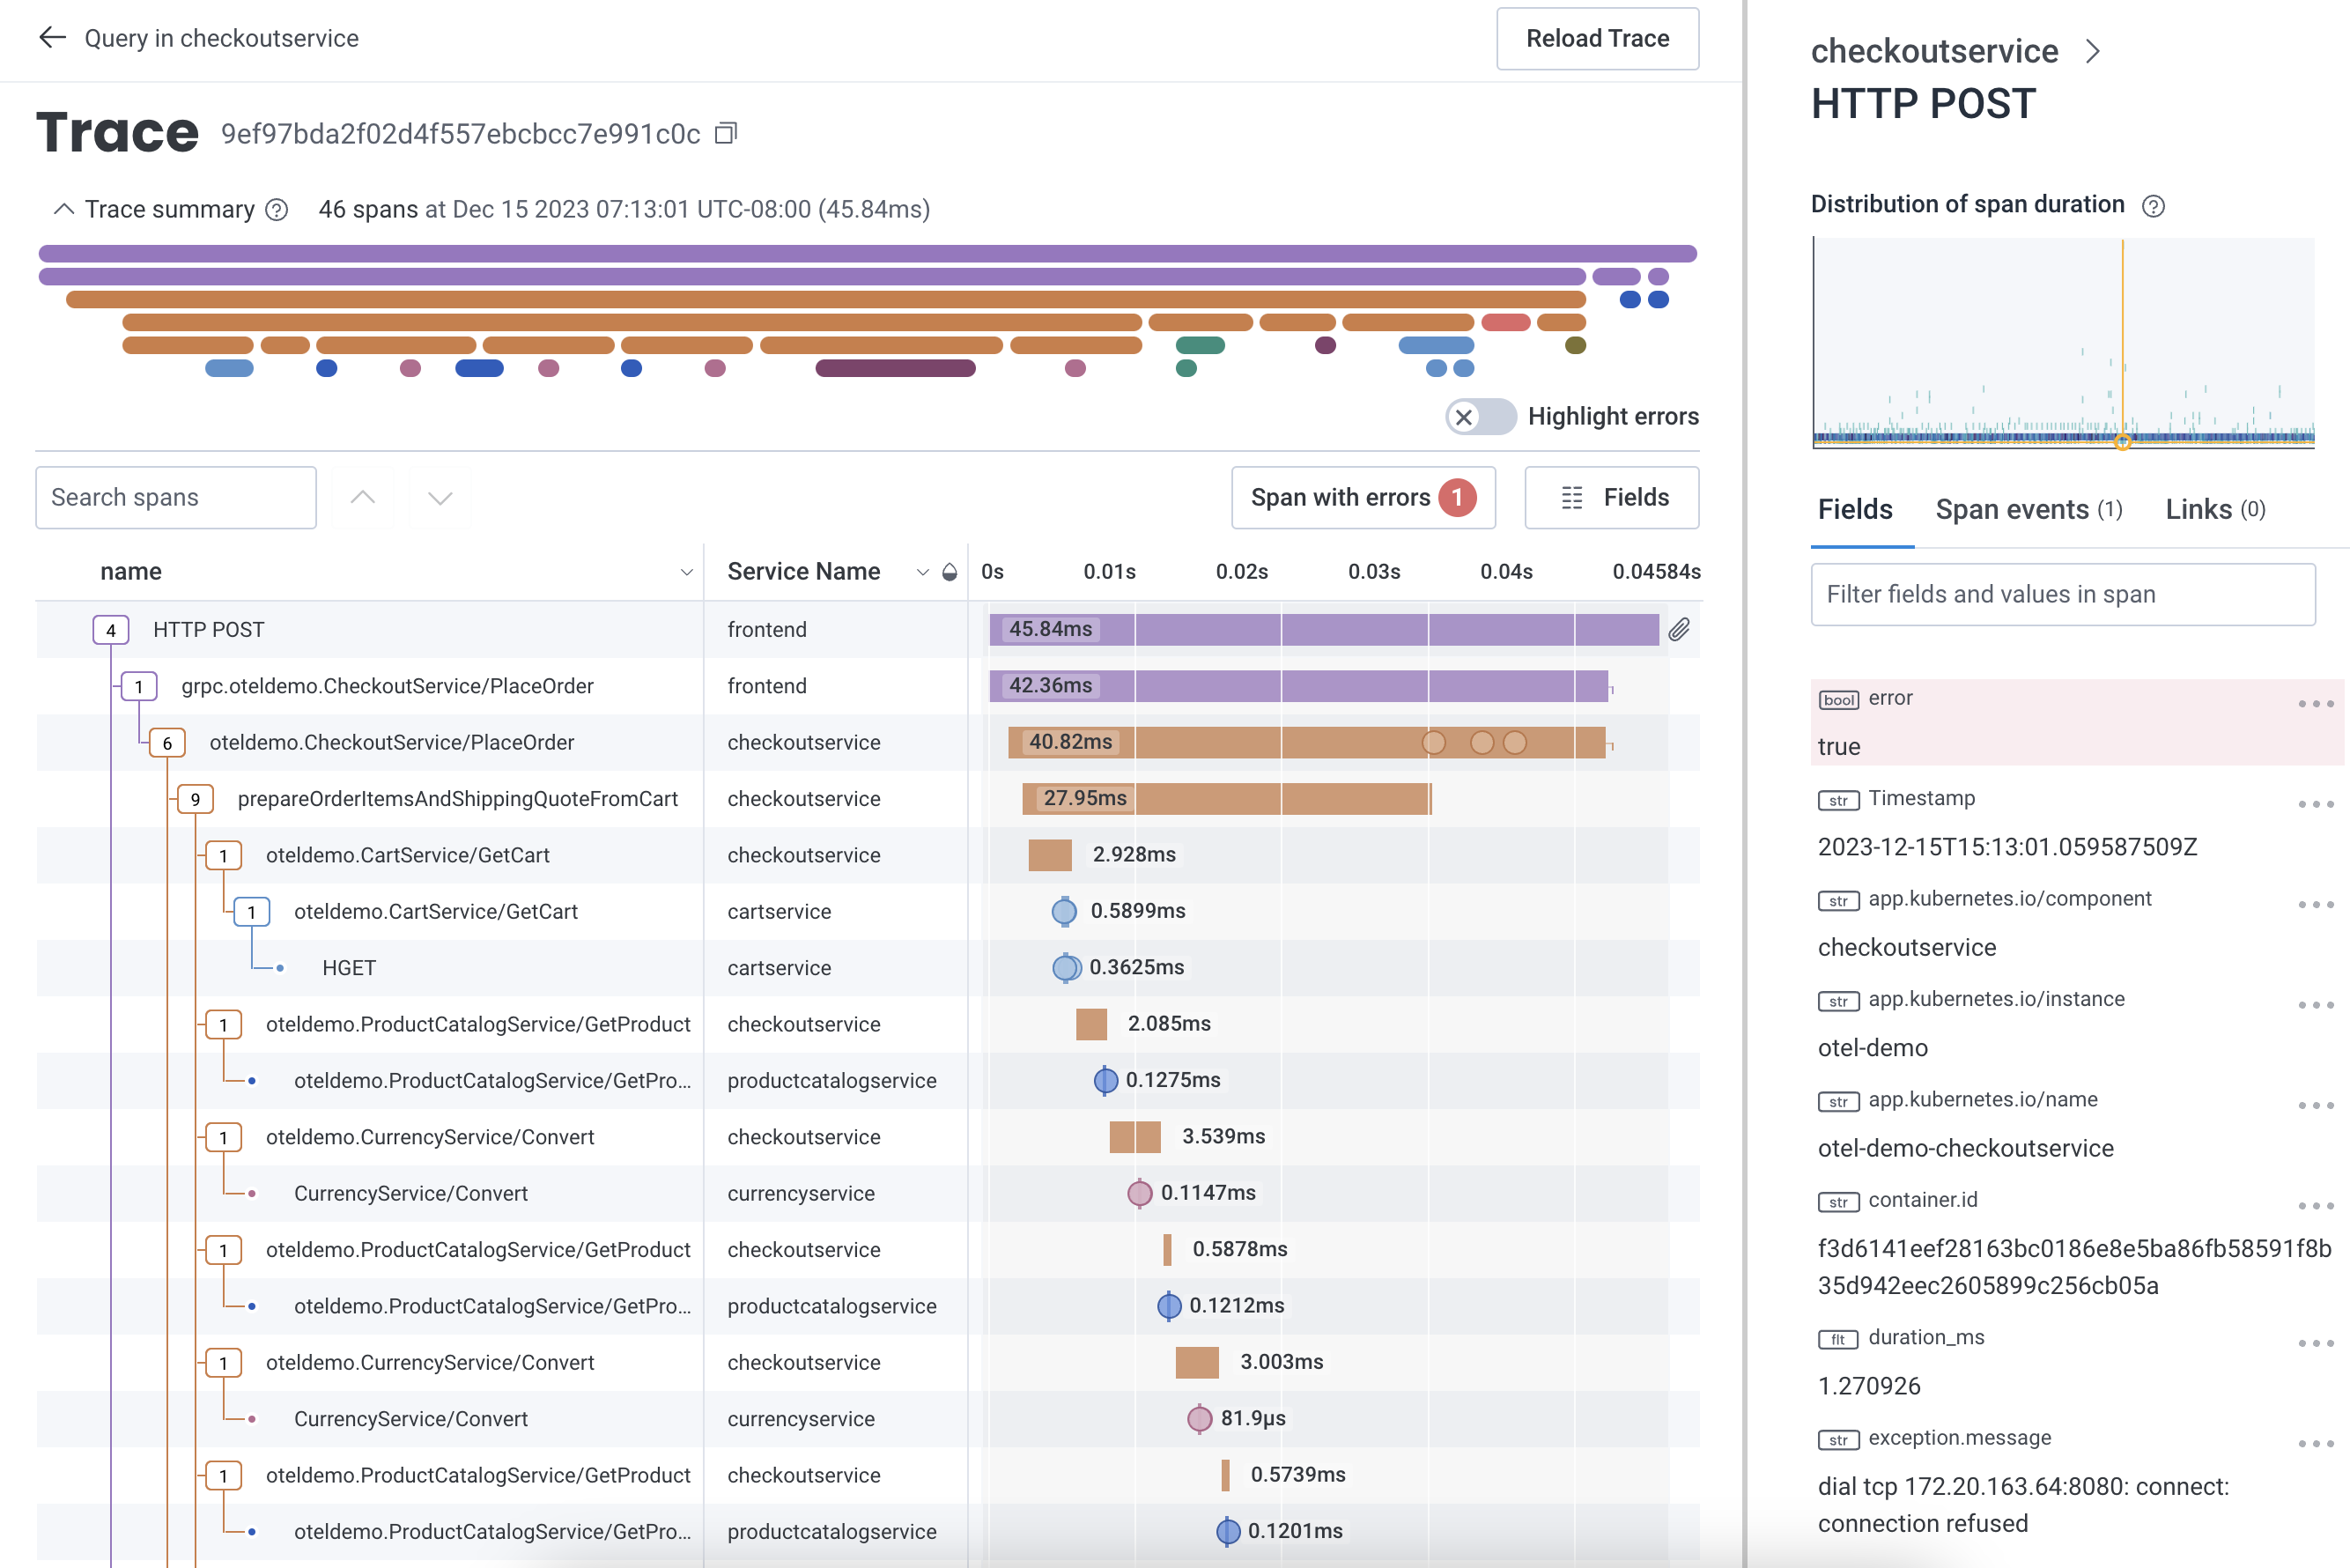 Each span contains a collection of fields and values.
The diagram displays, at a minimum, the span's relationship, its name, and a representation of its duration.
Next to each span's name shows its relationship in the trace.
A span with dependencies displays a box with the number of dependent spans.
A span without a box represents a span with no dependencies.
The currently selected span's row is highlighted in blue.
Details about the selected span appear to the right in the [trace sidebar](#trace-sidebar).
Each span contains a collection of fields and values.
The diagram displays, at a minimum, the span's relationship, its name, and a representation of its duration.
Next to each span's name shows its relationship in the trace.
A span with dependencies displays a box with the number of dependent spans.
A span without a box represents a span with no dependencies.
The currently selected span's row is highlighted in blue.
Details about the selected span appear to the right in the [trace sidebar](#trace-sidebar).
 #### Collapse and Expand Spans
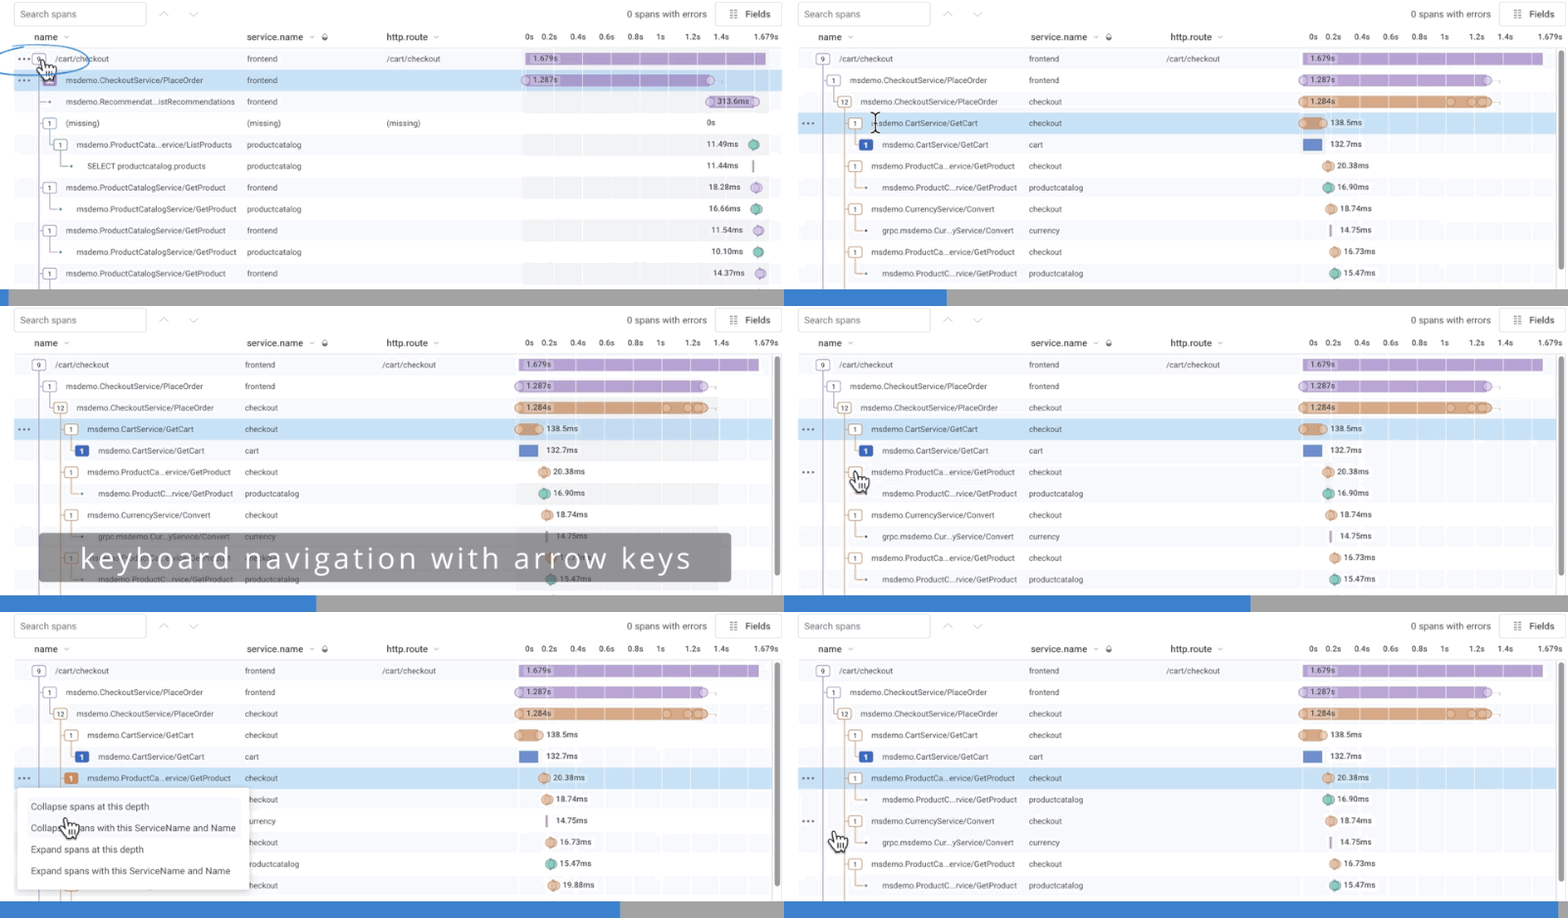
When a trace contains many spans, it can be useful to collapse spans that are not of interest, or expand specific parent spans to investigate.
Navigate the diagram with either mouse or keyboard navigation.
Select a span through mouse clicks.
For a specific parent span, collapse or expand all the dependent spans by selecting the parent span's dependent count box.
When collapsed, the count box changes from an outlined box to a filled box, and the number changes from the number of direct children to the total size of the subtree.
To collapse or expand spans in batch, select the three dots to the left of a targeted span to open its context menu.
Menu options include:
* **Collapse spans at this depth**
* **Collapse spans with this ServiceName and Name**
* **Expand spans at this depth**
* **Expand spans with this ServiceName and Name**
In a particularly large trace, it can be convenient to collapse all spans that share a name, or that are at the same level of indent.
To get a list of supported keyboard actions, type `?`.
* Navigate to each span in the diagram with the up and arrow keys.
* Collapse a span and all of its child spans with the left arrow key.
* Expand a span and all of its child spans with the right arrow key.
* Open a span's context menu by pressing `Enter`.
Menu options include:
* **Collapse spans at this depth**
* **Collapse spans with this ServiceName and Name**
* **Expand spans at this depth**
* **Expand spans with this ServiceName and Name**
In a particularly large trace, it can be convenient to collapse all spans that share a name, or that are at the same level of indent.
#### Collapse and Expand Spans
When a trace contains many spans, it can be useful to collapse spans that are not of interest, or expand specific parent spans to investigate.
Navigate the diagram with either mouse or keyboard navigation.
Select a span through mouse clicks.
For a specific parent span, collapse or expand all the dependent spans by selecting the parent span's dependent count box.
When collapsed, the count box changes from an outlined box to a filled box, and the number changes from the number of direct children to the total size of the subtree.
To collapse or expand spans in batch, select the three dots to the left of a targeted span to open its context menu.
Menu options include:
* **Collapse spans at this depth**
* **Collapse spans with this ServiceName and Name**
* **Expand spans at this depth**
* **Expand spans with this ServiceName and Name**
In a particularly large trace, it can be convenient to collapse all spans that share a name, or that are at the same level of indent.
To get a list of supported keyboard actions, type `?`.
* Navigate to each span in the diagram with the up and arrow keys.
* Collapse a span and all of its child spans with the left arrow key.
* Expand a span and all of its child spans with the right arrow key.
* Open a span's context menu by pressing `Enter`.
Menu options include:
* **Collapse spans at this depth**
* **Collapse spans with this ServiceName and Name**
* **Expand spans at this depth**
* **Expand spans with this ServiceName and Name**
In a particularly large trace, it can be convenient to collapse all spans that share a name, or that are at the same level of indent.
 ### Zoom In and Share Subtrees in the Waterfall
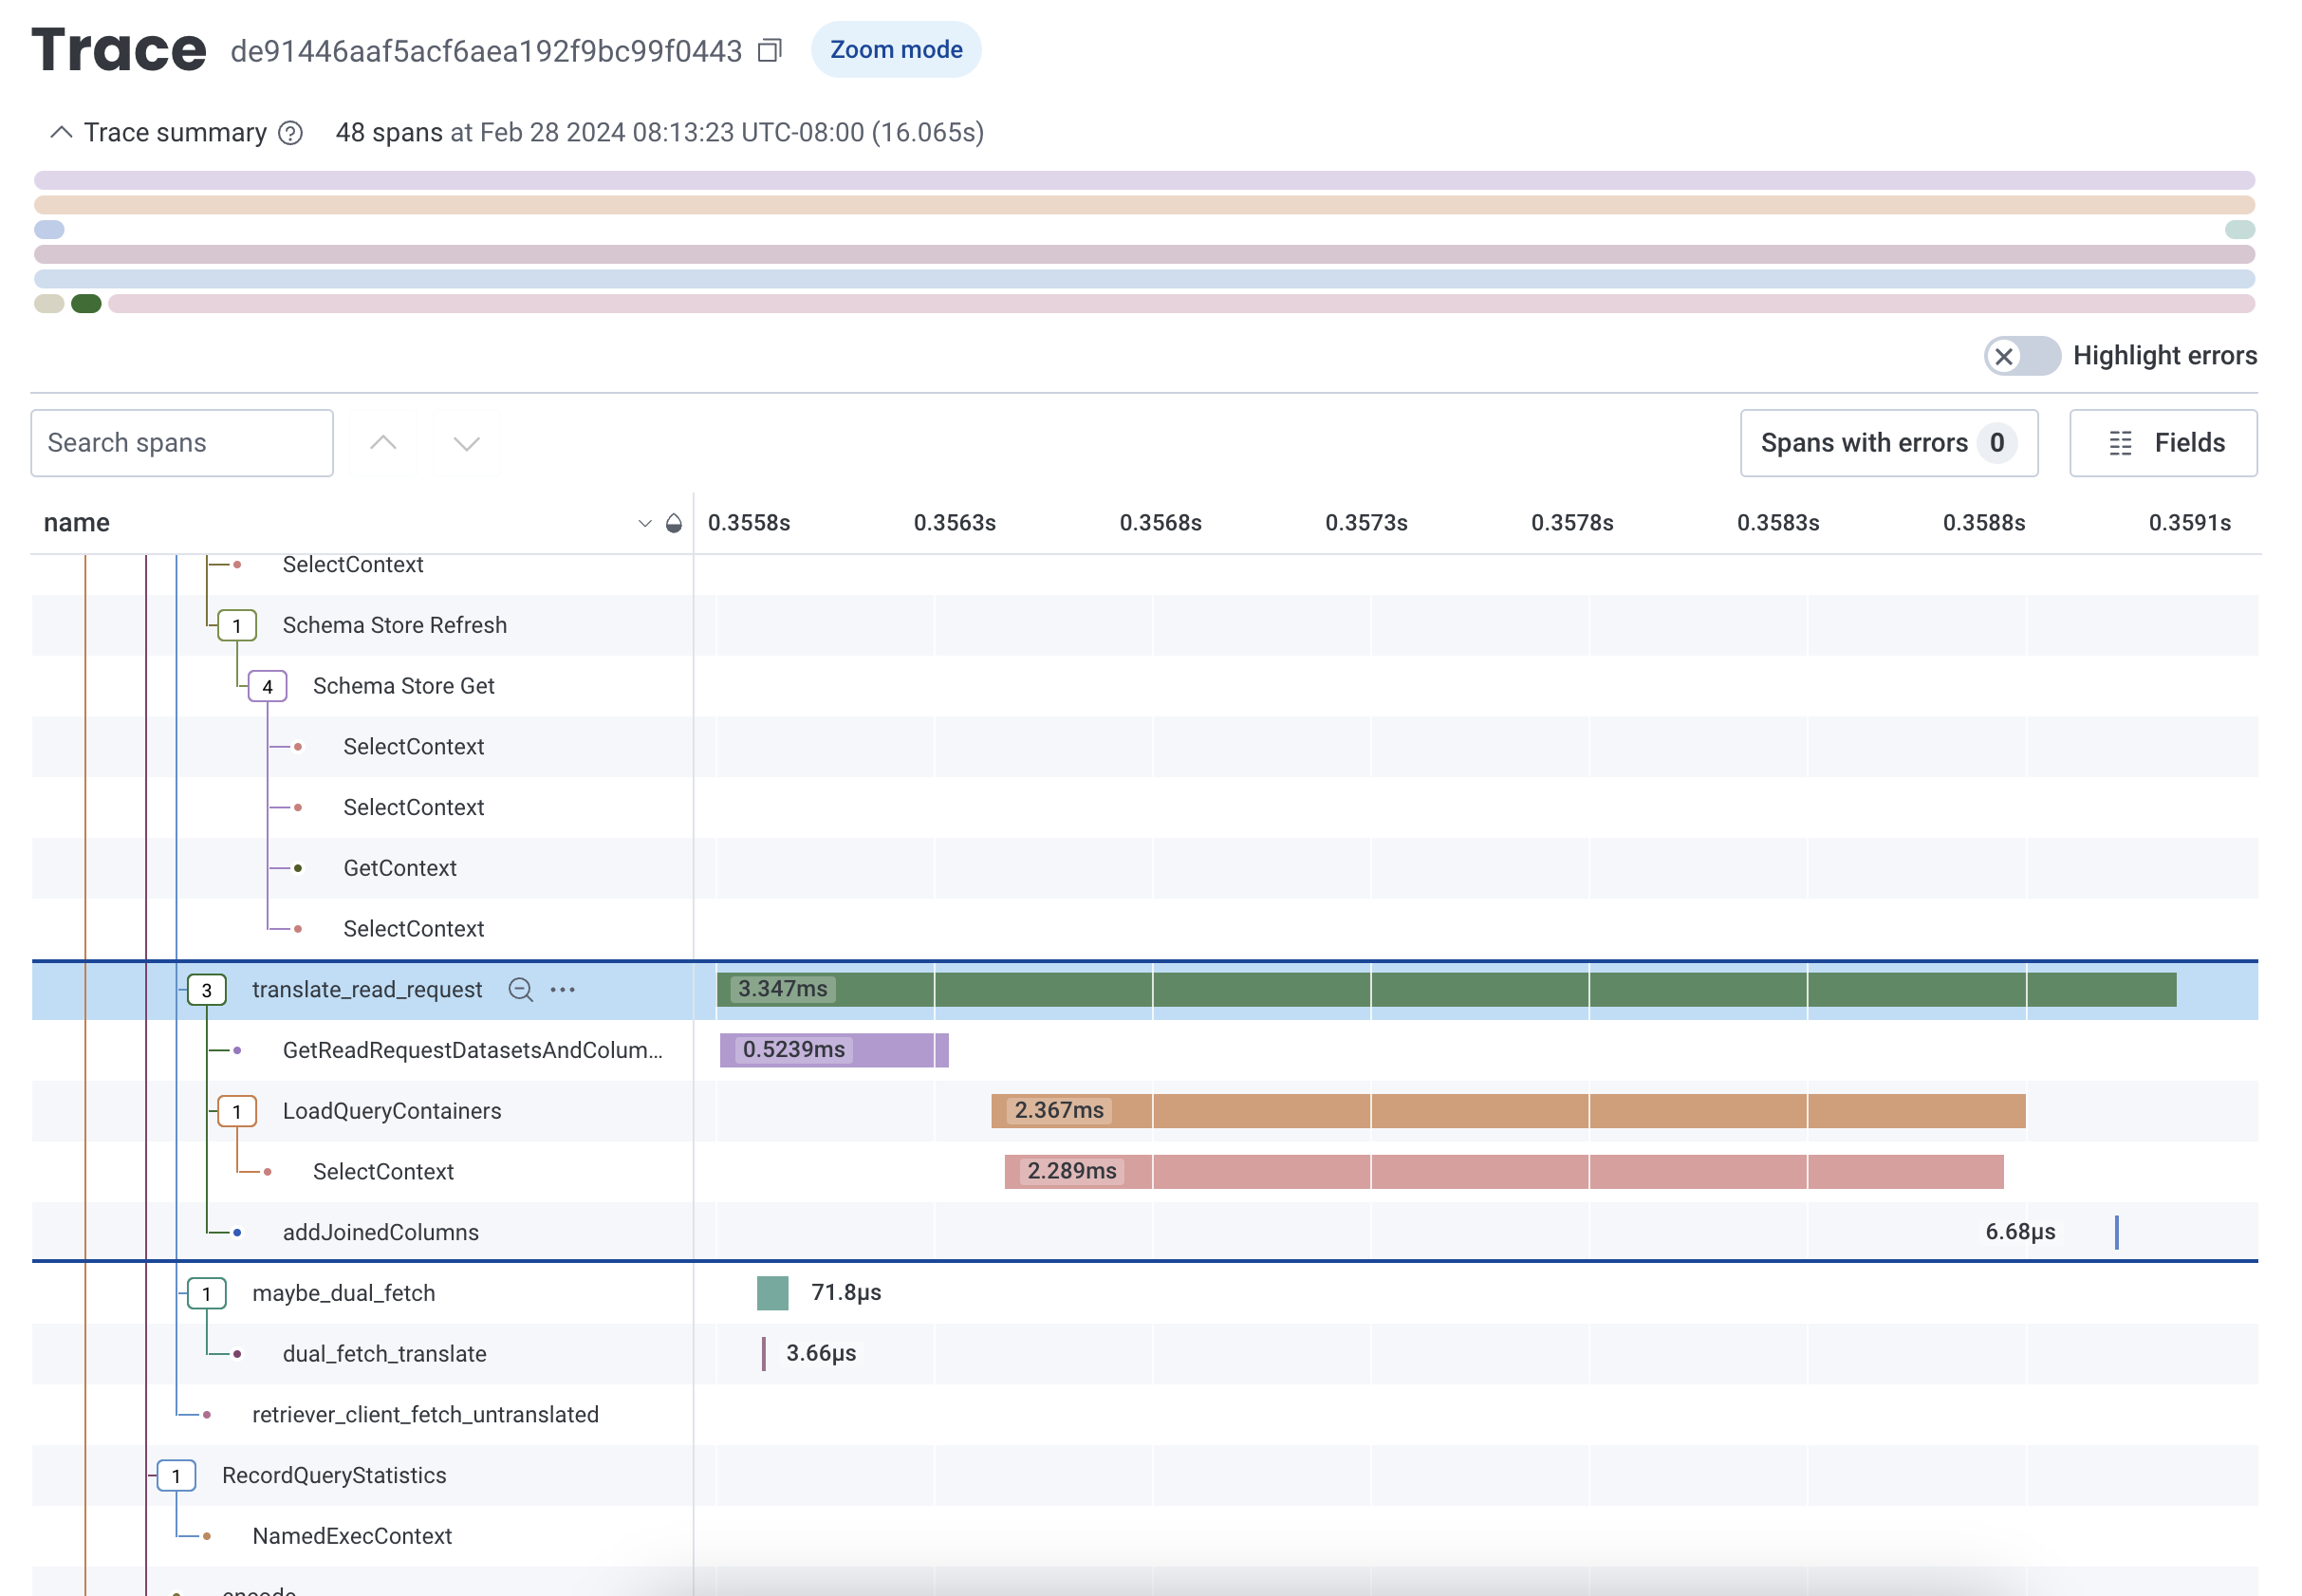
To zoom into a subtree within the trace waterfall view, select the Zoom In icon () next to any parent span.
The timeline re-adjusts to that parent span's duration, and shows the duration of all children spans relative to that parent span, as opposed to the whole trace.
The trace summary view also highlights which span is being examined in zoom mode.
Zoom out of the subtree by selecting the Zoom Out icon ().
Permalinks for subtrees in zoom mode exist.
Copy the URL link in your web browser and share the URL with other users to view the same subtree.
### Zoom In and Share Subtrees in the Waterfall
To zoom into a subtree within the trace waterfall view, select the Zoom In icon () next to any parent span.
The timeline re-adjusts to that parent span's duration, and shows the duration of all children spans relative to that parent span, as opposed to the whole trace.
The trace summary view also highlights which span is being examined in zoom mode.
Zoom out of the subtree by selecting the Zoom Out icon ().
Permalinks for subtrees in zoom mode exist.
Copy the URL link in your web browser and share the URL with other users to view the same subtree.
 ### Customize Waterfall Representation
The [search field](#search-spans) provides the ability to type in a field or value and highlights spans that contain your search term.
[Error Highlighting](#error-highlighting) shows how many spans with errors exists in the trace.
The **Fields** button [customizes the fields in the waterfall representation](#customize-fields-in-waterfall-representation).
### Search Spans
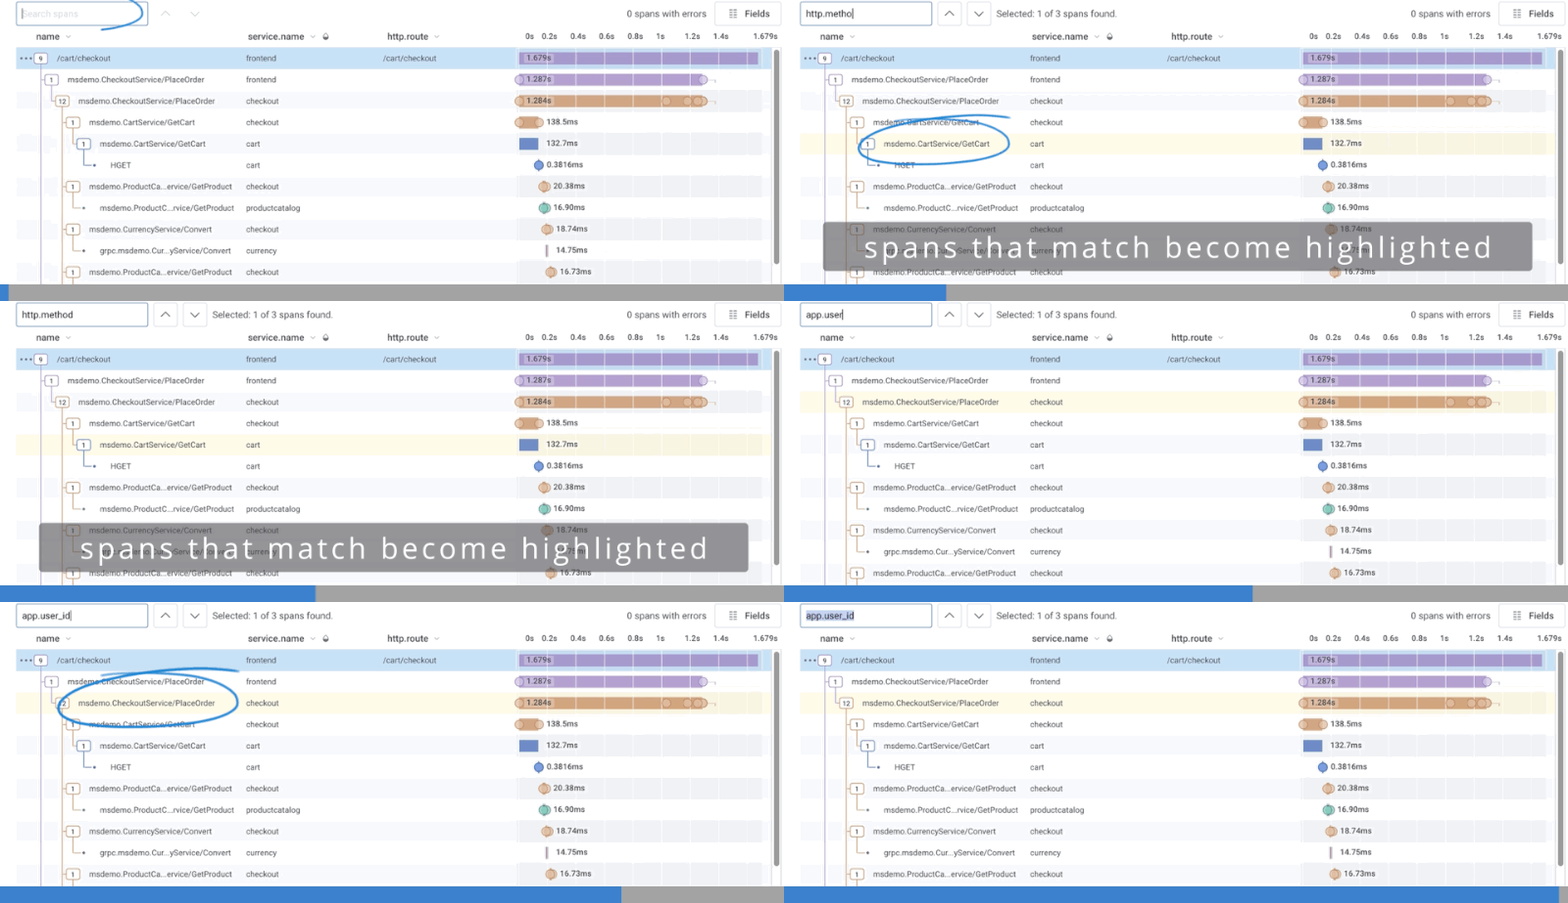
To search spans, use the search box to type in the field or value you want to find.
As you type, the display changes and highlights any spans that contain your search term.
A count of matching spans found appears next to the search box and navigation arrows.
Use the navigation arrows to move between the spans that match the search term.
### Customize Waterfall Representation
The [search field](#search-spans) provides the ability to type in a field or value and highlights spans that contain your search term.
[Error Highlighting](#error-highlighting) shows how many spans with errors exists in the trace.
The **Fields** button [customizes the fields in the waterfall representation](#customize-fields-in-waterfall-representation).
### Search Spans
To search spans, use the search box to type in the field or value you want to find.
As you type, the display changes and highlights any spans that contain your search term.
A count of matching spans found appears next to the search box and navigation arrows.
Use the navigation arrows to move between the spans that match the search term.
 ### Error Highlighting
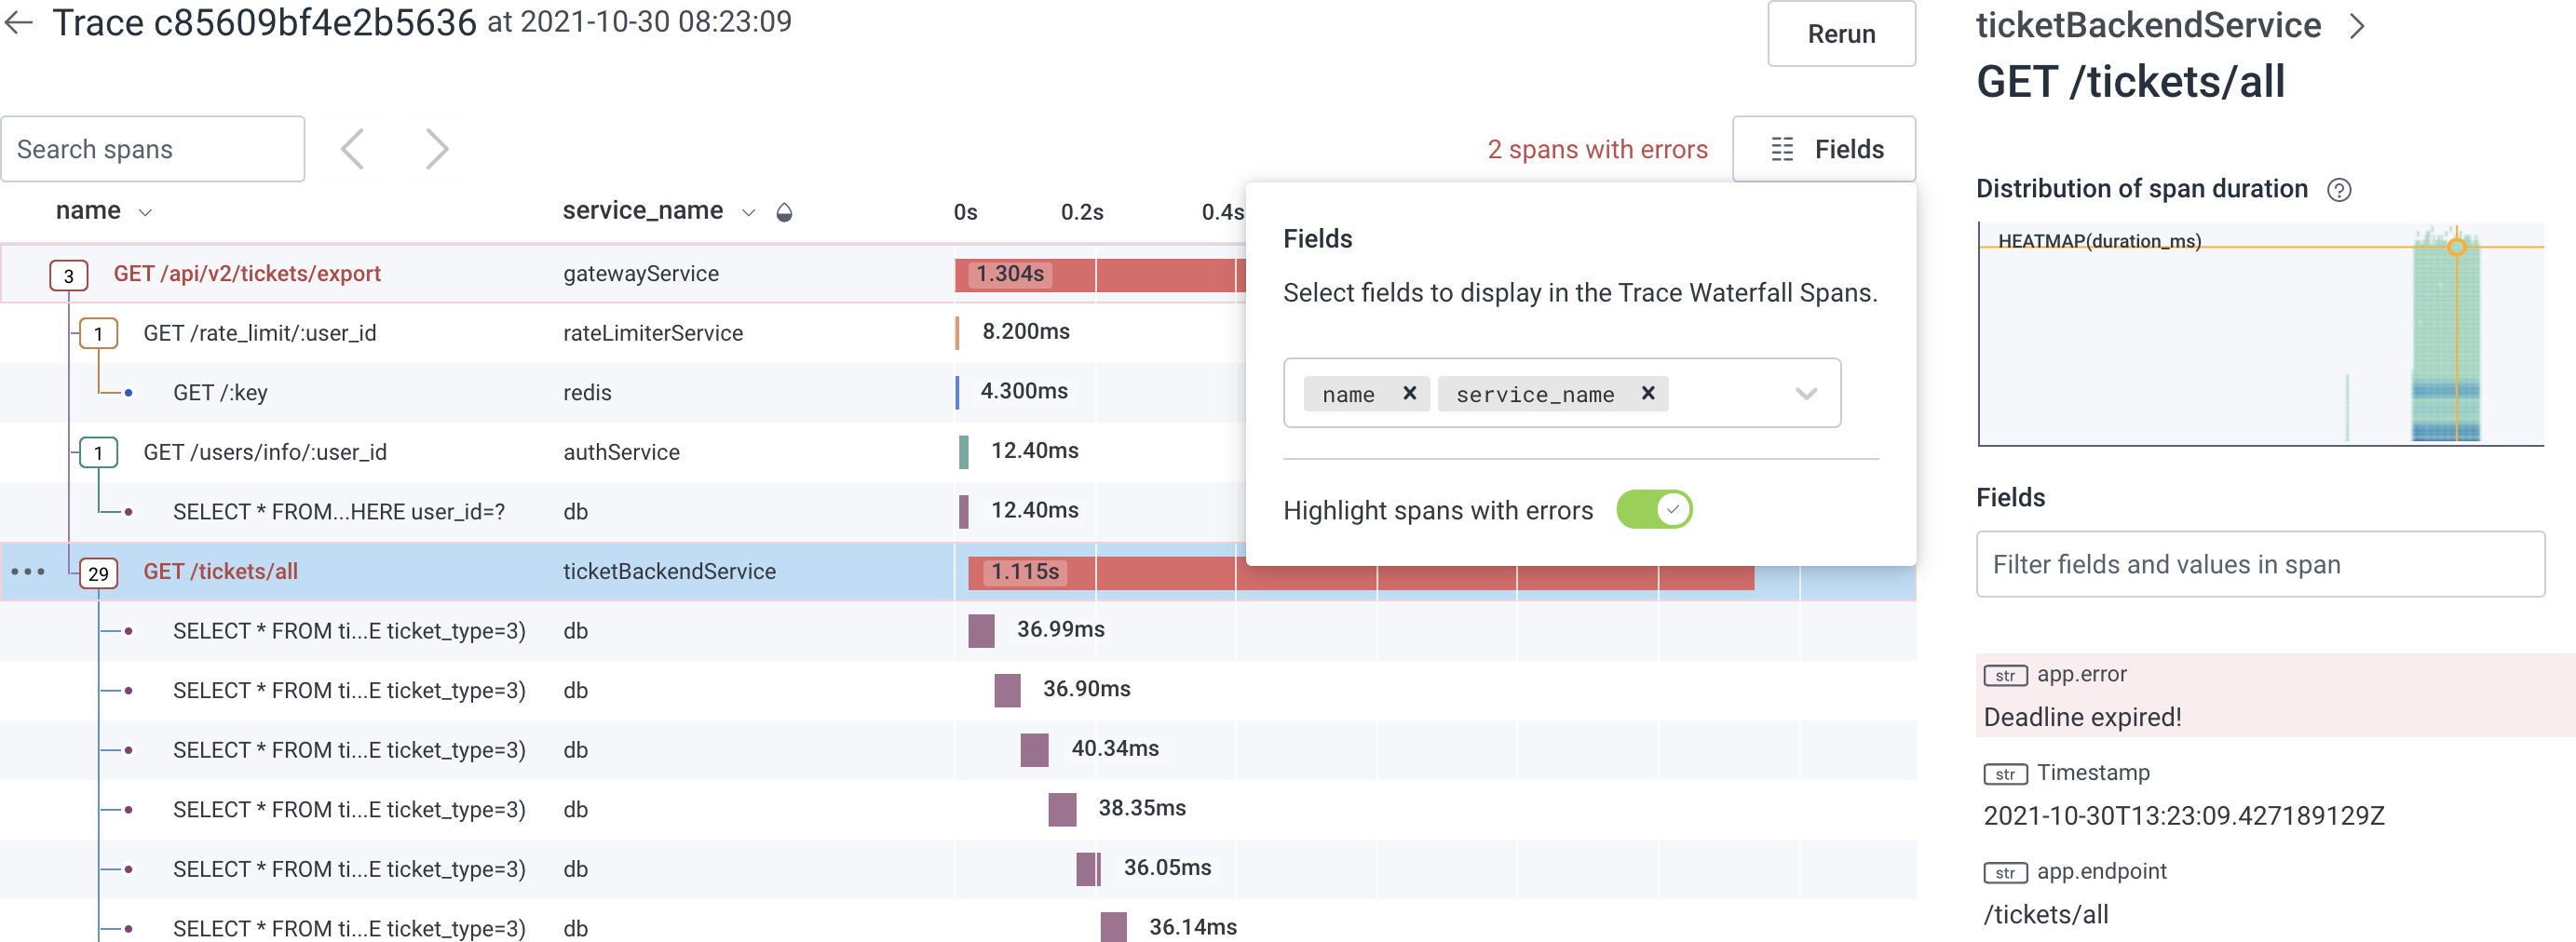
The count of spans containing errors is displayed above the trace waterfall.
Select this count of spans to navigate between the spans with errors.
By default, spans that contain errors are displayed in red.
The error field is also highlighted at the top of the field list in the [trace sidebar](#trace-sidebar).
Span error detection is based on the Error field as configured in the [Dataset Definition](/configure/datasets/definitions/).
### Error Highlighting
The count of spans containing errors is displayed above the trace waterfall.
Select this count of spans to navigate between the spans with errors.
By default, spans that contain errors are displayed in red.
The error field is also highlighted at the top of the field list in the [trace sidebar](#trace-sidebar).
Span error detection is based on the Error field as configured in the [Dataset Definition](/configure/datasets/definitions/).
 ### Customize Fields in Waterfall Representation
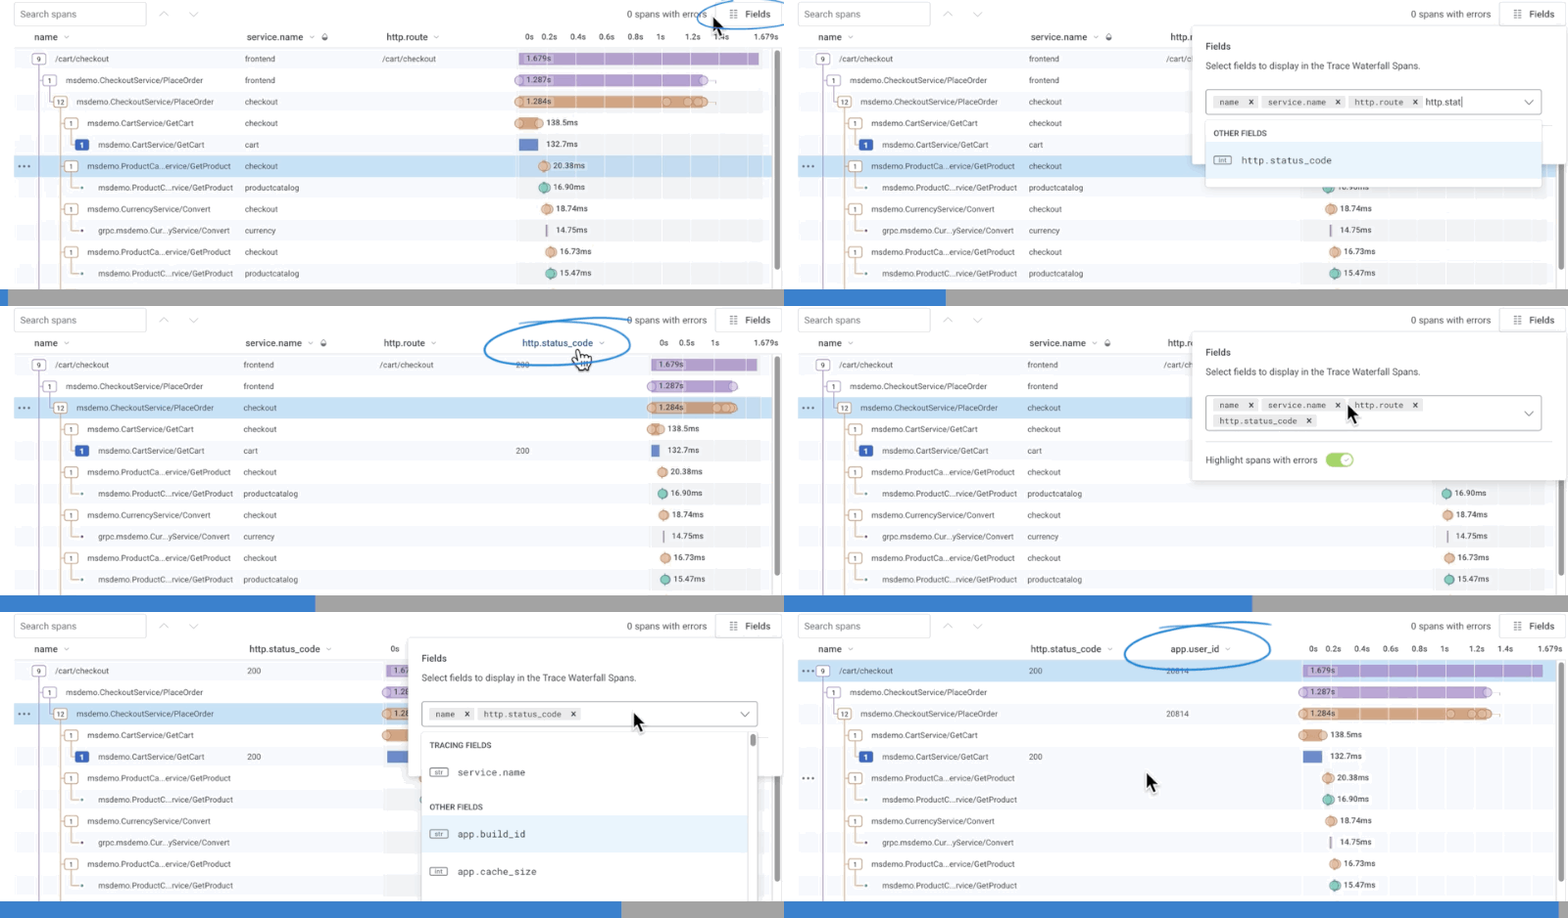
To add a field to the waterfall representation, use the **Fields** button in the upper right corner and type in the target field name.
A list of suggested fields appears based on your input.
To update the waterfall representation, complete typing the field name and press `Enter`, or select the target field name from the list of suggested fields.
The waterfall representation updates with a new column labeled with the field name and its information.
To remove fields in the span display, use the **Fields** button to display the current fields.
Use the **x** to right of each field name to remove it.
The display updates after any change.
### Customize Fields in Waterfall Representation
To add a field to the waterfall representation, use the **Fields** button in the upper right corner and type in the target field name.
A list of suggested fields appears based on your input.
To update the waterfall representation, complete typing the field name and press `Enter`, or select the target field name from the list of suggested fields.
The waterfall representation updates with a new column labeled with the field name and its information.
To remove fields in the span display, use the **Fields** button to display the current fields.
Use the **x** to right of each field name to remove it.
The display updates after any change.
 ### Resize Columns in Waterfall Representation
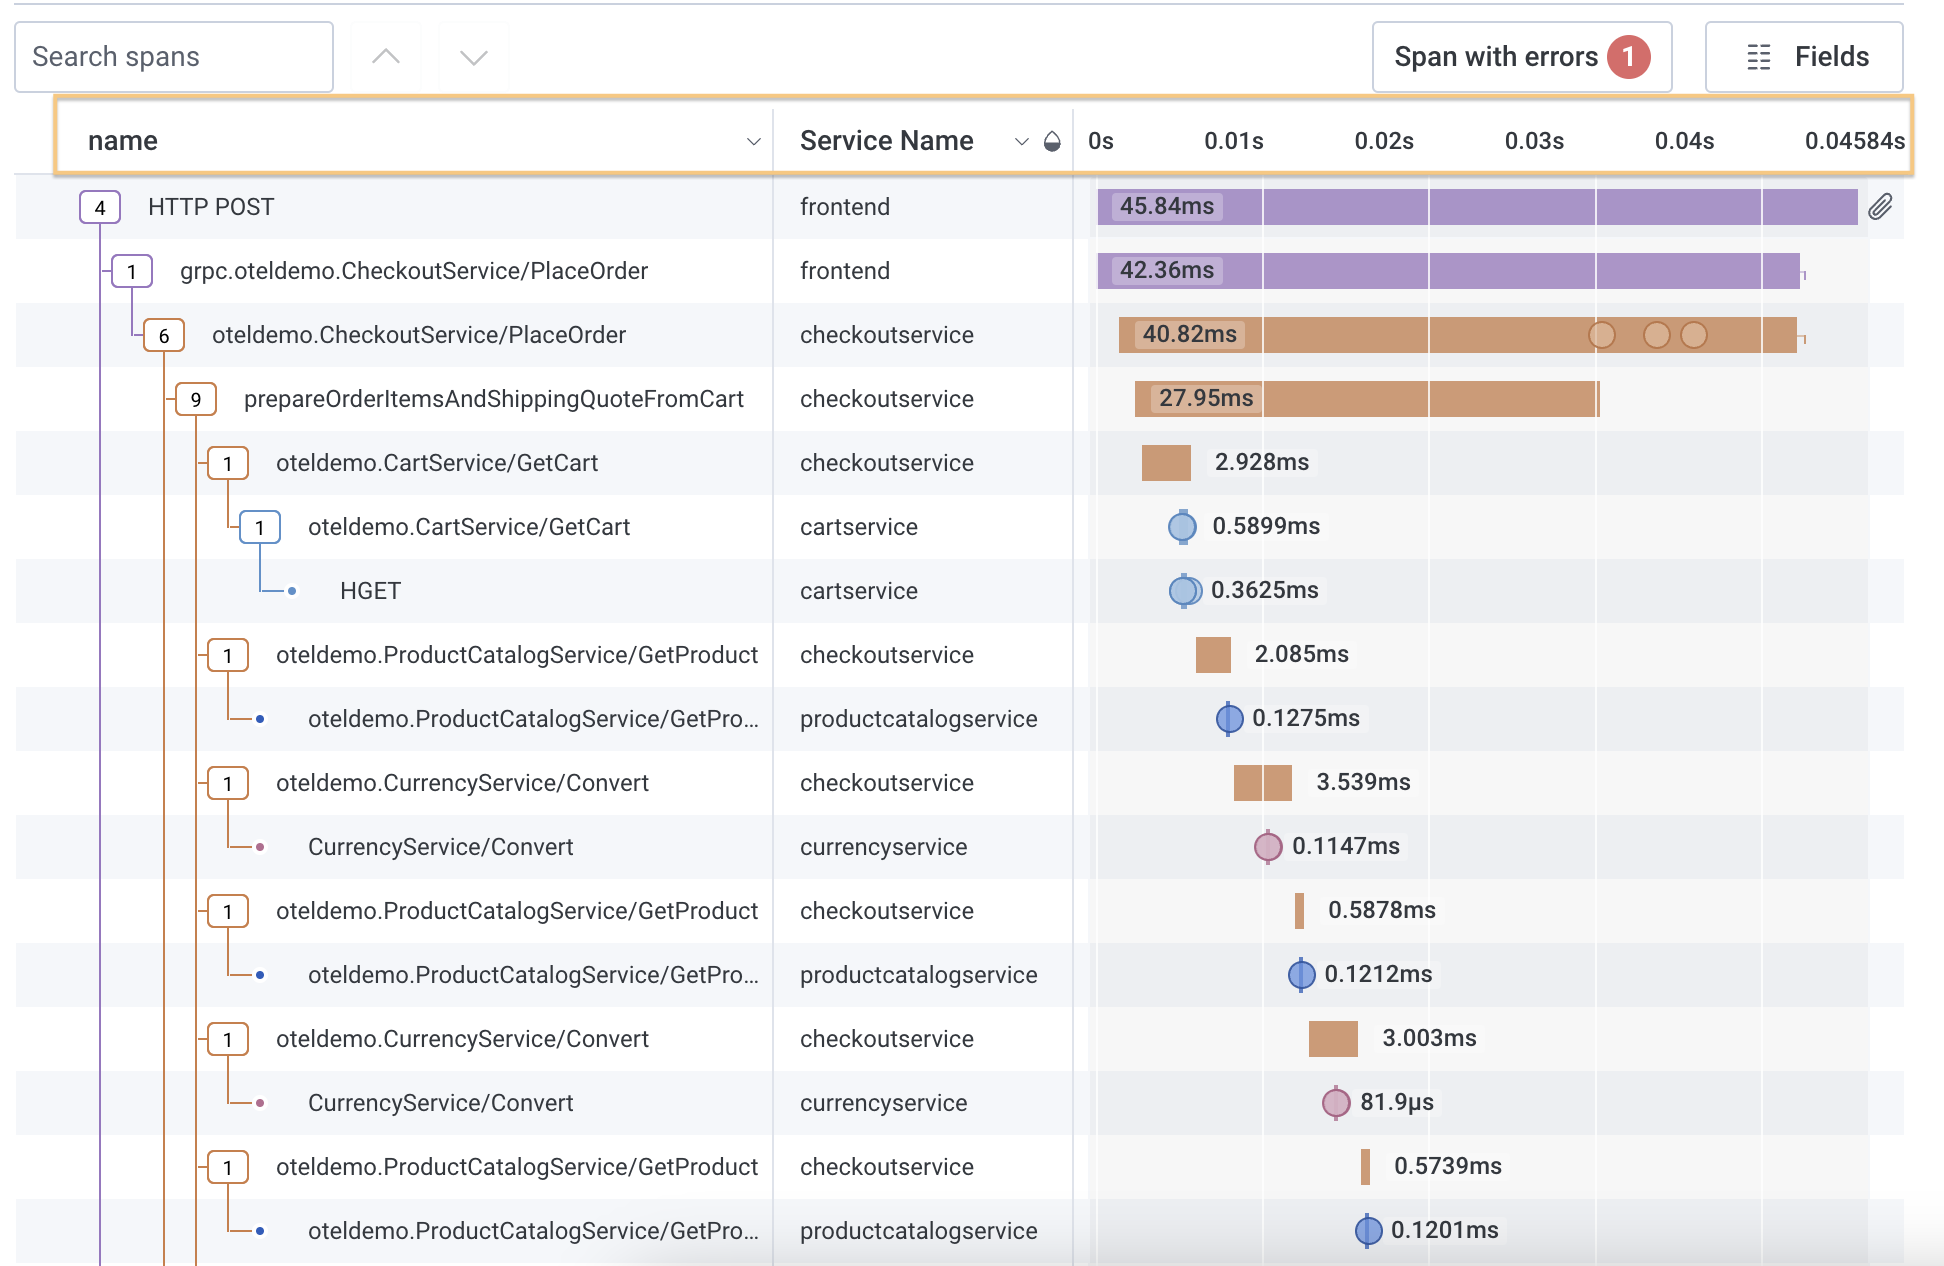
To resize columns in the waterfall representation, drag the gray borders that separate column names to your desired width.
A set minimum width exists for each column.
To remove a column completely, use the **Fields** button.
### Resize Columns in Waterfall Representation
To resize columns in the waterfall representation, drag the gray borders that separate column names to your desired width.
A set minimum width exists for each column.
To remove a column completely, use the **Fields** button.
 ### Change Color in Waterfall Representation
The color for each span applies to its entire row, such as the count box, relationship tracing, and duration representation.
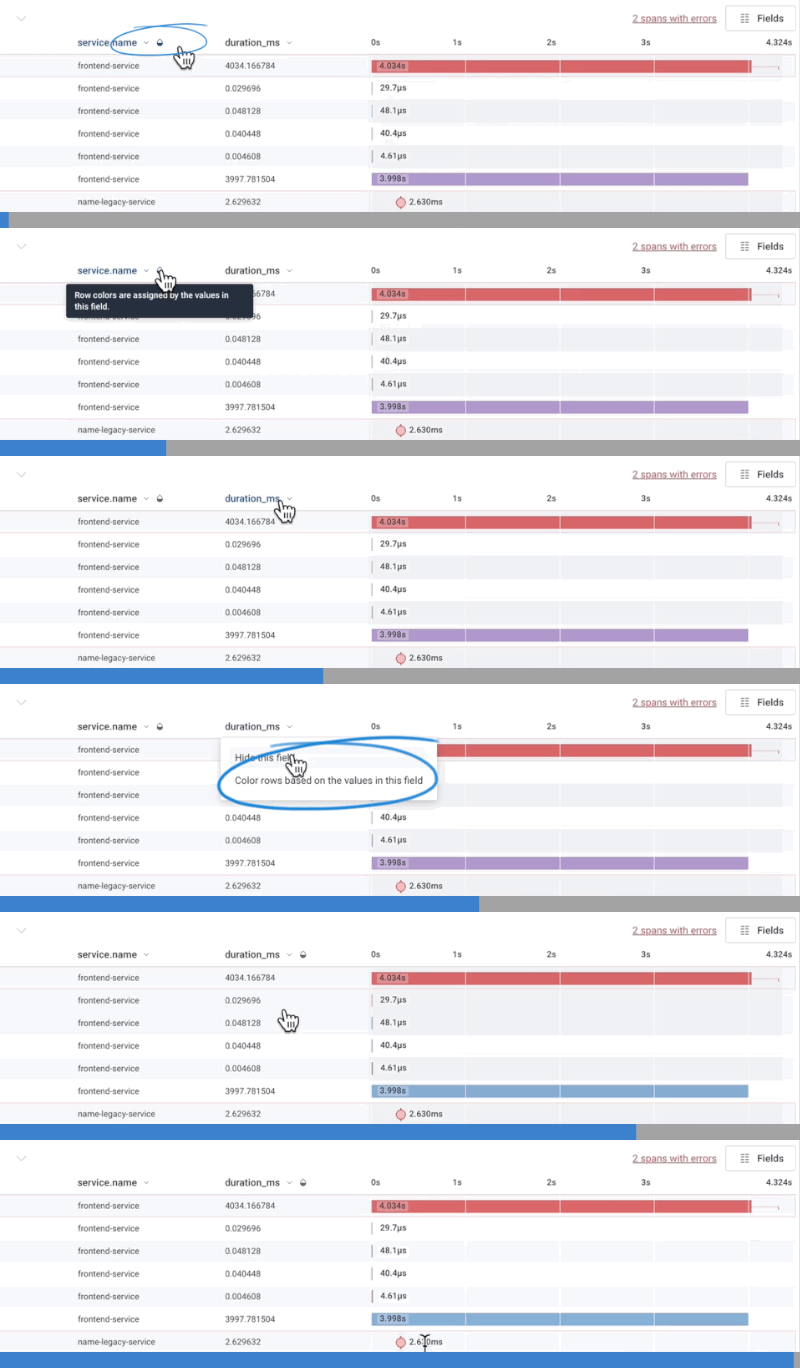
By default, the color is determined by `service.name` if there is more than one service name defined; otherwise, they are colored by `name`.
A half-filled water drop () appears next to the column header of the determining field.
Each distinct value in the determining field gets its own color.
Changing the determining field colors the waterfall display differently and may emphasize different attributes.
To change the determining field, select the target field's column header.
In the menu that appears, select **Color rows based on the values in this field**.
The display refreshes with the new color scheme, and the water drop icon () appears next to the selected field's column header.
### Change Color in Waterfall Representation
The color for each span applies to its entire row, such as the count box, relationship tracing, and duration representation.
By default, the color is determined by `service.name` if there is more than one service name defined; otherwise, they are colored by `name`.
A half-filled water drop () appears next to the column header of the determining field.
Each distinct value in the determining field gets its own color.
Changing the determining field colors the waterfall display differently and may emphasize different attributes.
To change the determining field, select the target field's column header.
In the menu that appears, select **Color rows based on the values in this field**.
The display refreshes with the new color scheme, and the water drop icon () appears next to the selected field's column header.
 ### Trace Sidebar
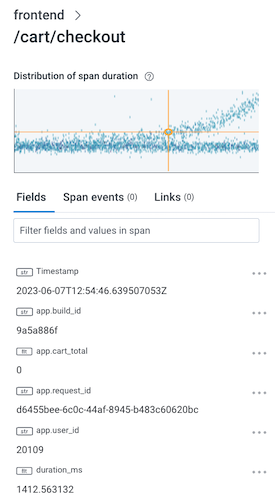
When a span is selected, the trace sidebar updates with details about the span, including its fields, span events, and links.
The Span Events tab of the trace sidebar displays details about span events, if applicable.
To access, navigate to the Span Events tab and select the Span Event name to show its details.
Alternatively, in the waterfall diagram, select the circle that represents a span event to display the span event's details in the trace sidebar's Span Events tab.
The Links tab of the trace sidebar displays details about span links, if applicable.
To access, navigate to the Links tab to view span link details.
Alternatively, in the waterfall diagram, select the link icon () that represents a span link to display details in the trace sidebar's Links tab.
### Trace Sidebar
When a span is selected, the trace sidebar updates with details about the span, including its fields, span events, and links.
The Span Events tab of the trace sidebar displays details about span events, if applicable.
To access, navigate to the Span Events tab and select the Span Event name to show its details.
Alternatively, in the waterfall diagram, select the circle that represents a span event to display the span event's details in the trace sidebar's Span Events tab.
The Links tab of the trace sidebar displays details about span links, if applicable.
To access, navigate to the Links tab to view span link details.
Alternatively, in the waterfall diagram, select the link icon () that represents a span link to display details in the trace sidebar's Links tab.
 #### The Minigraph
The minigraph, at the top of the trace sidebar, shows a heatmap view of the selected span relative to others with the same fields displayed in the waterfall.
Selecting anywhere in the minigraph sends you to the Query Builder display with a query that corresponds to the minigraph.
#### Trace Sidebar Filter
The trace sidebar includes a filter.
Enter terms into this sidebar filter and the sidebar display refreshes to show matching fields and/or values.
This filter remains in the trace sidebar as you select different spans.
Use this behavior to track a particular field as you move between a set of spans.
#### Refine and Return to The Query Builder
Any span's field or value can act as an entry point back to the Query Builder.
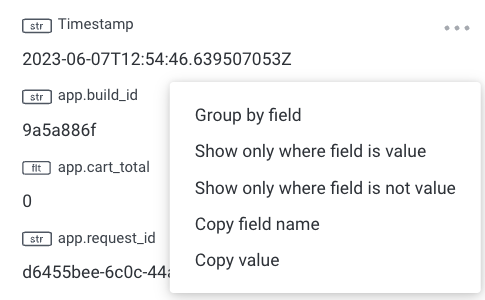
In the Trace Sidebar, select the three dots to the right of a targeted field to open its context menu.
In addition to copy options, the menu includes **GROUP BY** and **WHERE** actions, which create a new query that re-uses the original query but adds the selected clause and field.
#### The Minigraph
The minigraph, at the top of the trace sidebar, shows a heatmap view of the selected span relative to others with the same fields displayed in the waterfall.
Selecting anywhere in the minigraph sends you to the Query Builder display with a query that corresponds to the minigraph.
#### Trace Sidebar Filter
The trace sidebar includes a filter.
Enter terms into this sidebar filter and the sidebar display refreshes to show matching fields and/or values.
This filter remains in the trace sidebar as you select different spans.
Use this behavior to track a particular field as you move between a set of spans.
#### Refine and Return to The Query Builder
Any span's field or value can act as an entry point back to the Query Builder.
In the Trace Sidebar, select the three dots to the right of a targeted field to open its context menu.
In addition to copy options, the menu includes **GROUP BY** and **WHERE** actions, which create a new query that re-uses the original query but adds the selected clause and field.
 The new query may not return results.
If the fields you select are only found on child spans, but the original query includes `trace.parent_id does-not-exist` or `is_root`, then the new query will be self-contradictory, and will not return any results.
Remove any unneeded clauses to get a full result.
### Gen AI tab
When investigating traces from a generative AI agent or application, the trace sidebar includes a dedicated Gen AI tab that surfaces AI-specific context alongside the standard Fields, Span Events, and Links tabs.
In the Gen AI tab you can see what messages were exchanged, what model was used, how many tokens were consumed, and if response quality evaluations passed without manually scanning raw span fields.
#### When the Gen AI tab appears
The Gen AI tab appears in the trace sidebar when the selected span includes a `gen_ai.operation.name` attribute. This attribute is defined by the [OpenTelemetry Generative AI semantic conventions](https://opentelemetry.io/docs/specs/semconv/gen-ai/gen-ai-agent-spans/) and identifies the span as a GenAI operation.
If a span does not include `gen_ai.operation.name`, the Gen AI tab will not appear for that span.
#### What appears in the Gen AI tab
When the Gen AI tab is active, Honeycomb renders the contents of GenAI-specific span fields in a structured, human-readable format. Messages such as user inputs, assistant responses, and tool call results render as formatted markdown when possible, making long or structured outputs easier to read.
Gen AI fields also appear in the waterfall representation, so you can see key metadata like model name alongside the span's duration and hierarchy at a glance.
#### Viewing evaluation results
Evaluation results can be viewed either on the Gen AI tab or on the Span Events tab, depending on your instrumentation.
If your instrumentation attaches `gen_ai.evaluation.result` events to a span, those evaluation results appear in the Span Events tab of the sidebar.
To view evaluation events on the Gen AI tab, they must be attached to a GenAI span that has `gen_ai.operation.name` set. From the Gen AI tab, select the `gen_ai.evaluation.result` event name to expand its details. You can also find them in the Span Events tab.
#### Instrumenting your AI application
To enable the Gen AI tab, your instrumentation must emit spans that follow the [OTel GenAI semantic conventions](https://opentelemetry.io/docs/specs/semconv/gen-ai/gen-ai-agent-spans/). Honeycomb recommends that each GenAI span includes:
* `gen_ai.operation.name`: triggers the Gen AI tab in the trace view (required by Honeycomb)
To populate the message view in the Gen AI tab, include the opt-in attributes:
* `gen_ai.input.messages`: the chat history sent to the model
* `gen_ai.output.messages`: the model's response
To surface token usage in the waterfall and sidebar, include:
* `gen_ai.usage.input_tokens`
* `gen_ai.usage.output_tokens`
To enable evaluation results in the Span Events tab, attach `gen_ai.evaluation.result` span events to a GenAI operation span, following the [OTel GenAI events spec](https://opentelemetry.io/docs/specs/semconv/gen-ai/gen-ai-events/#event-gen_aievaluationresult).
## Example: Slow API Calls
Here is an example of investigating a problem using tracing:
A few users are reporting slow API calls.
The initial investigation shows one endpoint is periodically slow.
One user is making a lot of calls, and that is slowing down responses for everyone.
The new query may not return results.
If the fields you select are only found on child spans, but the original query includes `trace.parent_id does-not-exist` or `is_root`, then the new query will be self-contradictory, and will not return any results.
Remove any unneeded clauses to get a full result.
### Gen AI tab
When investigating traces from a generative AI agent or application, the trace sidebar includes a dedicated Gen AI tab that surfaces AI-specific context alongside the standard Fields, Span Events, and Links tabs.
In the Gen AI tab you can see what messages were exchanged, what model was used, how many tokens were consumed, and if response quality evaluations passed without manually scanning raw span fields.
#### When the Gen AI tab appears
The Gen AI tab appears in the trace sidebar when the selected span includes a `gen_ai.operation.name` attribute. This attribute is defined by the [OpenTelemetry Generative AI semantic conventions](https://opentelemetry.io/docs/specs/semconv/gen-ai/gen-ai-agent-spans/) and identifies the span as a GenAI operation.
If a span does not include `gen_ai.operation.name`, the Gen AI tab will not appear for that span.
#### What appears in the Gen AI tab
When the Gen AI tab is active, Honeycomb renders the contents of GenAI-specific span fields in a structured, human-readable format. Messages such as user inputs, assistant responses, and tool call results render as formatted markdown when possible, making long or structured outputs easier to read.
Gen AI fields also appear in the waterfall representation, so you can see key metadata like model name alongside the span's duration and hierarchy at a glance.
#### Viewing evaluation results
Evaluation results can be viewed either on the Gen AI tab or on the Span Events tab, depending on your instrumentation.
If your instrumentation attaches `gen_ai.evaluation.result` events to a span, those evaluation results appear in the Span Events tab of the sidebar.
To view evaluation events on the Gen AI tab, they must be attached to a GenAI span that has `gen_ai.operation.name` set. From the Gen AI tab, select the `gen_ai.evaluation.result` event name to expand its details. You can also find them in the Span Events tab.
#### Instrumenting your AI application
To enable the Gen AI tab, your instrumentation must emit spans that follow the [OTel GenAI semantic conventions](https://opentelemetry.io/docs/specs/semconv/gen-ai/gen-ai-agent-spans/). Honeycomb recommends that each GenAI span includes:
* `gen_ai.operation.name`: triggers the Gen AI tab in the trace view (required by Honeycomb)
To populate the message view in the Gen AI tab, include the opt-in attributes:
* `gen_ai.input.messages`: the chat history sent to the model
* `gen_ai.output.messages`: the model's response
To surface token usage in the waterfall and sidebar, include:
* `gen_ai.usage.input_tokens`
* `gen_ai.usage.output_tokens`
To enable evaluation results in the Span Events tab, attach `gen_ai.evaluation.result` span events to a GenAI operation span, following the [OTel GenAI events spec](https://opentelemetry.io/docs/specs/semconv/gen-ai/gen-ai-events/#event-gen_aievaluationresult).
## Example: Slow API Calls
Here is an example of investigating a problem using tracing:
A few users are reporting slow API calls.
The initial investigation shows one endpoint is periodically slow.
One user is making a lot of calls, and that is slowing down responses for everyone.
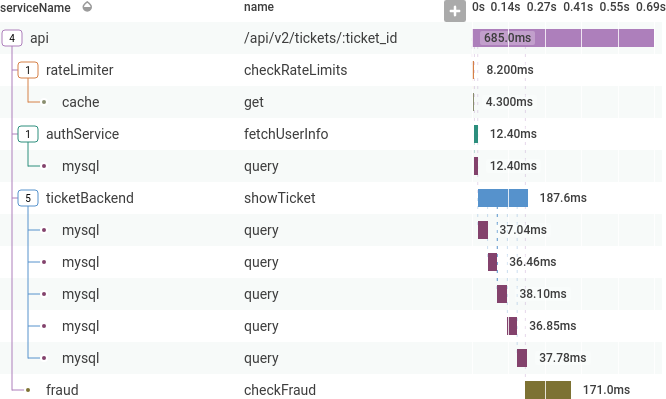
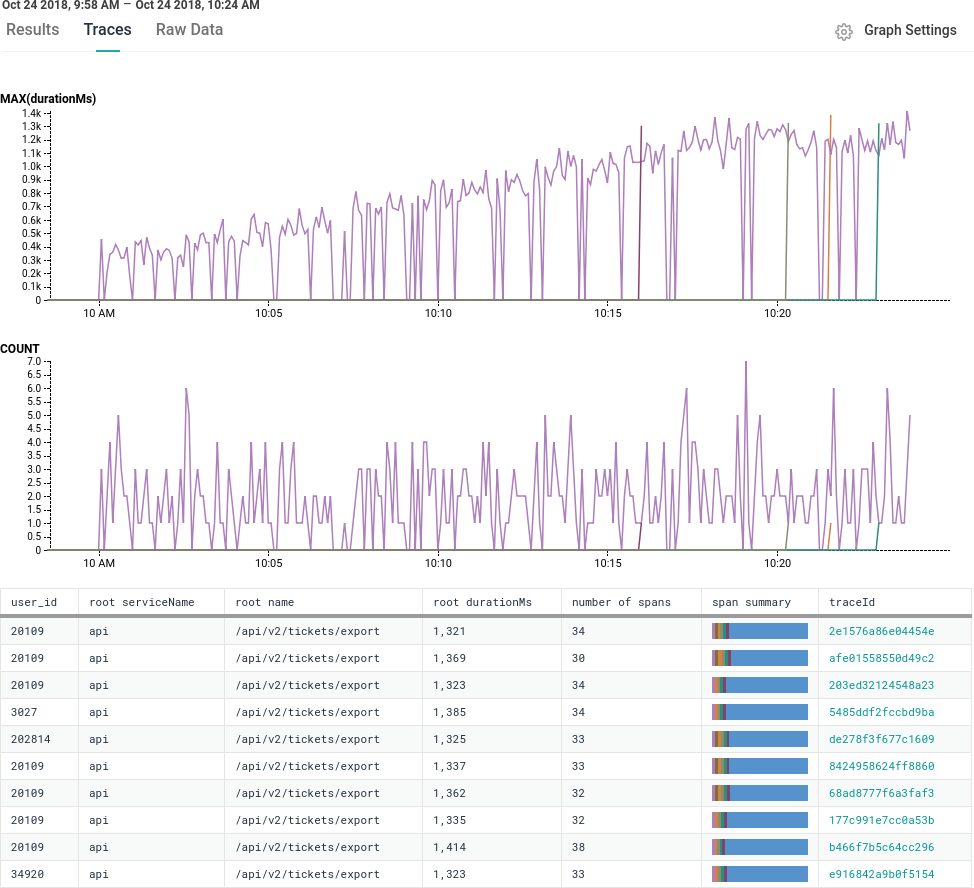 Selecting a representative trace shows the full execution of the API request, helping us understand why these API requests are slow.
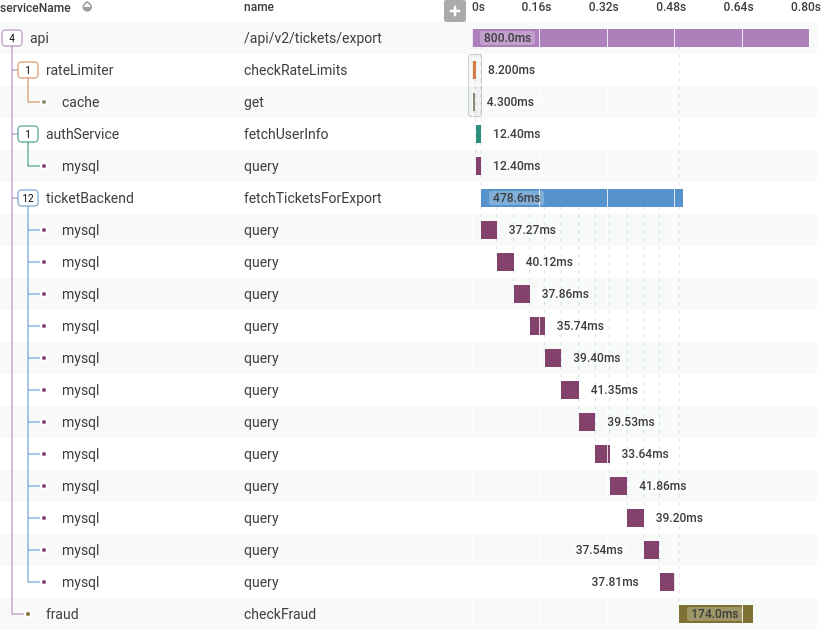 The first part seems normal, but `ticketBackend` is making more calls than expected to `mysql`.
Clicking on one of the `mysql` spans shows more information about it in the sidebar, including the specific database query.
The first part seems normal, but `ticketBackend` is making more calls than expected to `mysql`.
Clicking on one of the `mysql` spans shows more information about it in the sidebar, including the specific database query.
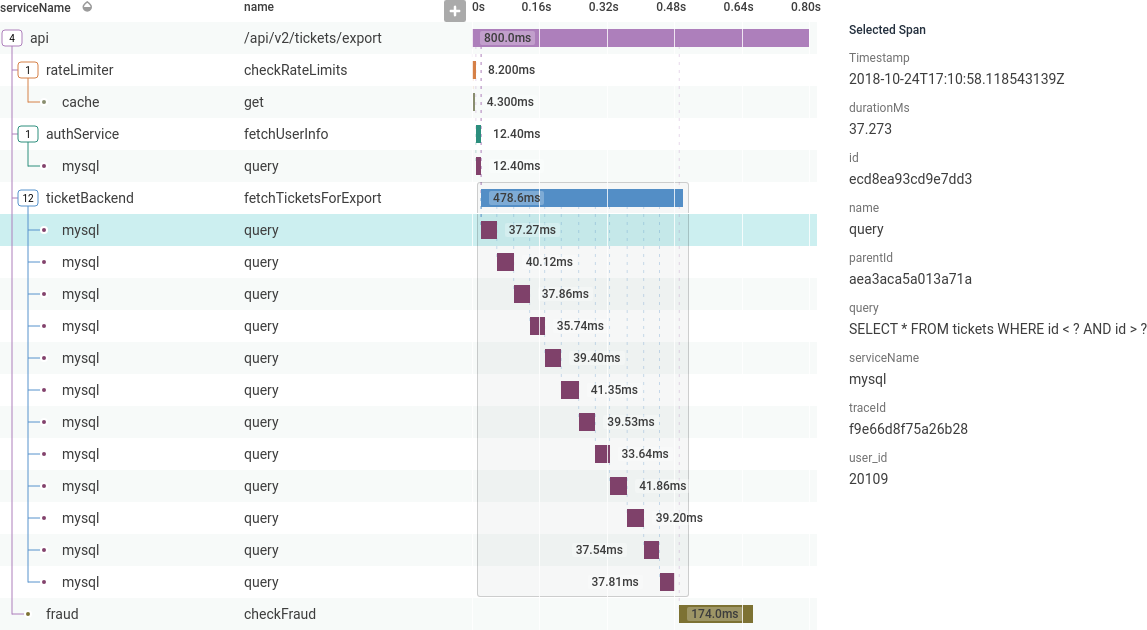 The information from this trace points to a possible next step.
Is the user running a script gone wrong? Or maybe this endpoint needs tighter rate limiting.
Traces show a level of detail that can be hard to see otherwise.
## Enhance a Trace with Archived Data
This feature is available as an add-on for the [Honeycomb Enterprise plan](https://www.honeycomb.io/pricing/).
Please contact your Honeycomb account team for details.
Traces showing missing spans or empty?
Sampling may have filtered out the spans you need, or the data may have expired from your retention period.
While sampling and retention limits help control costs, they mean some data isn't available in Honeycomb.
Archive rehydration solves this by retrieving your full, unsampled dataset from S3 storage on-demand, so you can investigate without the gaps.
If you have [configured an Amazon S3 bucket](/send-data/telemetry-pipeline/enhance/) as an archive for unsampled OpenTelemetry trace and log data, you can rehydrate that data, [query it in Honeycomb](/investigate/query/archive/), and use it to enhance traces.
To enhance a trace with archived data:
1. From the Trace Waterfall view, select **Enhance from Archive**.
The information from this trace points to a possible next step.
Is the user running a script gone wrong? Or maybe this endpoint needs tighter rate limiting.
Traces show a level of detail that can be hard to see otherwise.
## Enhance a Trace with Archived Data
This feature is available as an add-on for the [Honeycomb Enterprise plan](https://www.honeycomb.io/pricing/).
Please contact your Honeycomb account team for details.
Traces showing missing spans or empty?
Sampling may have filtered out the spans you need, or the data may have expired from your retention period.
While sampling and retention limits help control costs, they mean some data isn't available in Honeycomb.
Archive rehydration solves this by retrieving your full, unsampled dataset from S3 storage on-demand, so you can investigate without the gaps.
If you have [configured an Amazon S3 bucket](/send-data/telemetry-pipeline/enhance/) as an archive for unsampled OpenTelemetry trace and log data, you can rehydrate that data, [query it in Honeycomb](/investigate/query/archive/), and use it to enhance traces.
To enhance a trace with archived data:
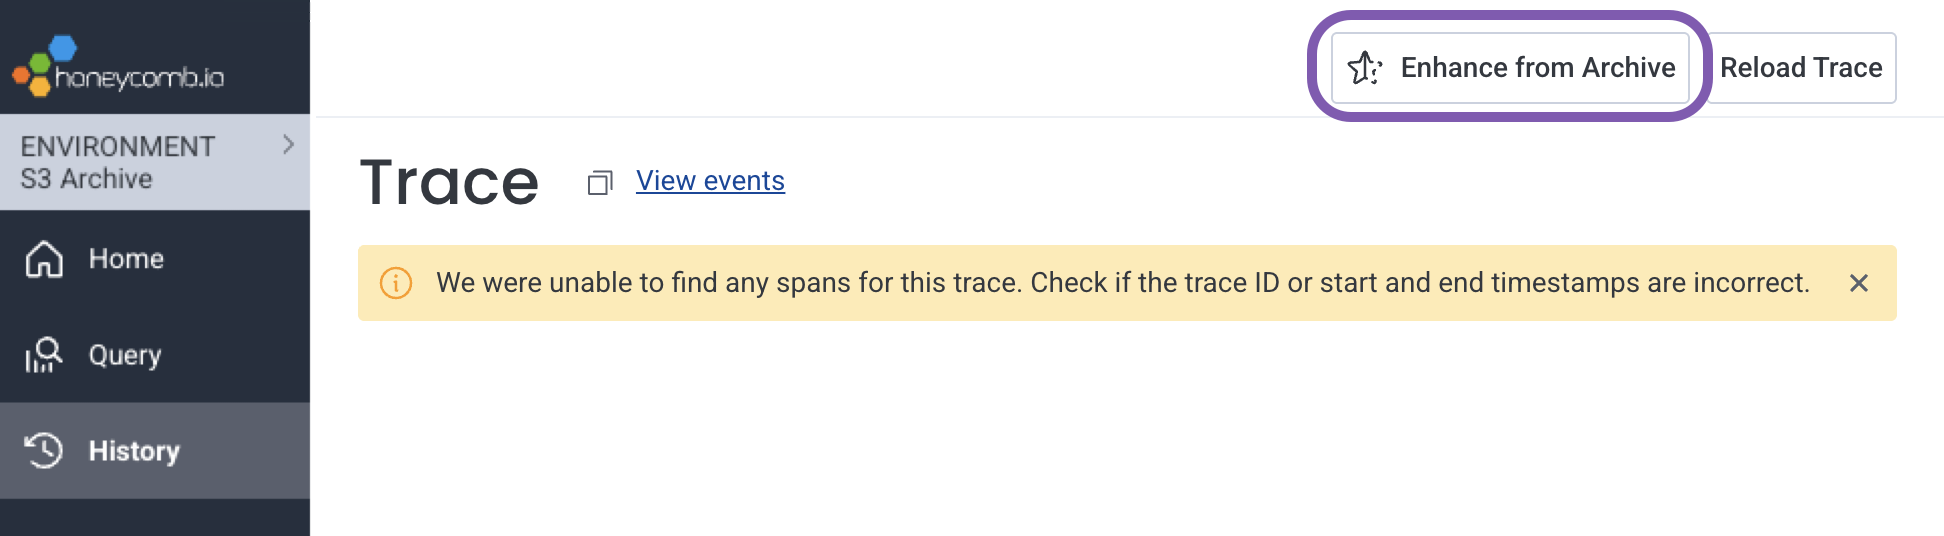
1. From the Trace Waterfall view, select **Enhance from Archive**.
 2. In the modal, review the automatically-populated scope of your rehydration:
| Field | Description |
| ---------- | ----------------------------------------------------------------------------------------------------------------------------------- |
| Start time | Start of the event time range to rehydrate. Automatically set to two hours before the trace timestamp to capture all related spans. |
| End time | End of the event time range to rehydrate. Automatically set to two hours after the trace timestamp to capture all related spans. |
| Index | Indexed field to filter by. Automatically set to your trace ID field to retrieve all spans for this trace. |
| Values | Value(s) to filter by. Automatically populated with the trace ID to ensure all spans are retrieved. |
3. Review your usage estimate to confirm:
* Approximate number of events based on the average size of previously rehydrated events
* Approximate number of free monthly rehydration events that will be used and free events remaining
* Approximate regular monthly events that will be used and regular events remaining
Typically, your free rehydration quota is 20% of your monthly event budget.
To find your actual quota, contact your Honeycomb Account representative.
4. Select **Rehydrate data** to ingest the missing spans.
You will be redirected to the **History** () page in your Amazon S3 Environment.
When ingestion completes, Honeycomb automatically re-runs your query using the rehydrated data.
A notification appears with a link to your results.
Your trace waterfall with all spans is now available for investigation.
2. In the modal, review the automatically-populated scope of your rehydration:
| Field | Description |
| ---------- | ----------------------------------------------------------------------------------------------------------------------------------- |
| Start time | Start of the event time range to rehydrate. Automatically set to two hours before the trace timestamp to capture all related spans. |
| End time | End of the event time range to rehydrate. Automatically set to two hours after the trace timestamp to capture all related spans. |
| Index | Indexed field to filter by. Automatically set to your trace ID field to retrieve all spans for this trace. |
| Values | Value(s) to filter by. Automatically populated with the trace ID to ensure all spans are retrieved. |
3. Review your usage estimate to confirm:
* Approximate number of events based on the average size of previously rehydrated events
* Approximate number of free monthly rehydration events that will be used and free events remaining
* Approximate regular monthly events that will be used and regular events remaining
Typically, your free rehydration quota is 20% of your monthly event budget.
To find your actual quota, contact your Honeycomb Account representative.
4. Select **Rehydrate data** to ingest the missing spans.
You will be redirected to the **History** () page in your Amazon S3 Environment.
When ingestion completes, Honeycomb automatically re-runs your query using the rehydrated data.
A notification appears with a link to your results.
Your trace waterfall with all spans is now available for investigation.