Get Started with Honeycomb for Frontend Observability | Honeycomb

Get Started with Honeycomb for Frontend Observability

Honeycomb offers web instrumentation, so you can get complete visibility into your customer experience, much like a Real User Monitoring (RUM) solution, but without any need for a proprietary agent. Our Honeycomb Web Instrumentation package, a wrapper for the official OpenTelemetry Javascript SDK, allows you to get a rich set of data for your web service, so you can understand what users are experiencing when using your service and identify areas you can optimize.

In this guide, we walk you through installing and configuring the default Honeycomb Web Instrumentation package, which will help you collect data on a variety of performance concerns for web services, as well as give you the necessary foundation for extending traces to any backend services that have OpenTelemetry instrumentation.

We will cover how to:

  • Set up instrumentation on your web site or web app
  • Send data to Honeycomb
  • Start exploring your data in Honeycomb

After following this guide, you will:

  • Have a rich set of default instrumentation available to help you debug your web service
  • Know how to access your data in Honeycomb and find items of interest to investigate
  • Be able to start improving your (and your team’s) Observability practices

Before You Begin 

Before you run the code, you’ll need to do a few things.

Get Your Honeycomb API Key 

To send data to Honeycomb, you need to:

  1. Sign up for a free Honeycomb account. To sign up, decide whether you would like Honeycomb to store your data in a US-based or EU-based location, then create a Honeycomb account in the US or create a Honeycomb account in the EU. Signup is free!
  2. Create a Honeycomb Ingest API Key. To get started, you can create a key that you expect to swap out when you deploy to production. Name it something helpful, perhaps noting that it’s a Getting Started key. Make note of your API key; for security reasons, you will not be able to see the key again, and you will need it later!
Tip
For setup, make sure you select the “Can create datasets” checkbox so that your data appears in Honeycomb. Later, when you replace this API key with a permanent one, you can uncheck that box.

Install the Honeycomb Web Instrumentation Package 

We make our Honeycomb Web Instrumentation package available as an NPM package, so you can include it in your web bundle.

Navigate to the root directory of your service’s repo, and then install the package:

Tip
If your repo does not contain a yarn.lock file, install with NPM.
npm install @honeycombio/opentelemetry-web @opentelemetry/auto-instrumentations-web
yarn add @honeycombio/opentelemetry-web @opentelemetry/auto-instrumentations-web

Confirm that the install was successful by opening your package.json file and checking that the Dependencies list now contains @honeycomb/opentelemetry-web.

Send Data to Honeycomb 

Once you have your Honeycomb Ingest API key and have installed Honeycomb’s Web Instrumentation package, it’s time to send telemetry data to Honeycomb!

Instantiate Your Instrumentation 

To get a comprehensive set of data about your application, you need to instantiate your instrumentation as early as possible in your application’s lifecycle.

You can set up your web instrumentation using a popular JavaScript framework, using inline JavaScript, or using a JavaScript helper file. To get started the most quickly, add your package configuration inline in the root instantiation file of your application:

Warning
Be sure to replace [YOUR API KEY HERE] and [YOUR APPLICATION NAME HERE] with the value of your Honeycomb API Ingest Key and the name of your service, respectively. We use the serviceName variable to name your dataset in Honeycomb, so replace it with a name that you will find useful.
// index.js or main.js

// other import statements...
import { HoneycombWebSDK } from '@honeycombio/opentelemetry-web';
import { getWebAutoInstrumentations } from '@opentelemetry/auto-instrumentations-web';

const configDefaults = {
  ignoreNetworkEvents: true,
  // propagateTraceHeaderCorsUrls: [
  // /.+/g, // Regex to match your backend URLs. Update to the domains you wish to include.
  // ]
}

const sdk = new HoneycombWebSDK({
  // endpoint: "https://api.eu1.honeycomb.io/v1/traces", // Send to EU instance of Honeycomb. Defaults to sending to US instance.
  debug: true, // Set to false for production environment.
  apiKey: '[YOUR API KEY HERE]', // Replace with your Honeycomb Ingest API Key.
  serviceName: '[YOUR APPLICATION NAME HERE]', // Replace with your application name. Honeycomb uses this string to find your dataset when we receive your data. When no matching dataset exists, we create a new one with this name if your API Key has the appropriate permissions.
  instrumentations: [getWebAutoInstrumentations({
    // Loads custom configuration for xml-http-request instrumentation.
    '@opentelemetry/instrumentation-xml-http-request': configDefaults,
    '@opentelemetry/instrumentation-fetch': configDefaults,
    '@opentelemetry/instrumentation-document-load': configDefaults,
  })],
});
sdk.start();

// Application instantiation code

Tips for Common JavaScript Frameworks 

In this section, we show you how to set up your web instrumentation in popular JS frameworks. Depending on the framework your application uses, instantiation may be handled differently. If you run into trouble, please ask for help in our Pollinators Community.

If you are using React (such as with create-react-app or via Next.js), you will need to wrap the Honeycomb code snippet in a component to instantiate it.

  1. Create a file called observability.jsx|tsx in your components directory, and insert the code:

    // observability.jsx|tsx
    "use client"; // browser only: https://react.dev/reference/react/use-client
    import { HoneycombWebSDK } from '@honeycombio/opentelemetry-web';
    import { getWebAutoInstrumentations } from '@opentelemetry/auto-instrumentations-web';
    
    const configDefaults = {
      ignoreNetworkEvents: true,
      // propagateTraceHeaderCorsUrls: [
      // /.+/g, // Regex to match your backend URLs. Update to the domains you wish to include.
      // ]
    }
    export default function Observability(){
      try {
        const sdk = new HoneycombWebSDK({
          // endpoint: "https://api.eu1.honeycomb.io/v1/traces", // Send to EU instance of Honeycomb. Defaults to sending to US instance.
          debug: true, // Set to false for production environment.
          apiKey: '[YOUR API KEY HERE]', // Replace with your Honeycomb Ingest API Key.
          serviceName: '[YOUR APPLICATION NAME HERE]', // Replace with your application name. Honeycomb uses this string to find your dataset when we receive your data. When no matching dataset exists, we create a new one with this name if your API Key has the appropriate permissions.
          instrumentations: [getWebAutoInstrumentations({
            // Loads custom configuration for xml-http-request instrumentation.
            '@opentelemetry/instrumentation-xml-http-request': configDefaults,
            '@opentelemetry/instrumentation-fetch': configDefaults,
            '@opentelemetry/instrumentation-document-load': configDefaults,
          })],
        });
        sdk.start();
      } catch (e) {return null;}
      return null;
    }
    
  2. In your Layout.jsx|tsx file, import the component, and add it to your layout code:

    // components/layout.tsx|jsx
    import Observability from "@/components/observability";
    // ...
      return (
        <html lang="en">
          <body>{children}</body>
          <Observability />
        </html>
      );
    

Recommended file location: src/main.ts

Place code early, ideally just above the Vue instantiation, to ensure that your instrumentation is as accurate as possible. Find the line that imports main.css, and add the code directly afterwards:

import '.assets/main.css'

// HONEYCOMB SNIPPET HERE

// import { createApp } from 'vue'
Warning
Make sure that your package.js lists version 0.37.0 or greater for @opentelemetry/auto-instrumentations-web. Versions prior to this had a conflict with Angular that prevented automatic instrumentation data from working.

The best place to put your code to instantiate early is the src/main.ts file, which is the entry point of your application.

If you are using ember-auto-import, then you can import the Honeycomb instrumentation packages directly. The best way to use Honeycomb in an Ember application is through an Application Initializer, which ensures that Honeycomb starts up as soon as possible.

  1. Use the Ember CLI to generate a new initializer named observability:

    ember generate instance-initializer observability
    

    You should see a new JS file named observability.js in the app/instance-initializers/ directory.

  2. Add Honeycomb configuration code to the observability.js file:

    import { HoneycombWebSDK } from '@honeycombio/opentelemetry-web';
    import { getWebAutoInstrumentations } from '@opentelemetry/auto-instrumentations-web';
    
    const configDefaults = {
      ignoreNetworkEvents: true,
      // propagateTraceHeaderCorsUrls: [
      // /.+/g, // Regex to match your backend URLs. Update to the domains you wish to include.
      // ]
    }
    
    export function initialize(owner) {
      const sdk = new HoneycombWebSDK({
        // endpoint: "https://api.eu1.honeycomb.io/v1/traces", // Send to EU instance of Honeycomb. Defaults to sending to US instance.
        debug: true, // Set to false for production environment.
        apiKey: '[YOUR API KEY HERE]', // Replace with your Honeycomb Ingest API Key.
        serviceName: '[YOUR APPLICATION NAME HERE]', // Replace with your application name. Honeycomb uses this string to find your dataset when we receive your data. When no matching dataset exists, we create a new one with this name if your API Key has the appropriate permissions.
        instrumentations: [getWebAutoInstrumentations({
          // Loads custom configuration for xml-http-request instrumentation.
          '@opentelemetry/instrumentation-xml-http-request': configDefaults,
          '@opentelemetry/instrumentation-fetch': configDefaults,
          '@opentelemetry/instrumentation-document-load': configDefaults,
        })],
      });
      sdk.start();
    }
    
    export default {
      initialize,
    };
    

Confirm Data is Sent 

Start up your application and look in the browser console to see debug information. Once you see traces being sent in the console, you’re ready to start using Honeycomb to explore your data.

If you encounter an error, visit Troubleshooting to explore solutions to common issues.

Refine Your Implementation 

Once data flows into Honeycomb, you can add custom data about your application to help with investigations.

Add Application-Specific Resource Attributes 

To optimize your data collection, we recommend that you add custom attributes that are specific to your application to every span. You can specify extra attributes through the resourceAttributes configuration option. This data will be available on every span your instrumentation emits, making it easier to correlate your data to the business information you care about.

// index.js or main.js

// Other import statements
import { HoneycombWebSDK } from '@honeycombio/opentelemetry-web';
import { getWebAutoInstrumentations } from '@opentelemetry/auto-instrumentations-web';

const configDefaults = {
  ignoreNetworkEvents: true,
  // propagateTraceHeaderCorsUrls: [
  // /.+/g, // Regex to match your backend URLs. Update to the domains you wish to include.
  // ]
}

const sdk = new HoneycombWebSDK({
  // endpoint: "https://api.eu1.honeycomb.io/v1/traces", // Send to EU instance of Honeycomb. Defaults to sending to US instance.
  debug: true, // Set to false for production environment.
  apiKey: '[YOUR API KEY HERE]', // Replace with your Honeycomb Ingest API Key.
  serviceName: '[YOUR APPLICATION NAME HERE]', // Replace with your application name. Honeycomb uses this string to find your dataset when we receive your data. When no matching dataset exists, we create a new one with this name if your API Key has the appropriate permissions.
  instrumentations: [getWebAutoInstrumentations({
    // Loads custom configuration for xml-http-request instrumentation.
    '@opentelemetry/instrumentation-xml-http-request': configDefaults,
    '@opentelemetry/instrumentation-fetch': configDefaults,
    '@opentelemetry/instrumentation-document-load': configDefaults,
  })],
  resourceAttributes: { // Data in this object is applied to every trace emitted.
    "user.id": user.id, // Specific to your app.
    "user.role": user.role, // Specific to your app.
  },
});
sdk.start();

// Application instantiation code

Connect Browser Traces with Backend Traces 

To trace a request all the way from your browser through your distributed system, connect your frontend request traces to your backend traces.

If your application’s backend and frontend are served from the same domain, you can connect traces automatically by using either instrumentation-fetch or instrumentation-xml-http-request automatic instrumentation. If your browser application calls a separate API endpoint, then you must specify the requests to which you want the trace context header added in order to connect the traces. To do this with the Honeycomb web instrumentation and send traces, uncomment the propagateTraceHeaderCorsUrls array and add regex to include all target domains. This method allows you to propagate to your backend services without leaking trace IDs to third-party services.

const configDefaults = {
  ignoreNetworkEvents: true,
  propagateTraceHeaderCorsUrls: [
    /.+/g, // Regex to match your backend URLs. Update to the domains you wish to include.
  ]
}

Send Data to an OpenTelemetry Collector 

In production, we recommend that you run an OpenTelemetry Collector and send traces to it from your browser application, which will allow you to control your Honeycomb API key and any data transformation. Your OpenTelemetry Collector can then send the traces on to Honeycomb using your API key that you store in the Collector’s configuration.

This example configuration of the Honeycomb Web Instrumentation package sends traces to your Collector:

const sdk = new HoneycombWebSDK({
  debug: true, // Set to false for production environment.
  endpoint: "http(s)://<your-collector-url>",
  skipOptionsValidation: true // Because we are not including apiKey
  serviceName: '[YOUR APPLICATION NAME HERE]', // Replace with your application name. Honeycomb uses this string to find your dataset when we receive your data. When no matching dataset exists, we create a new one with this name if your API Key has the appropriate permissions.
  instrumentations: [getWebAutoInstrumentations({
    // Loads custom configuration for xml-http-request instrumentation.
    '@opentelemetry/instrumentation-xml-http-request': configDefaults,
    '@opentelemetry/instrumentation-fetch': configDefaults,
    '@opentelemetry/instrumentation-document-load': configDefaults,
  })],
});
sdk.start();

Troubleshooting 

If you need to troubleshoot your Honeycomb web instrumentation, explore these solutions to common issues.

Tip
To ask questions and learn more, visit our Support Knowledge Base or join our Pollinators Community.

Dataset Not Appearing in Honeycomb 

We use the apiKey variable to send your data to Honeycomb. Be sure you have replaced the placeholder value for it with your Honeycomb Ingest API Key and that your API key permissions include “Can create datasets”.

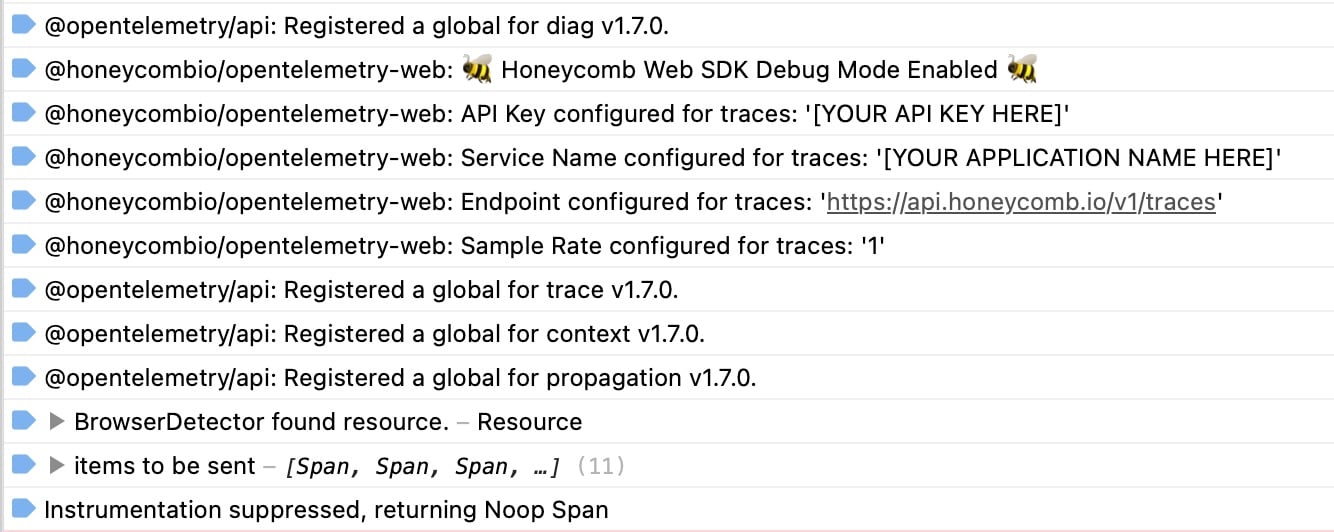
If Honeycomb is successfully instantiating, but your API key is not included, you should see output similar to the following in your browser console:

Screenshot of Honeycomb UI on the API Keys page, showing the heading Ingest Keys and the button named 'Create Ingest Key'

Dataset in Honeycomb has Unexpected Name 

We use the serviceName variable to name your dataset in Honeycomb. Be sure you have replaced the placeholder value for it with a name that you will find useful.

If a “navigator is undefined” error appears when you attempt to start your local server while following Next.js instructions, it means the instrumentation is being run in a server-side rendering path.

To fix, try the first suggested solution before implementing the second solution:

  1. Add “use client” directive: At the top of the file where you instantiate Honeycomb’s web instrumentation, you can add the “use client” directive, which tells React to only execute the file in a client environment. If that solution does not resolve the error, try step 2.
  2. Wrap the function in a try/catch block: If you’re using the client directive and still seeing an error, you can catch the error and avoid instantiation in server-side environments. By adding this, you ensure your app starts up even if the code is executed in a server-side environment. Refer to the example below:
 try {
  const sdk = new HoneycombWebSDK({
    // endpoint: "https://api.eu1.honeycomb.io/v1/traces", // Send to EU instance of Honeycomb. Defaults to sending to US instance.
    debug: true, // Set to false for production environment.
    apiKey: '[YOUR API KEY HERE]', // Replace with your Honeycomb Ingest API Key.
    serviceName: '[YOUR APPLICATION NAME HERE]', // Replace with your application name. Honeycomb uses this string to find your dataset when we receive your data. When no matching dataset exists, we create a new one with this name if your API Key has the appropriate permissions.
    instrumentations: [getWebAutoInstrumentations({
      // Loads custom configuration for xml-http-request instrumentation.
      '@opentelemetry/instrumentation-xml-http-request': configDefaults,
      '@opentelemetry/instrumentation-fetch': configDefaults,
      '@opentelemetry/instrumentation-document-load': configDefaults,
    })],
  });
 } catch (e) {}