> ## Documentation Index
> Fetch the complete documentation index at: https://docs.honeycomb.io/llms.txt
> Use this file to discover all available pages before exploring further.
# Get Started with Traces and Wide Events
> Add instrumentation to your application, send traces and wide events to Honeycomb, and start analyzing performance and behavior across your system.
[Honeycomb](https://www.honeycomb.io/why-honeycomb/) is a fast analysis tool that helps you analyze your code's performance and behavior to troubleshoot complex relationships within your system to solve problems faster.
To use Honeycomb, you first need to get your system's traces into Honeycomb.
These instructions will guide you through the process of sending trace data from an application in your local development environment to Honeycomb and exploring your data in Honeycomb.
Not ready to instrument and deploy an application, but want to see what Honeycomb can do for you?
Check out this [interactive demo](https://play.honeycomb.io/sandbox/environments/analyze-debug-tour) that requires no setup, or learn what is possible from the [guided tutorials in our Honeycomb sandbox](https://play.honeycomb.io/sandbox/tours)!
## Before You Begin
Before you run the code, you'll need to do a few things.
### Create a Honeycomb Account
Before you can use Honeycomb products, you'll need to decide whether you would like Honeycomb to store your data in a US-based or EU-based location.
Then, [create a Honeycomb account in the US](https://ui.honeycomb.io/signup) or [create a Honeycomb account in the EU](https://ui.eu1.honeycomb.io/signup).
Signup is free!
### Create a Honeycomb Team
Complete your account creation by giving us a team name.
Honeycomb uses teams to organize groups of users, grant them access to data, and create a shared work history in Honeycomb.
We recommend using your company or organization name as your Honeycomb team name.
### Get Your Honeycomb API Key
To send data to Honeycomb, you'll need your Honeycomb API Key.
Once you create your team, you will be able to view or copy it.
Make note of your API Key; for security reasons, you will not be able to see it again, and you will need it later!
You can also [find your Honeycomb API Key](/configure/environments/manage-api-keys/#find-api-keys) any time in your Environment Settings.
## Send Telemetry Data to Honeycomb
Once you have your Honeycomb API key and have chosen an application, it's time to send telemetry data to Honeycomb!
This guide helps users who are new to observability get their trace data into Honeycomb using [OpenTelemetry](/send-data/opentelemetry/).
If you already have an OpenTelemetry implementation and are switching to Honeycomb, read about [OpenTelemetry Collector](/send-data/opentelemetry/collector/).
### Choose Your Application
Choose a single application or service that will send data to Honeycomb.
To successfully complete this Quick Start, you should have access to modify your application's source code.
To test the application when you are finished, you must be able to run your application or service in a development environment.
Don't have access to an application?
Follow along using one of our [example applications](/get-started/start-building/example-applications/)!
### Add Automatic Instrumentation to Your Code
The quickest way to start seeing your trace data in Honeycomb is to use [OpenTelemetry](https://opentelemetry.io/), an open-source collection of tools, APIs, and SDKs, to automatically inject instrumentation code into your application without requiring explicit changes to your codebase.
Automatic instrumentation works slightly differently within each language, but the general idea is that it attaches hooks into popular tools and frameworks and
"watches" for certain functions to be called.
When they're called, the instrumentation automatically starts and completes trace spans on behalf of your application.
When you add automatic instrumentation to your code, OpenTelemetry will build spans, which represent units of work or operations within your application that you want to capture and analyze for observability purposes.
This Quick Start uses the `npm` dependency manager.
For instructions with `yarn` or if using TypeScript, read our [OpenTelemetry Node.js documentation](/send-data/javascript-nodejs/opentelemetry-sdk/#add-automatic-instrumentation).
#### Acquire Dependencies
Open your terminal, navigate to the location of your project on your drive, and install OpenTelemetry's automatic instrumentation meta package and OpenTelemetry's Node.js SDK package:
```shell theme={}
npm install --save \
@opentelemetry/auto-instrumentations-node \
@opentelemetry/sdk-node
```
| Module | Description |
| ---------------------------- | ------------------------------------------------------------------------------------------------------------------------------------------------------------------------------------------------------------------------------- |
| `auto-instrumentations-node` | OpenTelemetry's meta package that provides a way to add automatic instrumentation to any Node application to capture telemetry data from a number of popular libraries and frameworks, like `express`, `dns`, `http`, and more. |
| `sdk-node` | OpenTelemetry's Node.js distribution package that streamlines configuration and allows you to instrument as quickly and easily as possible. |
Alternatively, install [individual instrumentation packages](https://github.com/open-telemetry/opentelemetry-js#instrumentations).
If using TypeScript, install `ts-node` to run the code:
```shell theme={}
npm install --save-dev ts-node
```
#### Initialize
Create an initialization file, commonly known as the `tracing.js` file:
```javascript theme={}
// Example filename: tracing.js
'use strict';
const { NodeSDK } = require('@opentelemetry/sdk-node');
const { getNodeAutoInstrumentations } = require('@opentelemetry/auto-instrumentations-node');
const sdk = new NodeSDK({
instrumentations: [
getNodeAutoInstrumentations(),
],
});
sdk.start();
```
#### Configure the OpenTelemetry SDK
Create an `otelconfig.yaml` file with the following content:
```yaml theme={}
file_format: "1.0"
resource:
attributes:
- name: service.name
value: ${OTEL_SERVICE_NAME:-my-service}
tracer_provider:
processors:
- batch:
exporter:
otlp_http:
endpoint: https://api.honeycomb.io/v1/traces
# Use the endpoint below for EU
# endpoint: https://api.eu1.honeycomb.io/v1/traces
headers:
- name: x-honeycomb-team
value: ${HONEYCOMB_API_KEY}
meter_provider: # (*)
readers:
- periodic:
exporter:
otlp_http:
endpoint: https://api.honeycomb.io/v1/metrics
# Use the endpoint below for EU
# endpoint: https://api.eu1.honeycomb.io/v1/metrics
headers:
- name: x-honeycomb-team
value: ${HONEYCOMB_API_KEY}
- name: x-honeycomb-dataset
value: ${HONEYCOMB_METRICS_DATASET}
logger_provider:
processors:
- batch:
exporter:
otlp_http:
endpoint: https://api.honeycomb.io/v1/logs
# Use the endpoint below for EU
# endpoint: https://api.eu1.honeycomb.io/v1/logs
headers:
- name: x-honeycomb-team
value: ${HONEYCOMB_API_KEY}
propagator:
composite:
- tracecontext:
- baggage:
```
Fields marked with an asterisk (\*) are required for exporting metrics to Honeycomb.
Set the following environment variables before running your application:
| Environment Variable | Value |
| :-------------------------- | :-------------------------------------------- |
| `HONEYCOMB_API_KEY` | Your Honeycomb API key |
| `OTEL_SERVICE_NAME` | The name of your service |
| `HONEYCOMB_METRICS_DATASET` | The Honeycomb dataset to send metrics to (\*) |
If you are using the EU instance, replace `https://api.honeycomb.io` with `https://api.eu1.honeycomb.io` in the configuration file.
You can also configure the SDK using [environment variables](https://opentelemetry.io/docs/languages/sdk-configuration/general/).
If you use [Honeycomb Classic](/troubleshoot/product-lifecycle/recommended-migrations/#migrate-from-honeycomb-classic-to-honeycomb-environments), you must also specify the Dataset using the `x-honeycomb-dataset` header.
```shell theme={}
export OTEL_EXPORTER_OTLP_HEADERS="x-honeycomb-team=your-api-key,x-honeycomb-dataset=your-dataset"
```
If you are sending data directly to Honeycomb, you must configure the API key and service name.
If you are using an [OpenTelemetry Collector](/send-data/opentelemetry/collector/), configure your API key at the Collector level instead.
#### Run Your Application
Point the SDK at your configuration file using the `OTEL_CONFIG_FILE` environment variable, then run the Node.js app with the initialization file:
```shell theme={}
OTEL_CONFIG_FILE=./otelconfig.yaml node -r ./tracing.js YOUR_APPLICATION_NAME.js
```
Be sure to replace `YOUR_APPLICATION_NAME` with the name of your application's main file.
Alternatively, you can import the initialization file as the first step in your application lifecycle.
In Honeycomb's UI, you should now see your application's incoming requests and outgoing HTTP calls generate traces.
This Quick Start uses the `pip` package manager.
For instructions with `poetry`, read our [OpenTelemetry Python documentation](/send-data/python/opentelemetry-sdk/#add-automatic-instrumentation).
#### Acquire Dependencies
1. Install the OpenTelemetry Python packages:
```shell theme={}
python -m pip install opentelemetry-instrumentation \
opentelemetry-distro \
opentelemetry-exporter-otlp
```
2. Install instrumentation libraries for the packages used by your application.
We recommend using the `opentelemetry-bootstrap` tool that comes with the OpenTelemetry SDK to scan your application packages and print out a list of available instrumentation libraries.
You should then add these libraries to your `requirements.txt` file:
```shell theme={}
opentelemetry-bootstrap >> requirements.txt
pip install -r requirements.txt
```
If you do not use a `requirements.txt` file, you can install the libraries directly in your current environment:
```shell theme={}
opentelemetry-bootstrap --action=install
```
#### Configure the OpenTelemetry SDK
Use environment variables to configure the OpenTelemetry SDK:
```shell theme={}
export OTEL_SERVICE_NAME="your-service-name"
export OTEL_TRACES_EXPORTER="otlp"
export OTEL_LOGS_EXPORTER="otlp"
export OTEL_EXPORTER_OTLP_PROTOCOL="http/protobuf"
export OTEL_EXPORTER_OTLP_ENDPOINT="https://api.honeycomb.io:443" # US instance
#export OTEL_EXPORTER_OTLP_ENDPOINT="https://api.eu1.honeycomb.io:443" # EU instance
export OTEL_EXPORTER_OTLP_HEADERS="x-honeycomb-team="
export OTEL_PYTHON_LOGGING_AUTO_INSTRUMENTATION_ENABLED=true
```
| Variable | Description |
| -------------------------------------------------- | ---------------------------------------------------------------------------------------------------------------------------------------------------------------------------------------------------------------------------- |
| `OTEL_SERVICE_NAME` | Service name. When you send data, Honeycomb creates a dataset in which to store your data and uses this as the name. Can be any string. |
| `OTEL_EXPORTER_OTLP_PROTOCOL` | The data format that the SDK uses to send telemetry to Honeycomb. For more on data format configuration options, read [Choosing between gRPC and HTTP](/send-data/python/opentelemetry-sdk/#choosing-between-grpc-and-http). |
| `OTEL_EXPORTER_OTLP_ENDPOINT` | Honeycomb endpoint to which you want to send your data. |
| `OTEL_EXPORTER_OTLP_HEADERS` | Adds your Honeycomb API Key to the exported telemetry headers for authorization. [Learn how to find your Honeycomb API Key](/configure/environments/manage-api-keys/#find-api-keys). |
| `OTEL_PYTHON_LOGGING_AUTO_INSTRUMENTATION_ENABLED` | Enable logs auto-instrumentation using Python root logger. |
To learn more about configuration options, visit [Agent Configuration](https://opentelemetry.io/docs/languages/python/automatic/agent-config/) in the OpenTelemetry documentation.
If you use [Honeycomb Classic](/troubleshoot/product-lifecycle/recommended-migrations/#migrate-from-honeycomb-classic-to-honeycomb-environments), you must also specify the Dataset using the `x-honeycomb-dataset` header.
```shell theme={}
export OTEL_EXPORTER_OTLP_HEADERS="x-honeycomb-team=your-api-key,x-honeycomb-dataset=your-dataset"
```
If you are sending data directly to Honeycomb, you must configure the API key and service name.
If you are using an [OpenTelemetry Collector](/send-data/opentelemetry/collector/), configure your API key at the Collector level instead.
#### Run Your Application
Run your Python application using the OpenTelemetry Python automatic instrumentation tool `opentelemetry-instrument`, which configures the OpenTelemetry SDK:
```shell theme={}
opentelemetry-instrument \
--traces_exporter console \
--metrics_exporter console \
--logs_exporter console \
python YOUR_APPLICATION_NAME.py
```
Be sure to replace `YOUR_APPLICATION_NAME` with the name of your application's main file.
In Honeycomb's UI, you should now see your application's incoming requests and outgoing HTTP calls generate traces.
#### Acquire Dependencies
The automatic instrumentation agent for OpenTelemetry Java will automatically generate trace data from your application.
The agent is packaged as a JAR file and is run alongside your app.
In order to use the automatic instrumentation agent, you must first download it:
```shell theme={}
curl -L -O https://github.com/open-telemetry/opentelemetry-java-instrumentation/releases/latest/download/opentelemetry-javaagent.jar
```
#### Configure the OpenTelemetry SDK
Create an `otelconfig.yaml` file with the following content:
```yaml theme={}
file_format: "1.0"
resource:
attributes:
- name: service.name
value: ${OTEL_SERVICE_NAME:-my-service}
tracer_provider:
processors:
- batch:
exporter:
otlp_http:
endpoint: https://api.honeycomb.io/v1/traces
# Use the endpoint below for EU
# endpoint: https://api.eu1.honeycomb.io/v1/traces
headers:
- name: x-honeycomb-team
value: ${HONEYCOMB_API_KEY}
meter_provider: # (*)
readers:
- periodic:
exporter:
otlp_http:
endpoint: https://api.honeycomb.io/v1/metrics
# Use the endpoint below for EU
# endpoint: https://api.eu1.honeycomb.io/v1/metrics
headers:
- name: x-honeycomb-team
value: ${HONEYCOMB_API_KEY}
- name: x-honeycomb-dataset
value: ${HONEYCOMB_METRICS_DATASET}
logger_provider:
processors:
- batch:
exporter:
otlp_http:
endpoint: https://api.honeycomb.io/v1/logs
# Use the endpoint below for EU
# endpoint: https://api.eu1.honeycomb.io/v1/logs
headers:
- name: x-honeycomb-team
value: ${HONEYCOMB_API_KEY}
propagator:
composite:
- tracecontext:
- baggage:
```
Fields marked with an asterisk (\*) are required for exporting metrics to Honeycomb.
Set the following environment variables before running your application:
| Environment Variable | Value |
| :-------------------------- | :-------------------------------------------- |
| `HONEYCOMB_API_KEY` | Your Honeycomb API key |
| `OTEL_SERVICE_NAME` | The name of your service |
| `HONEYCOMB_METRICS_DATASET` | The Honeycomb dataset to send metrics to (\*) |
If you are using the EU instance, replace `https://api.honeycomb.io` with `https://api.eu1.honeycomb.io` in the configuration file.
You can also configure the SDK using [environment variables or system properties](https://github.com/open-telemetry/opentelemetry-java/tree/main/sdk-extensions/autoconfigure).
#### Run Your Application
Point the agent at your configuration file using the `OTEL_CONFIG_FILE` environment variable, then run your application:
```shell theme={}
OTEL_CONFIG_FILE=./otelconfig.yaml java -javaagent:opentelemetry-javaagent.jar -jar /path/to/myapp.jar
```
In Honeycomb's UI, you should now see your application's incoming requests and outgoing HTTP calls generate traces.
This Quick Start uses ASP.NET Core.
#### Acquire Dependencies
Install the OpenTelemetry .NET packages. For example, with the .NET CLI, use:
```shell theme={}
dotnet add package OpenTelemetry
dotnet add package OpenTelemetry.Extensions.Hosting
dotnet add package OpenTelemetry.Instrumentation.AspNetCore
dotnet add package OpenTelemetry.Instrumentation.Http
```
#### Initialize
Initialize the TracerProvider during application setup.
```csharp theme={}
services.AddOpenTelemetry().WithTracing(builder => builder
.AddAspNetCoreInstrumentation()
.AddHttpClientInstrumentation()
.AddOtlpExporter());
```
#### Configure
Use environment variables to configure the OpenTelemetry SDK:
```shell theme={}
export OTEL_SERVICE_NAME="your-service-name"
export OTEL_EXPORTER_OTLP_PROTOCOL="http/protobuf"
export OTEL_EXPORTER_OTLP_ENDPOINT="https://api.honeycomb.io:443" # US instance
#export OTEL_EXPORTER_OTLP_ENDPOINT="https://api.eu1.honeycomb.io:443" # EU instance
export OTEL_EXPORTER_OTLP_HEADERS="x-honeycomb-team="
```
| Variable | Description |
| ----------------------------- | ---------------------------------------------------------------------------------------------------------------------------------------------------------------------------------------------------------- |
| `OTEL_SERVICE_NAME` | Service name. When you send data, Honeycomb creates a dataset in which to store your data and uses this as the name. Can be any string. |
| `OTEL_EXPORTER_OTLP_PROTOCOL` | The data format that the SDK uses to send telemetry to Honeycomb. For more on data format configuration options, read [Choosing between gRPC and HTTP](/send-data/dotnet/#choosing-between-grpc-and-http). |
| `OTEL_EXPORTER_OTLP_ENDPOINT` | Honeycomb endpoint to which you want to send your data. |
| `OTEL_EXPORTER_OTLP_HEADERS` | Adds your Honeycomb API Key to the exported telemetry headers for authorization. [Learn how to find your Honeycomb API Key](/configure/environments/manage-api-keys/#find-api-keys). |
#### Run
Run your application. You will see the incoming requests and outgoing HTTP calls generate traces.
```shell theme={}
dotnet run
```
In Honeycomb's UI, you should now see your application's incoming requests and outgoing HTTP calls generate traces.
#### Acquire Dependencies
Install OpenTelemetry Go packages:
```shell theme={}
go get \
go.opentelemetry.io/contrib/otelconf \
go.opentelemetry.io/contrib/instrumentation/net/http/otelhttp
```
#### Initialize
Prepare your application to send spans to Honeycomb.
Open or create a file called `main.go`:
```go theme={}
package main
import (
"context"
"fmt"
"log"
"net/http"
"go.opentelemetry.io/contrib/instrumentation/net/http/otelhttp"
"go.opentelemetry.io/contrib/otelconf"
"go.opentelemetry.io/otel"
)
// Implement an HTTP Handler function to be instrumented
func httpHandler(w http.ResponseWriter, r *http.Request) {
fmt.Fprintf(w, "Hello, World")
}
func main() {
// use otelconf to set up OpenTelemetry SDK
sdk, err := otelconf.NewSDK()
if err != nil {
log.Fatalf("error setting up OTel SDK - %e", err)
}
defer sdk.Shutdown(context.Background())
otel.SetTracerProvider(sdk.TracerProvider())
otel.SetTextMapPropagator(sdk.Propagator())
// Initialize HTTP handler instrumentation
handler := http.HandlerFunc(httpHandler)
wrappedHandler := otelhttp.NewHandler(handler, "hello")
http.Handle("/hello", wrappedHandler)
// Serve HTTP server
log.Fatal(http.ListenAndServe(":3030", nil))
}
```
#### Configure the OpenTelemetry SDK
Create an `otelconfig.yaml` file with the following content:
```yaml theme={}
file_format: "1.0"
resource:
attributes:
- name: service.name
value: ${OTEL_SERVICE_NAME:-my-service}
tracer_provider:
processors:
- batch:
exporter:
otlp_http:
endpoint: https://api.honeycomb.io/v1/traces
# Use the endpoint below for EU
# endpoint: https://api.eu1.honeycomb.io/v1/traces
headers:
- name: x-honeycomb-team
value: ${HONEYCOMB_API_KEY}
meter_provider: # (*)
readers:
- periodic:
exporter:
otlp_http:
endpoint: https://api.honeycomb.io/v1/metrics
# Use the endpoint below for EU
# endpoint: https://api.eu1.honeycomb.io/v1/metrics
headers:
- name: x-honeycomb-team
value: ${HONEYCOMB_API_KEY}
- name: x-honeycomb-dataset
value: ${HONEYCOMB_METRICS_DATASET}
logger_provider:
processors:
- batch:
exporter:
otlp_http:
endpoint: https://api.honeycomb.io/v1/logs
# Use the endpoint below for EU
# endpoint: https://api.eu1.honeycomb.io/v1/logs
headers:
- name: x-honeycomb-team
value: ${HONEYCOMB_API_KEY}
propagator:
composite:
- tracecontext:
- baggage:
```
Fields marked with an asterisk (\*) are required for exporting metrics to Honeycomb.
Set the following environment variables before running your application:
| Environment Variable | Value |
| :-------------------------- | :-------------------------------------------- |
| `HONEYCOMB_API_KEY` | Your Honeycomb API key |
| `OTEL_SERVICE_NAME` | The name of your service |
| `HONEYCOMB_METRICS_DATASET` | The Honeycomb dataset to send metrics to (\*) |
If you are using the EU instance, replace `https://api.honeycomb.io` with `https://api.eu1.honeycomb.io` in the configuration file.
You can also configure the SDK using [environment variables](https://opentelemetry.io/docs/languages/sdk-configuration/general/).
#### Run Your Application
Point the SDK at your configuration file using the `OTEL_CONFIG_FILE` environment variable, then run your application:
```shell theme={}
OTEL_CONFIG_FILE=./otelconfig.yaml go run YOUR_APPLICATION_NAME.go
```
Be sure to replace `YOUR_APPLICATION_NAME` with the name of your application's main file.
In Honeycomb's UI, you should now see your application's incoming requests and outgoing HTTP calls generate traces.
#### Acquire Dependencies
Add these gems to your Gemfile:
```ruby theme={}
gem 'opentelemetry-sdk'
gem 'opentelemetry-exporter-otlp'
gem 'opentelemetry-instrumentation-all'
```
| Gem | Description |
| ----------------------------------- | ----------------------------------------------------------------------------------------------------------------------------------------------------------------------------------- |
| `opentelemetry-sdk` | Required to create spans |
| `opentelemetry-exporter-otlp` | An exporter to send data in the OTLP format |
| `opentelemetry-instrumentation-all` | A meta package that provides instrumentation for Rails, Sinatra, several HTTP libraries, [and more](https://github.com/open-telemetry/opentelemetry-ruby#instrumentation-libraries) |
Install the gems using your terminal:
```shell theme={}
bundle install
```
#### Initialize
Initialize OpenTelemetry early in your application lifecycle.
For Rails applications, we recommend that you use a Rails initializer.
For other Ruby services, initialize as early as possible in the startup process.
```ruby theme={}
# config/initializers/opentelemetry.rb
require 'opentelemetry/sdk'
require 'opentelemetry/exporter/otlp'
require 'opentelemetry/instrumentation/all'
OpenTelemetry::SDK.configure do |c|
c.use_all() # enables all instrumentation!
end
```
#### Configure the OpenTelemetry SDK
Use environment variables to configure OpenTelemetry to send events to Honeycomb:
```ruby theme={}
export OTEL_EXPORTER_OTLP_ENDPOINT="https://api.honeycomb.io" # US instance
#export OTEL_EXPORTER_OTLP_ENDPOINT="https://api.eu1.honeycomb.io" # EU instance
export OTEL_EXPORTER_OTLP_HEADERS="x-honeycomb-team=your-api-key"
export OTEL_SERVICE_NAME="your-service-name"
```
| Variable | Description |
| ----------------------------- | ---------------------------------------------------------------------------------------------------------------------------------------------------------------------------------------------------------------------------------------- |
| `OTEL_EXPORTER_OTLP_ENDPOINT` | Base endpoint to which you want to send your telemetry data. |
| `OTEL_EXPORTER_OTLP_HEADERS` | List of headers to apply to all outgoing telemetry data. Place your API Key generated in Honeycomb in the `x-honeycomb-team` header. [Learn how to find your Honeycomb API Key](/configure/environments/manage-api-keys/#find-api-keys). |
| `OTEL_SERVICE_NAME` | Service name. When you send data, Honeycomb creates a dataset in which to store your data and uses this as the name. Can be any string. |
#### Run Your Application
Run your Ruby application.
In Honeycomb's UI, you should now see your application's incoming requests and outgoing HTTP calls generate traces.
Refer to [Honeycomb for Kubernetes Overview](/send-data/kubernetes/) for a Quick Start and all configuration options to get Kubernetes metrics, logs, events, as well as Kubernetes attributes added to application traces, logs, and metrics in Honeycomb.
If your preferred language is not covered here, you can find relevant instrumentation information in the [OpenTelemetry community documentation](https://opentelemetry.io/docs/languages/).
For Rust, we recommend you use the [opentelemetry](https://crates.io/crates/opentelemetry) and [opentelemetry-otlp](https://crates.io/crates/opentelemetry-otlp) crates to send data to Honeycomb over OTLP.
For any required configuration values, see [Using the Honeycomb OpenTelemetry Endpoint](/send-data/opentelemetry/#using-the-honeycomb-opentelemetry-endpoint).
### Generate Automated Data
Now that you have added automatic instrumentation to your application and have it running in your development environment, interact with your application by making a few requests.
Making requests to your service will generate telemetry data and send it to Honeycomb where it will appear in the Honeycomb UI within seconds.
If you have made several service requests in your development environment and after several minutes, you still do not see any data, reach out for help in our [Pollinators Community Slack](/troubleshoot/community/#join-pollinators-community-slack).
### View an Example Trace
Before you move on, take a look at the data that you have generated using automatic instrumentation by [viewing an example trace](/investigate/analyze/explore-traces/), which is a visual diagram that represents the complete journey of a request or transaction as it traverses a distributed system.
Traces provide a way to visualize and understand the flow of execution and the interactions between various components involved in serving a request.
They can help you find the source of errors in a system, identify the slowest processes, and break down the user experience in great detail.
While Honeycomb helps you analyze all of your outputs, where we particularly shine is when working with traces to give you a visual representation of where requests spend time in your system.
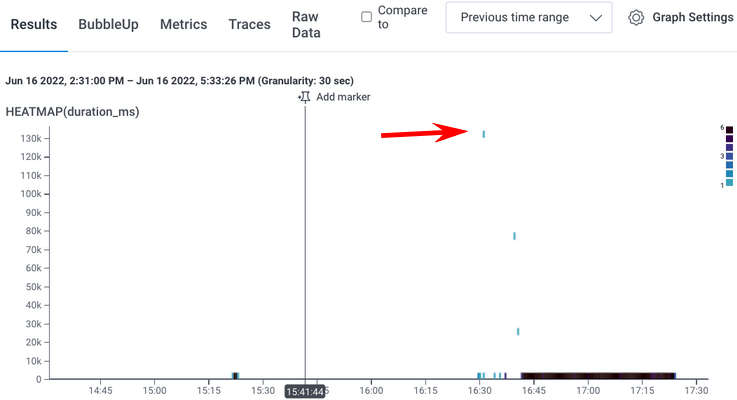
In this example, we want to see a count of events, an average latency for those events, and a heatmap of latency.
To see your trace:
1. Depending on where you created your account, either [log in to Honeycomb US](https://ui.honeycomb.io/) or [log in to Honeycomb EU](https://ui.eu1.honeycomb.io) using your Honeycomb account.
2. From the left sidebar, navigate to **Query**.
3. In the **SELECT** clause, add `HEATMAP(duration_ms)`
4. Select **Run Query**.
5. In the heatmap results, click on a dot to get a trace.
We generated the following examples after adding automatic instrumentation to a simple greeting service application written in Node.js.
You can [see the code in our GitHub repository](https://github.com/brianlangbecker/best-practices-blog).
Here's our example heatmap:
 And here is our example trace:
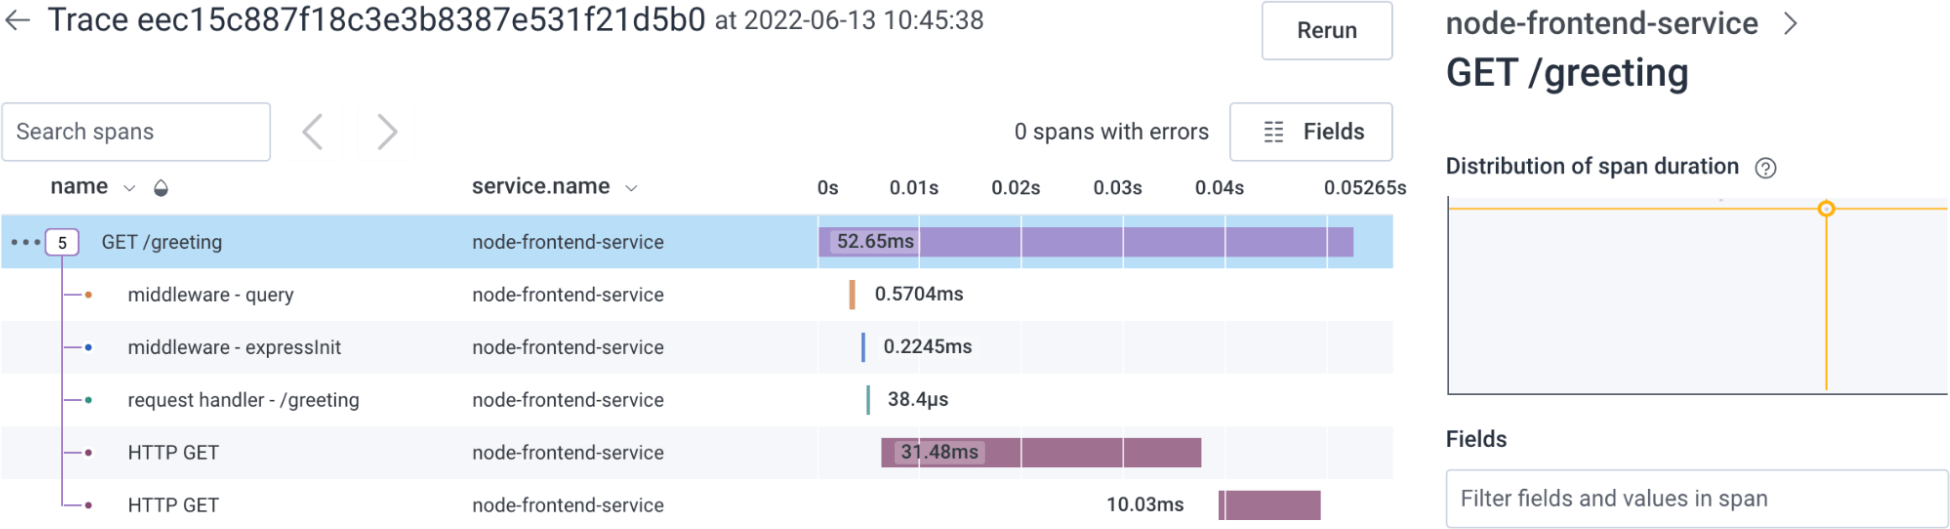 In this trace, you can see:
* the spans within the trace
* how long each span took
* which spans contain errors (none, in this example)
All of this is useful information, but more information will allow us to dig even more deeply!
To get the most insight into your system, you should enhance your automatic instrumentation by [adding custom instrumentation](/send-data/standardize/add-custom-instrumentation/) surrounding your business logic.
## What's Next?
Excellent work!
If you made it this far, you should now have telemetry data from your application flowing into Honeycomb.
You can deploy to production and start gaining new insights on real traffic!
But there is so much more to explore!
To learn more about what you can do with Honeycomb, check out:
* [Customize Instrumentation](/send-data/standardize/add-custom-instrumentation/): Walk through the process of adding custom instrumentation, so you can get additional visibility into the inner workings of your business logic.
* [Ways to Explore Your Data](/observe/): Get a quick run-through of the different ways you can explore your data in Honeycomb.
* [Board Templates](/observe/boards/): Get key insights with one-click with out-of-the-box Board Templates.
* [Honeycomb's Sandbox](https://play.honeycomb.io/sandbox/tours): Explore common scenarios with real data.
* [DevRel Office Hours](https://www.honeycomb.io/devrel/observability-office-hours/): Join in on observability talk with world-class experts.
* [Integrations](/integrations/): Learn about other types of data you can explore with Honeycomb.
In this trace, you can see:
* the spans within the trace
* how long each span took
* which spans contain errors (none, in this example)
All of this is useful information, but more information will allow us to dig even more deeply!
To get the most insight into your system, you should enhance your automatic instrumentation by [adding custom instrumentation](/send-data/standardize/add-custom-instrumentation/) surrounding your business logic.
## What's Next?
Excellent work!
If you made it this far, you should now have telemetry data from your application flowing into Honeycomb.
You can deploy to production and start gaining new insights on real traffic!
But there is so much more to explore!
To learn more about what you can do with Honeycomb, check out:
* [Customize Instrumentation](/send-data/standardize/add-custom-instrumentation/): Walk through the process of adding custom instrumentation, so you can get additional visibility into the inner workings of your business logic.
* [Ways to Explore Your Data](/observe/): Get a quick run-through of the different ways you can explore your data in Honeycomb.
* [Board Templates](/observe/boards/): Get key insights with one-click with out-of-the-box Board Templates.
* [Honeycomb's Sandbox](https://play.honeycomb.io/sandbox/tours): Explore common scenarios with real data.
* [DevRel Office Hours](https://www.honeycomb.io/devrel/observability-office-hours/): Join in on observability talk with world-class experts.
* [Integrations](/integrations/): Learn about other types of data you can explore with Honeycomb.