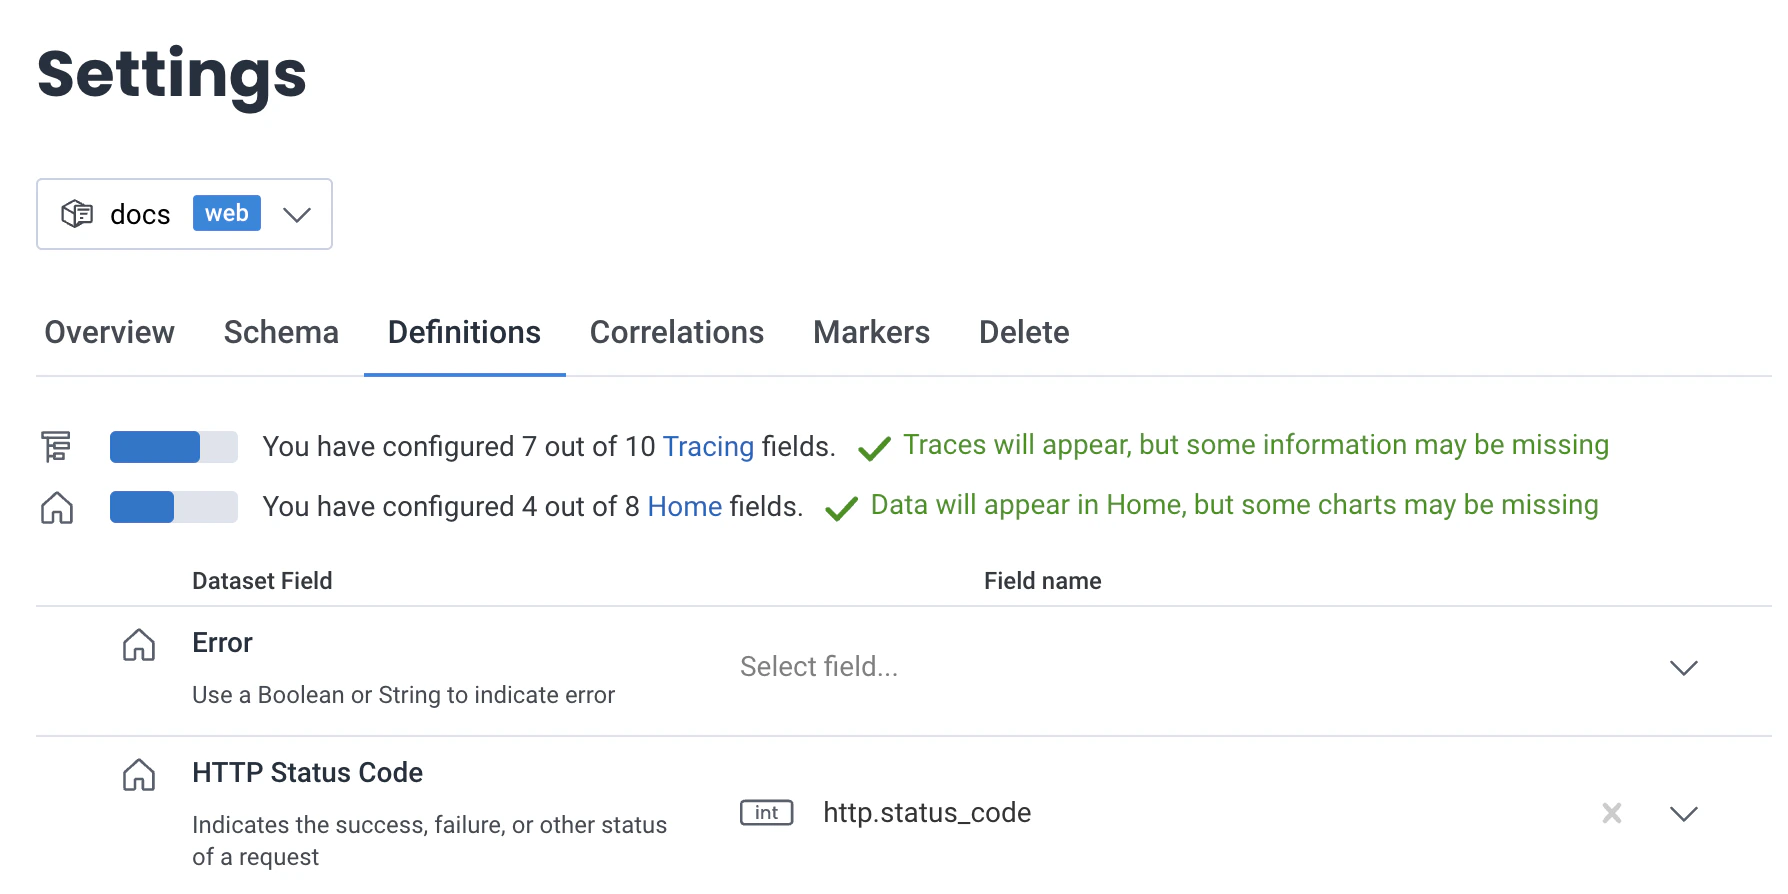
The Definitions tab in your Dataset Settings allows you to define how specific fields in your Honeycomb dataset should be interpreted.
Dataset Definitions set the visualization fields in the trace waterfall and in Home.
Some Dataset Definitions automatically populate when using OpenTelemetry or Beelines instrumentation, but additional definition of these fields is possible.
Access Dataset Definitions
Choose your method of accessing Dataset Definitions through Dataset Settings:
- In Home, select Dataset Settings for the selected Dataset.
In Settings, select the Definitions tab.
- After selecting Datasets from Manage Data in the left menu, select a dataset to view its Dataset Settings.
In Settings, select the Definitions tab.
Dataset Definitions appear in the Definitions tab.
Use the dropdown window in the top left of the Settings Page to navigate between specific Datasets and their definitions settings.
View Dataset Definitions
At the top of Dataset Definitions, two configuration completion indicators appear: Tracing () and Home ().
Each indicator displays the level of field configuration completion in progress bar and in numerical format.
If all fields are configured, then text will confirm completion.
Otherwise, it warns about missing displays.
Below the indicators, Dataset Definitions appear in rows.
Each row consists of one or more icons, the Dataset field, and the Field name.
The icons indicate if the Dataset Definition applies to the display configuration of Tracing and/or Home.
Some Dataset fields overlap between the two configuration sets.
The Dataset field is the fixed field that Honeycomb references in its configuration.
The Field name options populate from fields in your dataset.
If a Field name is blank, a Dataset Definition is not configured.
To configure, use the dropdown list in Field name to choose from the available dataset fields.
Selecting a dataset field maps it to Honeycomb’s Dataset field.
Multiple Dataset Definitions cannot use the same dataset field.
If attempted, an “all fields must be unique” error message appears in the display.
Available Definitions
Tracing
Some fields are required for the construction of a trace waterfall, while others are optional and allow us to visualize your data in a different way.
Configure all 10 Tracing fields to ensure a full trace waterfall display.
Some of these tracing fields overlap with the Home fields.
There is a table showing the meanings of each tracing field; and a second with the meanings of span annotation fields for span events and link events.
Span ID
: [REQUIRED] The unique ID for each span.
Trace ID
: [REQUIRED] The ID of the trace this span belongs to.
Parent Span ID
: [REQUIRED] The ID of this span’s parent span, the call location the current span was called from.
Name
: [REQUIRED] The name of the function or method where the span was created.
Service Name
: [REQUIRED] The name of the instrumented service.
Span Duration
: [REQUIRED] How much time the span took, in milliseconds.
Metadata: Kind
: [OPTIONAL] An attribute specifying the kind of span, for example root or child. This field previously specified span annotation types.
Metadata: Annotation Type
: An attribute specifying the type of Span Annotation.
Accepted values are: span_event or link.
Only required if you are using one or both of the Span Event or Trace Link annotation features.
For most cases, this field is not required.
This field lets Honeycomb move Span Annotations from the trace waterfall to the trace sidebar, where they are easier to find and access.
Do not use this field for purposes other than specifying the type of Span Annotation.
Learn more about Span Annotations.
Metadata: Link Span ID
: The Link Span ID allows linking to a different span (when used with Link Trace ID).
Metadata: Link Trace ID
: The Link Trace ID allows linking to a different trace or a different span in the same trace (when used with Link Span ID).
Home
Honeycomb visualizes some data on Home without any of these definitions being set.
Setting the dataset definitions for Home fields enables tabs within the Home display to be selectable.
Some of these Home fields overlap with the tracing fields.
Configure all 8 Home fields to ensure all tabs in Home are selectable.
Error
: A boolean or string indicating an error.
This field can be a calculated field.
If you use a string, any value except for "", " ", and "false" will be considered an error.
HTTP Status Code
: Indicates the success, failure, or other status of a request.
This field can be a string, integer, float or calculated field.
Read more about http status codes here.
Route
: The HTTP URL or equivalent route processed by the request.
This field can be a calculated field.
Span Duration
: How much time the span took, in milliseconds.
User
: The ID, name, email address (or another unique identifier) of the user making the request in the system.
This field can be a string, integer, float, or calculated field.
Name
: The Name field represents the name of the function or method where the span was created.
Log Message
: Value containing the log event message. May be a human-readable string message (including multiline) describing the event in free form.
Log Severity
: Severity level of the event (also known as log level). Supported values include: trace, debug, info, warn, error, fatal, and unspecified. 

