> ## Documentation Index
> Fetch the complete documentation index at: https://docs.honeycomb.io/llms.txt
> Use this file to discover all available pages before exploring further.
# Investigate Team Activity
> Use Honeycomb features with team activity logs to track configuration changes, audit resource access, and monitor how your team uses Honeycomb.
Ent
This feature is available as part of the [Honeycomb Enterprise plan](https://www.honeycomb.io/pricing/).
To help you understand how your team members are using Honeycomb, we provide access to activity logs.
Activity logs allow you to audit, or see who or what caused a change in specific resource configurations.
Activity logs support these resources:
* User logins (authentication and IP changes)
* Calculated fields, otherwise known as Derived Columns (create, update, delete)
* Service Level Objectives (SLOs) (create, update, delete, and resets)
* Service Level Indicator (SLI) expression updates
* Triggers (create, update, delete, and state changes to/from `Triggered`)
* Query results (create)
* API keys (create, update, disable)
* Burn alerts (create, update, delete, and state changes to/from `Triggered`)
Teams can access an Activity Log Environment that contains various datasets housing streams of activity related to each supported resource.
Within this Environment, team members can observe and investigate team activity with all of Honeycomb's features, including querying, visualizations, Boards, Triggers, and more.
## Report on All Team Activity
You can interact with activity logs through reports.
### Access Activity Log Reports
To access Activity Log reports, you must be a [Team Owner](/configure/teams/manage-permissions/).
To access Activity Log reports:
1. Log in to the Honeycomb UI.
2. From the navigation bar, select **Account**, then select **Team settings**.
3. Select the **Activity Log** view.
### Export Activity Log Reports
You can download all available activity for your Team into a comma-separated values (CSV) file with a standard retention window of the last 60 days.
For each entry, the downloaded file includes:
* Who performed the action
* What time the action was performed
* What kind of action was performed
* Whether or not the action succeeded or failed
To download your Activity Log reports:
1. Log in to the Honeycomb UI.
2. From the navigation bar, select **Account**, then select **Team settings**.
3. Select the **Activity Log** view.
4. Select **Download CSV**.
#### File Schema
The downloaded Activity Log CSV file uses the following schema and definitions.
Not all attributes are relevant; only some may apply to each entry.
* **timestamp**: Timestamp when the action was recorded by the system.
* **resource.type**: Type of resource the log relates to.
* **resource.action**: Create, Update, or Delete. In the case of certain resources, can be a system event.
* **resource.id**: Unique identifier associated with the resource being modified, if applicable.
* **environment.slug**: Slug (unique name) of the specific Honeycomb Environment associated with the entry, if applicable.
* **dataset.slug**: Slug (unique name) of the specific Honeycomb Dataset associated with the entry, if applicable.
* **changed\_fields**: For Create, Update, or Delete logs, attributes of the resource that changed.
* **user.id**: User's ID if the log is the result of a user action. `System` if the log is the result of an automated action.
* **user.email**: User's email address if a log is the result of a user action.
* **user.ip\_address**: IP address that generated the log (only available on User Login entries).
* **metadata**: Other information about the event or change, if available.
## Investigate Team Activity Using Activity Log Datasets
Teams also have an Activity Log Environment that contains various datasets housing streams of activity related to each supported resource.
Within this Environment, team members can observe and investigate team activity with all of Honeycomb's features, including querying, visualizations, Boards, Triggers, and more.
The standard retention period for this Environment is one year.
### Access Activity Log Datasets
All users on your team can access the Activity Log Environment and query its datasets in the Honeycomb UI, regardless of role.
Only the downloadable reports in **Team settings** (described above) are limited to [Team Owners](/configure/teams/manage-permissions/).
Through the [Honeycomb MCP server](/integrations/mcp/), the Activity Log Environment is available only to Team Owners.
To access your Activity Log Environment:
1. Log in to the Honeycomb UI.
2. Select the **Environments** label on the top-left, then select **Activity Log**.
3. Begin querying the environment and its datasets.
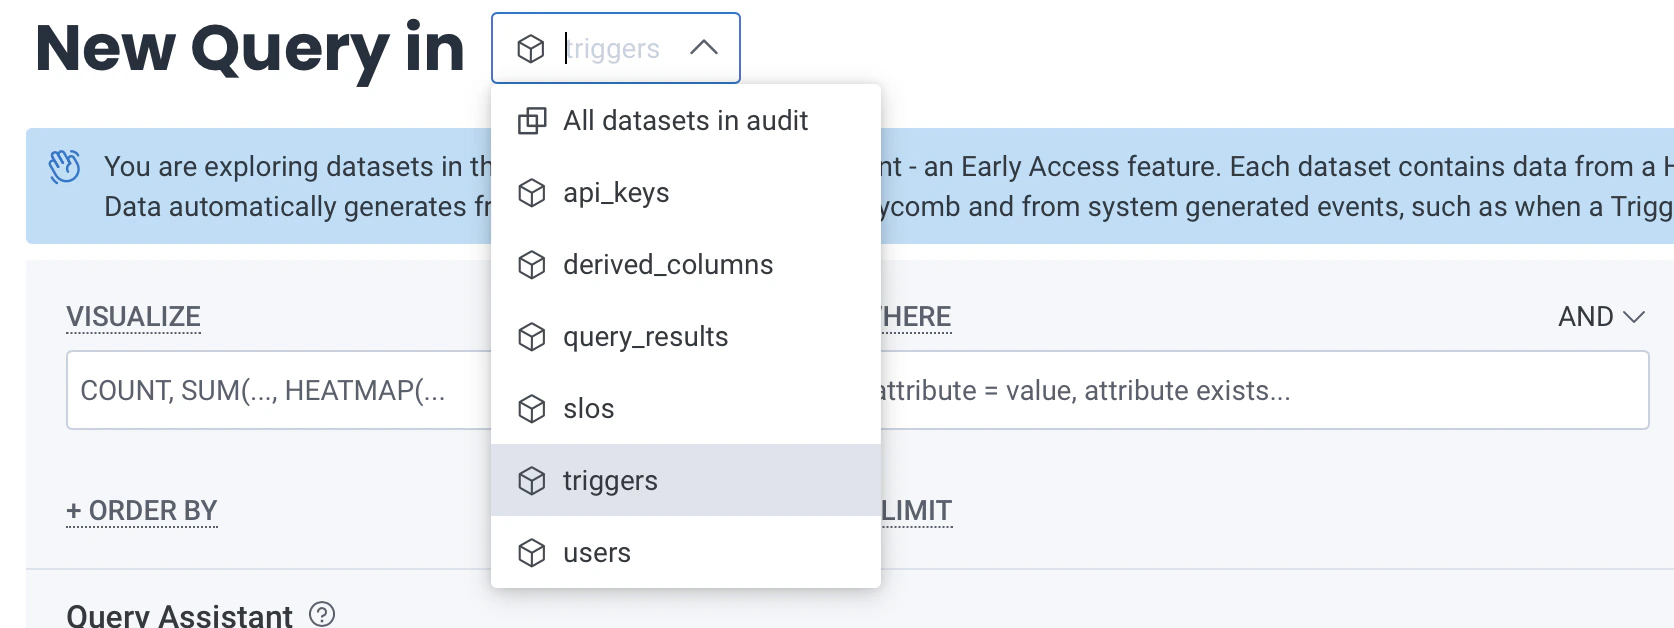
Available datasets include **API Keys**, **Calculated Fields**, **Query Results**, **Triggers**, **SLOs**, and **Users**.
 ### Explore Your Activity Log Environment
Using Honeycomb to monitor your team activity opens up a wide range of possibilities to explore.
We want to know the ways in which your team discovers and uses Activity Log data, but to help you get started exploring, check out the following ideas.
#### Find Environment-wide Data
To find the types of data available in your Activity Log Environment, run a query for **All datasets in activity log** with:
| VISUALIZE | GROUP BY |
| --------- | ------------- |
| COUNT | resource.type |
### Explore Your Activity Log Environment
Using Honeycomb to monitor your team activity opens up a wide range of possibilities to explore.
We want to know the ways in which your team discovers and uses Activity Log data, but to help you get started exploring, check out the following ideas.
#### Find Environment-wide Data
To find the types of data available in your Activity Log Environment, run a query for **All datasets in activity log** with:
| VISUALIZE | GROUP BY |
| --------- | ------------- |
| COUNT | resource.type |
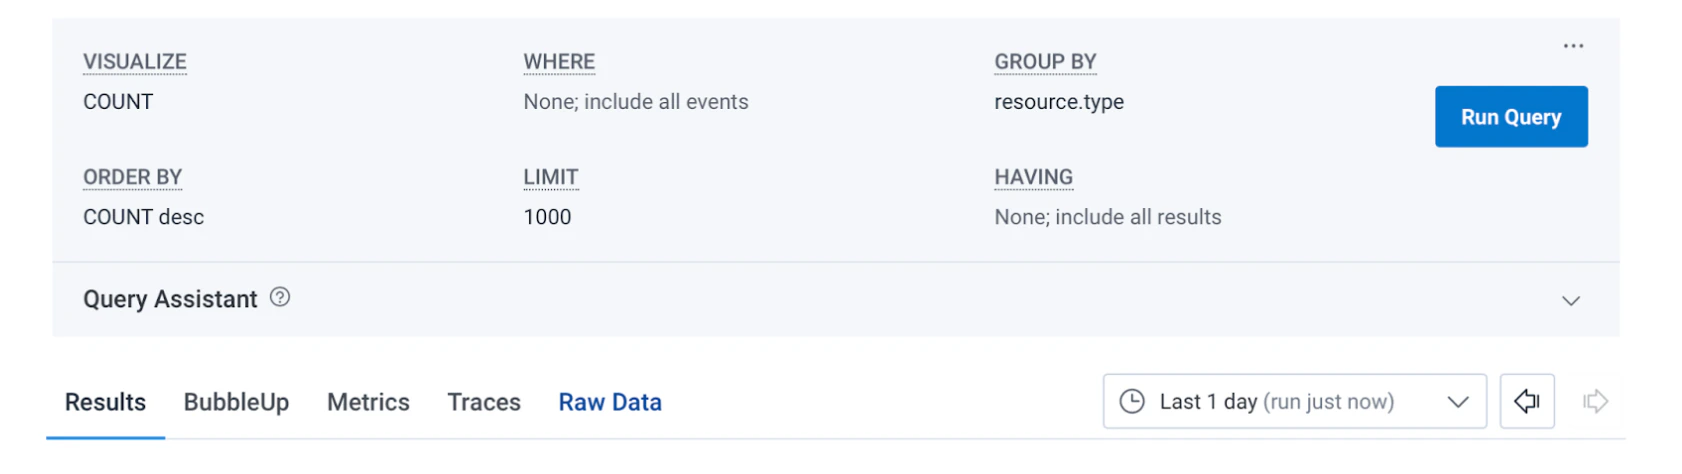 When querying, try using a `24 hour` (or `Last 1 day`) time range.
Use the time picker to modify your time range.
#### Explore Available Fields on Specific Datasets
To learn about the fields available within a dataset:
1. Run an empty query on the target Dataset.
2. In Query Builder, use the **Events** view to view the contents of each event.
In this display, each event is a row and each field is a column.
3. Use this information to construct and try different queries.
#### Find Sensitive Triggers
Find sensitive triggers, or triggers that seem to fire more than expected or tend to auto-resolve.
Once you find these triggers, consider improving their configuration to give more actionable alerts.
Use the Triggers dataset to identify how many times a trigger has fired in a given time period.
To see which triggers fire often, run a query with:
| VISUALIZE | WHERE | GROUP BY |
| --------- | --------------------------- | -------- |
| COUNT | resource.action = triggered | name |
#### Find Calculated Field Experts
Using Calculated Fields indicates advanced Honeycomb knowledge.
Find your advanced Honeycomb users.
Query the Calculated Field dataset for `Create` and `Update` actions to find out who develops Calculated Fields and uses them to explore data.
#### Find All Queries Run During Incidents
The Query Results dataset shows how many queries users run and their query patterns.
To learn which datasets users interact with most, run a query with:
| VISUALIZE | GROUP BY |
| --------- | ---------------------------------------- |
| COUNT | `environment.slug`
When querying, try using a `24 hour` (or `Last 1 day`) time range.
Use the time picker to modify your time range.
#### Explore Available Fields on Specific Datasets
To learn about the fields available within a dataset:
1. Run an empty query on the target Dataset.
2. In Query Builder, use the **Events** view to view the contents of each event.
In this display, each event is a row and each field is a column.
3. Use this information to construct and try different queries.
#### Find Sensitive Triggers
Find sensitive triggers, or triggers that seem to fire more than expected or tend to auto-resolve.
Once you find these triggers, consider improving their configuration to give more actionable alerts.
Use the Triggers dataset to identify how many times a trigger has fired in a given time period.
To see which triggers fire often, run a query with:
| VISUALIZE | WHERE | GROUP BY |
| --------- | --------------------------- | -------- |
| COUNT | resource.action = triggered | name |
#### Find Calculated Field Experts
Using Calculated Fields indicates advanced Honeycomb knowledge.
Find your advanced Honeycomb users.
Query the Calculated Field dataset for `Create` and `Update` actions to find out who develops Calculated Fields and uses them to explore data.
#### Find All Queries Run During Incidents
The Query Results dataset shows how many queries users run and their query patterns.
To learn which datasets users interact with most, run a query with:
| VISUALIZE | GROUP BY |
| --------- | ---------------------------------------- |
| COUNT | `environment.slug`
`dataset.slug` |
To see what types of queries, or questions, that users ask during an incident, use the above query and select the time duration that maps to an incident window.
#### Find All Queries Run Using Specific Fields
Ready to retire some data?
Or are you curious about which parts of the datasets are used most?
Query the Query Results dataset to see which fields are most queried or if specific fields are queried.
To see patterns of fields being used in queries, run a query with:
| VISUALIZE | GROUP BY |
| --------- | ------------- |
| COUNT | `query.where` |
Alternatively, use a different field for **GROUP BY** with this query, such as **GROUP BY** `query.group_by` or **GROUP BY** `query.havings`.
### Example: Explore the Triggers Dataset
To learn more about the data contained in the Activity Log Dataset and understand the questions that you can ask, start by exploring the Triggers dataset.
An event for a Trigger generates each time that a team member creates, updates, or deletes a Trigger, as well as when the Trigger is triggered or resolved.
 Every Trigger event contains attributes that contain:
* the dataset slug and ID
* the environment slug and ID
* the query ID associated with the Trigger
* the name and description of the Trigger
* who or what generated the event, such as user ID, or for triggered/resolved Triggers, `system`
Events created when a user updated a Trigger will also contain values that indicate what changed about the Trigger.
### Export Activity Log data for a Specific Resource
Each Dataset within your Activity Log Environment contains a stream of activity related to one resource.
To investigate activity for a specific resource, you can export Activity Log data for the dataset that corresponds to the target resource.
To download your Activity Logs for a particular dataset:
1. Log in to the Honeycomb UI.
2. In the left navigation menu, select **Manage Data**.
3. In the list, locate and select **Datasets**.
4. Select the **Activity Log** view.
5. Select **Download CSV**.
To learn more about the information you can report on and the file schema, visit [File Schema](#file-schema).
Every Trigger event contains attributes that contain:
* the dataset slug and ID
* the environment slug and ID
* the query ID associated with the Trigger
* the name and description of the Trigger
* who or what generated the event, such as user ID, or for triggered/resolved Triggers, `system`
Events created when a user updated a Trigger will also contain values that indicate what changed about the Trigger.
### Export Activity Log data for a Specific Resource
Each Dataset within your Activity Log Environment contains a stream of activity related to one resource.
To investigate activity for a specific resource, you can export Activity Log data for the dataset that corresponds to the target resource.
To download your Activity Logs for a particular dataset:
1. Log in to the Honeycomb UI.
2. In the left navigation menu, select **Manage Data**.
3. In the list, locate and select **Datasets**.
4. Select the **Activity Log** view.
5. Select **Download CSV**.
To learn more about the information you can report on and the file schema, visit [File Schema](#file-schema).