> ## Documentation Index
> Fetch the complete documentation index at: https://docs.honeycomb.io/llms.txt
> Use this file to discover all available pages before exploring further.
# Manage Environment Markers
> Create, delete, and style markers at the Environment level to flag deployments, incidents, and feature flag changes across all datasets in that environment.
export const HnyIcon = ({alias, path, size = 16, iconColor}) => {
const iconMap = {
"home": "house.svg",
"marker": "caretFilledDown.svg",
"show-marker-options": "chatTextLeft.svg",
"download": "arrowLineDown.svg",
"trace-waterfall": "trace.svg",
"show-query-details": "listDashes.svg",
"table": "table.svg",
"log-lines": "logLines.svg",
"chart": "chartLine.svg",
"show-settings": "gear.svg",
"add": "plus.svg",
"remove": "delete.svg",
"persist": "caretDown.svg",
"close": "close.svg",
"copy": "copy.svg",
"zoom-in": "magnifyingGlassPlus.svg",
"zoom-out": "magnifyingGlassMinus.svg",
"color-assignment": "drop.svg",
"drag": "dots-six-vertical.svg",
"drawer": "drawer.svg",
"show-actions": "dotsThree.svg",
"edit": "pencil.svg",
"delete": "trash.svg",
"move": "arrowsOutCardinal.svg",
"show-legend": "circleInfo.svg",
"usage-ok": "usageGood.svg",
"usage-warning": "usageWarning.svg",
"usage-danger": "usageDanger.svg",
"open-query-builder": "query.svg",
"home-menu": "house.svg",
"query-menu": "query.svg",
"boards-menu": "board.svg",
"triggers-menu": "bell.svg",
"slos-menu": "handshake.svg",
"service-map-menu": "serviceMap.svg",
"history-menu": "clockCounterClockwise.svg",
"manage-data-menu": "cube.svg",
"usage-menu": "usageGood.svg",
"canvas-menu": "sparkle.svg",
"anomalies-menu": "anomalies.svg",
"show-details": "dotsThreeVertical.svg",
"resize-handle": "board-panel-resize-handle.png",
"standard-dataset": "cube.svg",
"trace-dataset": "cubeChat.svg",
"all-datasets": "linkedSquares.svg",
"share": "arrowBentRight.svg",
"run-in-query-builder": "arrowSquareUpRight.svg",
"link": "link.svg",
"text": "text.svg",
"receive": "arrowLineDown.svg",
"process": "lightning.svg",
"sample": "drop.svg",
"send": "arrowLineUp.svg",
"submit": "arrowUp.svg",
"canvas-menu": "sparkle.svg",
"canvas": "sparkle.svg",
"chat-about-this-page": "sparkle.svg",
"private": "lockKey.svg",
"shared": "people.svg",
"expand": "caretDown.svg",
"previous": "caretLeft.svg",
"next": "caretRight.svg",
"expand-chat": "caretLeft.svg",
"minimize-chat": "caretRight.svg",
"open-in-canvas": "arrowSquareUpRight.svg"
};
const iconBasePath = "/_assets/icons/";
const iconPath = path || (alias ? `${iconBasePath}${iconMap[alias]}` : undefined);
return ;
};
Each Environment allows you to define markers for use within it.
You can create markers at both the Dataset and the Environment level.
When you create a marker at the Dataset level, you can use it only within its associated Dataset.
When you create a marker at the Environment level, you can use it across all Datasets in your Environment.
You can manage markers and marker settings using the Honeycomb UI or the Honeycomb API.
To learn how to manage markers via the API, visit [Honeycomb API: Markers](/api/markers/).
To learn how to manage marker settings via the API, visit [Honeycomb API: Marker Settings](/api/marker-settings/).
## What are Markers?
Markers are custom labels that you can add to your data to emphasize specific data points in time, such as when you change a condition, deploy code, or have an outage.
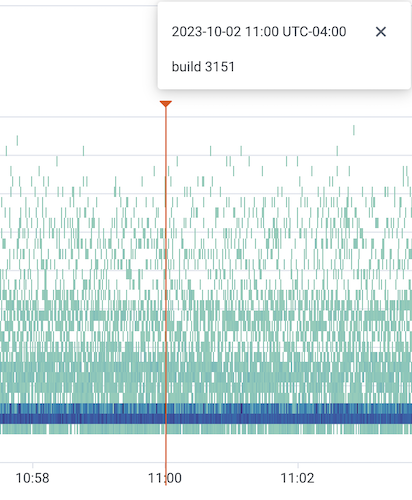
Markers display as vertical lines on graphs in Honeycomb to signal interesting occurrences within the context of your queries.
## Uses
Use markers to identify points in time, such as:
* deployments
* incidents
* activated or resolved Triggers
* enabled or disabled feature flags
You should create an Environment-level marker when the range of time is relevant across multiple datasets and services, such as a during a deployment.
## Change Marker Color
You must be a [Team Owner](/configure/teams/manage-permissions/) to change a marker's color.
To change your marker color:
1. Log in to the Honeycomb UI.
2. Select the **Environments** label on the top-left, then select **Manage Environments**.
3. In the list, locate the environment that contains the marker you want to edit, and select its name to view the available settings.
4. Select the **Markers** view.
5. In the list, locate the **Marker Type** you want to change, and select the desired color from the dropdown in the **Color** column. We save your changes automatically.
## Add Markers From the UI
To create a marker from the Honeycomb UI:
1. In your query results, move your cursor over the graph to your desired time point.
2. Select your desired time point, which causes the graph menu options to appear.
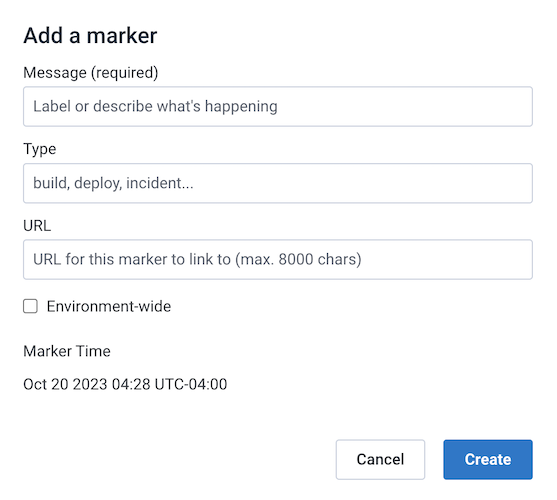
3. Select **Add marker**. The **Add a Marker** modal appears.
 4. Enter the following information:
1. A Message for your marker, such as "Deploy #299" or "Abnormal Spike in Products Page Traffic".
2. A Type for the marker, such as "deploy" or "trigger".
After creation, the type appears as a preface to the marker's message when viewing the marker details.
3. The URL field is optional, but provides a great way for more context about the marker.
4. Select the "Environment-wide" checkbox to apply this marker to **all** datasets in your environment.
5. When finished, select **Create** to add your marker to the graph.
To add markers via a command line tool or further manage existing markers, use either `curl` or `honeymarker`, a lightweight marker management tool that provides a CRUD command line interface.
Refer to our Markers documentation for more information.
## View Markers in the UI
Once created, markers appear on any queries that run within the same time period as the marker(s).
Each marker type can appear in its own color.
Hover over the Marker () to view a marker's details.
A solid vertical line appears and a window displays the marker's name, description, and if applicable, a selectable URL.
To persist the marker's vertical line and information window, select the downward caret icon.
To close the persisted display, use the icon () that appears in the window after selection.
4. Enter the following information:
1. A Message for your marker, such as "Deploy #299" or "Abnormal Spike in Products Page Traffic".
2. A Type for the marker, such as "deploy" or "trigger".
After creation, the type appears as a preface to the marker's message when viewing the marker details.
3. The URL field is optional, but provides a great way for more context about the marker.
4. Select the "Environment-wide" checkbox to apply this marker to **all** datasets in your environment.
5. When finished, select **Create** to add your marker to the graph.
To add markers via a command line tool or further manage existing markers, use either `curl` or `honeymarker`, a lightweight marker management tool that provides a CRUD command line interface.
Refer to our Markers documentation for more information.
## View Markers in the UI
Once created, markers appear on any queries that run within the same time period as the marker(s).
Each marker type can appear in its own color.
Hover over the Marker () to view a marker's details.
A solid vertical line appears and a window displays the marker's name, description, and if applicable, a selectable URL.
To persist the marker's vertical line and information window, select the downward caret icon.
To close the persisted display, use the icon () that appears in the window after selection.
 ## Filter Markers in the UI
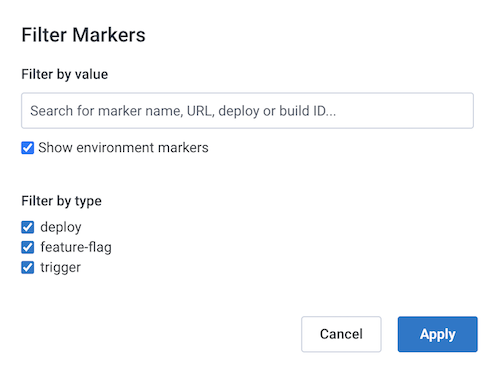
By default, Honeycomb shows environment markers in environment-wide queries and dataset markers in dataset queries.
Use **Filter Markers** to modify what markers appear in the query results.
To access **Filter Markers**, either:
1. Press `l` on your keyboard
2. Select the Marker options icon () below the time picker in your query results, and select **Filter Markers**.
The Filter Markers modal appears.
Use to modify what markers appear based on:
1. on their value
2. whether or not markers of the opposite type (environment/dataset) are allowed
3. their marker type
## Filter Markers in the UI
By default, Honeycomb shows environment markers in environment-wide queries and dataset markers in dataset queries.
Use **Filter Markers** to modify what markers appear in the query results.
To access **Filter Markers**, either:
1. Press `l` on your keyboard
2. Select the Marker options icon () below the time picker in your query results, and select **Filter Markers**.
The Filter Markers modal appears.
Use to modify what markers appear based on:
1. on their value
2. whether or not markers of the opposite type (environment/dataset) are allowed
3. their marker type